An XMM-Newton view of the serendipitous sources in the PKS0312-770 field
We describe an XMM-Newton observation of the PKS0312-770 field, which facilitates the spectral analysis of serendipitous sources previously detected by CHANDRA. The combination of larger effective area and longer exposure duration allows a significant increase in detected photons, and a lower limit in source detection sensitivity. In particular the hard X-ray normal galaxy unveiled by Fiore et al (2000) is most likely explained as a moderately absorbed (N 1022cm-2) AGN. We detect 52 sources (45 previously unreported) at a limiting flux of 2 10-15ergs cm-2 s-1 in the 0.5-2keV band. The LogN-LogS curve is consistent with that derived from by XMM-Newton observations of the Lockman Hole field. The flux determinations allow to check for any inconsistency between the calibrations of the two observatories, which is discussed.
Key Words.:
X-rays: galaxies – Surveys1 Introduction
Much of the soft X-ray background was resolved by ROSAT (in the Lockman Hole for example, Hasinger et al Hasinger98 (1998)), where the majority of sources have been identified with AGNs, although a significant fraction of obscured, hard sources - probably type II AGNs (Lehmann et al Lehmann (2001)) - were also identified. The characterisation of these faintest X-ray source populations is being revolutionised by the observations made by the CHANDRA and XMM-Newton Observatories. Their capabilities are somewhat complementary: the unprecedented CHANDRA angular resolution (Van Speybroek et al vanSpeybroek (1997)) allows for negligible background and ultimate source detection sensitivity; while the XMM-Newton telescopes (Jansen et al Jansen (2001)) offer the largest ever focussed effective area for unmatched photon gathering power.
The first deep field observations performed by these observatories (Giacconi et al Giacconi (2001); Hasinger et al Hasinger (2001); Hornschemeier et al Hornschemeier (2000) and Mushotzky et al Mushotzky (2000)) have confirmed these promises. CHANDRA observations to a source limiting sensitivity of 210-16 ergs cm-2 s-1 (0.5-2keV) resolved about 80% of the background, and found many hard spectra at faint levels which helps to resolve the “spectral paradox” of the difference between the spectrum of the background and the spectrum of bright AGN. Hornschemeier et al Hornschemeier (2000) also note an increase in proportion of normal galaxies at flux levels 310-16 ergs cm-2 s-1. XMM-Newton pushed the limits further than CHANDRA in the 5-10keV band, reaching 2.4 10-15 ergs cm-2 s-1 (Hasinger et al Hasinger (2001)). The optical follow-up of all these deep fields is still subject to extensive effort.
Relative flux normalisations of the XMM-Newton and CHANDRA observatories are as yet little explored. This normalisation has a significant impact on the studies of the source populations comprising the X-ray background, as well as on the analysis of the Sunayev-Zeldovich effect and for measurements of source variability over long temporal baselines. In the present study we compared CHANDRA and XMM-Newton data from this PKS0312-770 field to examine this normalisation calibration.
The deep fields mentioned above, have been thoroughly studied at all wavelengths, so that the identification of many objects is secure. Nevertheless, the latest harvest of fainter objects is overwhelmingly in the very red and faint end of the optical population of galaxies, rendering them difficult or impossible to analyse spectroscopically with even 8 - 10m class telescopes. To learn more about their nature and evolution requires the photometric estimate of their redshifts and/or more spectral classification of their X-ray properties. In this observation, which is more typical of Guest Observer target observations, we show the distribution of hardness ratios that could help to identify peculiar sources for follow-up.
2 The Observation
During the calibration phase of CHANDRA, the field of AGN PKS0312-770 was observed as part of the mirror point spread function determinations. Fiore et al (Fiore (2000)) described the detection of 6 sources from a 2-10keV image made by the 16 arcmin square ACIS-I detector. They then observed these objects with the ESO 3.6m EFOSC2 spectrograph. The identifications suggested 4 broad-line quasars, one quasar with possible moderate obscuration, and an apparently normal galaxy. Their X-ray analysis was limited by the low count rates, to (0.5-2)/(2-10) keV hardness ratios only, and flux estimates based on an assumed photon power law spectral model. Except for the normal galaxy, the hardness ratios were consistent with a power law absorbed by the Galactic column. For the normal galaxy, the CHANDRA data did not allow Fiore et al to discriminate between (for example) an obscured AGN hypothesis or scenarios involving beamed continuum emission and a flat power law Advection Dominated Accretion Flow models.
PKS0312-770 was observed during the XMM-Newton calibration period to characterise the XMM mirror PSF. The observation was performed on 2000-03-31 at UT 14.00h. The three EPIC cameras (Strüder et al Struder (2001), Turner et al Turner (2001)) were operated in a full frame readout mode, offering a 30 arcminute field of view. An optical blocking filter with so-called THICK aluminium layer (2000 Å of Aluminium) was employed.
The data were reduced using the XMM-Newton Science Analysis Sub-system (SASv5.0). Trials were made for a selection to discount periods of high background, arising from intense soft proton fluxes generated in magnetospheric reconnection events, and focussed by the mirrors. In a number of other observations, we found that acceptable rejection was attained by defining Good Time Intervals where the integrated flux above 10keV in energy was 2 (1) counts s-1 in EPIC PN (MOS). Above this energy the flux is dominated by particles, rather than by X-rays. The resulting clean exposure time after this selection was about 27ks, or 80% longer than the corresponding CHANDRA exposure, and was used for maximum sensitivity in the detection of faint point sources. Using a range of background rejection thresholds, we determined that in this particular observation the background proton flares were relatively modest, and we pursued the spectral analysis for all objects of the Fiore et al Fiore (2000) study with data extracted from the full observation duration, in order to maximise the photon counts.
3 Point Source Detections
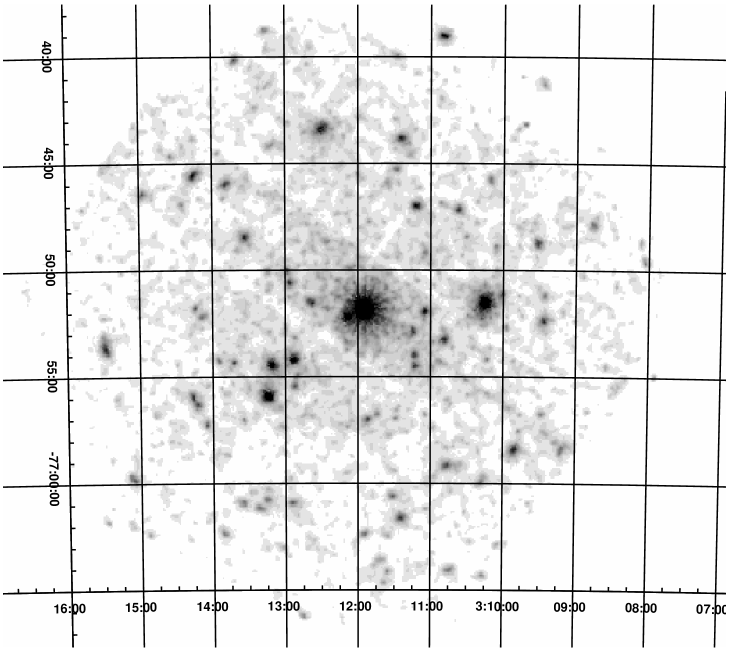
Fig. 1 shows the merged image of all 3 EPIC cameras, in the 0.5-2keV band, following a Gaussian smoothing of 4arcseconds.
The bright central target source was within 2 arcseconds of the requested pointing, and its centroid did not move significantly throughout the observation. The early calibration and performance/verification phase, demonstrated that the achieved pointing measurement accuracy is typically 4 arcseconds r.m.s.. Our astrometric discrepancy is therefore well within expectations
Marked on the image of Fig. 2 (in 2 - 10 keV) are the location of the sources P1 - P6 noted by Fiore et al Fiore (2000). They were each found within a 3 arcsec radius of the reported CHANDRA locations. The average displacement from CHANDRA-reported locations is -1 arcsecond in RA and -1.5 arcseconds in Dec, with a possible field rotation (0.1 degree)accounting for part of this discrepancy. Such a rotation could degrade position locations for objects at the edge of our field to 5 - 6 arcseconds.
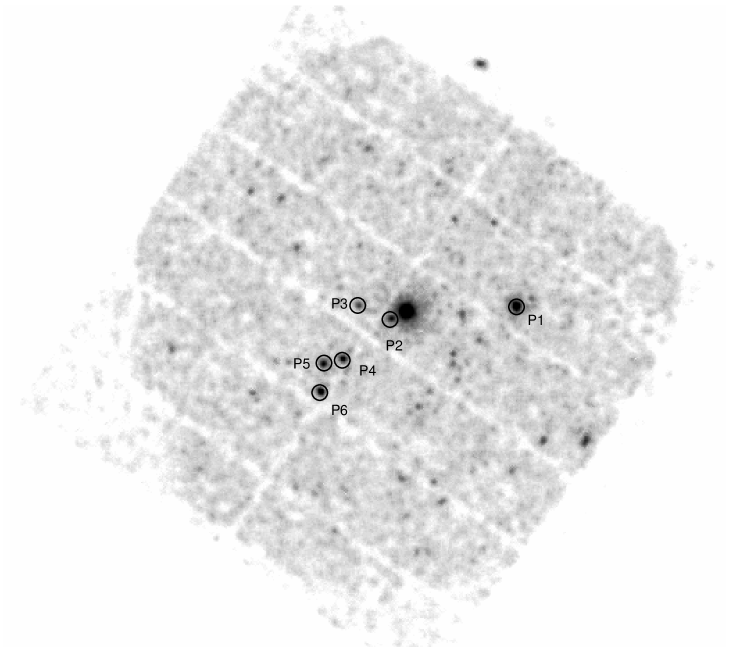
Table 1 tabulates the sources which are detected in the 0.5-2 and 2-10keV bands. This source detection list was established from the reduced low background (27ks) portion of the exposure. The XMM-SAS task was used to perform a sliding box cell detection with local background subtraction, of both bands simultaneously. A detection threshold of 5 was used. We detect 52 sources in the soft band, of which 47 are detected in the hard band. 45 out of the 52 objects are previously unreported. For the newly detected sources, we estimate their 0.5-2keV fluxes assuming a simple power law spectrum (=1.7, NH=8 10 20). The fluxes of the first seven objects, already known from CHANDRA, were derived by spectral fitting, as described in Section 4.
| Source ID | RA J2000 | Dec J2000 | (0.5-2kev) | (2-10keV) | Hardness |
| Flux 10-15 ergs cm-2 s-1 | Ratio | ||||
| PKS0312-770 | 3 11 54.9 | -76 51 49.6 | 1300 | 2496 | -0.44 |
| P1 | 3 10 15.3 | -76 51 32.4 | 205 | 350 | -0.35 |
| P2 | 3 12 8.7 | -76 52 11.9 | 39 | 33 | -0.58 |
| P3 | 3 12 38.7 | -76 51 31.4 | 6 | 27 | 0.01 |
| P4 | 3 12 53.6 | -76 54 13.3 | 27 | 68 | -0.20 |
| P5 | 3 13 11.7 | -76 54 28.9 | 41 | 65 | -0.34 |
| P6 | 3 13 14.3 | -76 55 54.4 | 83 | 12 | -0.40 |
| XMMU J031049.6-763901 | 3 10 49.6 | -76 39 1.5 | 22 | 55 | -0.16 |
| XMMU J031245.7-770616 | 3 12 45.7 | -77 6 16.0 | 17 | 29 | -0.36 |
| XMMU J031230.6-764323 | 3 12 30.6 | -76 43 23.5 | 16 | 22 | -0.60 |
| XMMU J031529.1-765340 | 3 15 29.1 | -76 53 40.8 | 15 | 26 | -0.41 |
| XMMU J031416.1-764535 | 3 14 16.1 | -76 45 35.1 | 15 | 23 | -0.49 |
| XMMU J031124.4-764349 | 3 11 24.4 | -76 43 49.4 | 11 | 1.2 | -0.73 |
| XMMU J030951.1-765825 | 3 9 51.1 | -76 58 25.3 | 11 | 41 | -0.13 |
| XMMU J031105.1-765156 | 3 11 5.1 | -76 51 56.7 | 10 | 22 | -0.37 |
| XMMU J031340.8-764009 | 3 13 40.8 | -76 40 9.7 | 9.3 | 13 | -0.30 |
| XMMU J031334.1-764827 | 3 13 34.1 | -76 48 27.5 | 8.8 | 19 | -0.32 |
| XMMU J030931.6-764845 | 3 9 31.6 | -76 48 45.7 | 8.7 | 7.6 | -0.50 |
| XMMU J031348.8-764557 | 3 13 48.8 | -76 45 57.5 | 8.6 | 27 | -0.17 |
| XMMU J030927.0-765224 | 3 9 27.0 | -76 52 24.2 | 8.0 | 2.4 | -0.79 |
| XMMU J031124.4-770137 | 3 11 24.4 | -77 1 37.9 | 7.2 | 15 | -0.26 |
| XMMU J031049.1-765316 | 3 10 49.1 | -76 53 16.2 | 7.1 | 16 | -0.33 |
| XMMU J031037.1-764710 | 3 10 37.1 | -76 47 10.7 | 6.7 | 20 | -0.08 |
| XMMU J031112.5-764659 | 3 11 12.5 | -76 46 59.7 | 6.3 | 7.4 | -0.47 |
| XMMU J031416.3-765558 | 3 14 16.3 | -76 55 58.0 | 5.9 | 13 | -0.29 |
| XMMU J031011.0-764546 | 3 10 11.0 | -76 45 46.3 | 5.2 | 2.2 | -0.72 |
| XMMU J031320.2-770110 | 3 13 20.2 | -77 1 10.9 | 5.2 | 8.1 | -0.21 |
| XMMU J031256.6-765036 | 3 12 56.6 | -76 50 36.2 | 5.1 | 2.7 | -0.68 |
| XMMU J030911.9-765824 | 3 9 11.9 | -76 58 24.9 | 5.1 | 8.1 | 0.43 |
| XMMU J031114.5-765252 | 3 11 14.5 | -76 52 52.8 | 4.9 | 1.6 | -0.76 |
| XMMU J031148.9-770222 | 3 11 48.9 | -77 2 22.5 | 4.9 | 4.1 | -0.47 |
| XMMU J030803.3-764938 | 3 8 3.3 | -76 49 38.3 | 4.7 | 10 | -0.21 |
| XMMU J031113.6-765358 | 3 11 13.6 | -76 53 58.4 | 4.7 | 15 | -0.11 |
| XMMU J031113.3-765430 | 3 11 13.3 | -76 54 30.7 | 4.4 | 12 | -0.22 |
| XMMU J030928.6-765642 | 3 9 28.6 | -76 56 42.1 | 4.4 | - | -1.00 |
| XMMU J030925.7-765109 | 3 9 25.7 | -76 51 9.0 | 4.1 | 8.5 | -0.23 |
| XMMU J031315.0-770056 | 3 13 15.0 | -77 0 56.0 | 3.9 | 4.6 | -0.59 |
| XMMU J031045.3-770405 | 3 10 45.3 | -77 4 5.1 | 3.9 | 7.7 | -0.29 |
| XMMU J031047.3-765909 | 3 10 47.3 | -76 59 9.6 | 3.8 | - | -1.00 |
| XMMU J031415.3-765716 | 3 14 15.3 | -76 57 16.6 | 3.8 | - | -1.00 |
| XMMU J031152.3-765701 | 3 11 52.3 | -76 57 1.7 | 3.7 | 4.4 | -0.56 |
| XMMU J031342.5-765421 | 3 13 42.5 | -76 54 21.5 | 3.6 | 8.9 | -0.14 |
| XMMU J031128.0-764516 | 3 11 28.0 | -76 45 16.4 | 3.6 | 1.6 | -0.47 |
| XMMU J031412.6-765619 | 3 14 12.6 | -76 56 19.6 | 3.5 | 9.1 | -0.24 |
| XMMU J031154.7-770221 | 3 11 54.7 | -77 2 21.7 | 3.5 | 11 | -0.01 |
| XMMU J031315.6-770047 | 3 13 15.6 | -77 0 47.1 | 3.5 | 5.8 | -0.27 |
| XMMU J031259.0-765001 | 3 12 59.0 | -76 50 1.3 | 3.4 | - | -1.00 |
| XMMU J031412.5-765154 | 3 14 12.5 | -76 51 54.0 | 3.4 | 3.3 | -0.38 |
| XMMU J031010.1-765956 | 3 10 10.1 | -76 59 56.3 | 3.3 | - | -1.00 |
| XMMU J031001.5-765107 | 3 10 1.50 | -76 51 7.9 | 3.2 | 12 | -0.09 |
| XMMU J031131.4-770036 | 3 11 31.4 | -77 0 36.2 | 2.6 | 9.9 | 0.04 |
| XMMU J031252.6-765525 | 3 12 52.6 | -76 55 25.7 | 2.2 | 2.3 | -0.42 |
Fig. 3 shows the cummulative LogN-LogS distribution extracted from the 0.5-2keV detections, with the fluxes based on the same simple power-law model of emission spectrum. In the flux range 10-15 – 10-14 ergs cm-2 s-1 our source counts are consistent with those presented in Hasinger et al (Hasinger (2001)), given the different values of Galactic absorption in the two fields.

In Fig. 4 we plot the hardness ratios (C2-10-C.5-2)/(C2-10+C.5-2) as a function of soft-band flux. This classification allows for follow up of source populations, for example selecting particularly hard / absorbed spectra representing type-2 hidden AGN. Dashed horizontal lines provide the location of different intrinsic absorption, when =1.7. Likewise the dotted lines reveal the location for hardness ratio at a given power law slope for the Galactic absorption only. The hardest source in the plot is the target XMMU J030911.9-765824, whose spectrum is consistent with absorption of 1022cm-2. It should be noted that care has to be taken in interpreting such plots, as particularly at the edges of the field of view, it is possible for either the PN or MOS coverage to be totally lost (see for example the hard source to N of PKS0312-770 at the field edge; it is covered only by the MOS fields of view). The uniform energy conversion factors applied for band ratios can be affected by energy-dependent vignetting factors which vary within coarse energy bands.

4 Spectral Analysis
Standard data selections in SAS comprise the removal of bad pixels, and pixels adjacent to CCD borders, of bad CCD readout frames and of spurious noise events. For the PN camera, only events contained within one or two pixels have an accurate spectral calibration and thus the remainder were excluded from the spectral fitting. For the MOS camera the canonical selection is for events classified on-board with a “PATTERN” identifier.
For each source, an extraction radius of 45 arcsec was used, unless limited by an artefact such as a CCD chip boundary. The associated encircled energy fraction is 90%. It is weakly energy dependent, but accounted for in the generation of the appropriate response functions. An additional correction for the vignetting was applied. For the PN camera this is a function of radius within the field of view. At a field angle of 10 arcminutes vignetting becomes energy dependent only above 5keV. None of the 6 brightest sources reported from CHANDRA, is further than 6 arcminutes off-axis and thus with a vignetting value of less than 75%. Thus any remnant mis-calibration will be a negligible factor for spectral fitting.
In the case of the MOS cameras the presence of the Reflection Grating Arrays, located behind the mirror modules generate an additional obscuration factor. This obscuration is almost independent of energy, but strongly depends on the azimuthal angle in the EPIC MOS focal plane. This feature is corrected in the source-specific generated response distributions with an accuracy better than 3% at a 6 arcminute off-axis angle. The residual effects are likely to affect only the calculated flux, and not the fitted power laws or absorption values.
A background region was extracted as an annulus around each source, and within the same CCD. An exception was for source P2, which is within the wings of the bright on-axis target. For this source, a region of identical size to the P2 extraction circle was taken, but at the same distance from the PKS0312-770 location, only moved in azimuth around the central target. This provides a comparable amount of contamination in the background region and in the source region.
For each source we performed a combined spectral fit with the data of the PN and both MOS cameras, using XSPEC v11.0.1. To compare with the data of Fiore et al ( power law with galactic absorption) we used a similar description, but allowed an additional absorption component at the redshift of the targets. In most cases there was no strong evidence for absorption in excess of the galactic column density (Table 2).
Following these spectral analyses we obtained the fluxes in the bands of Fiore’s analysis for comparison. The results are summarised in Figs. 5 and 6.
| Source | N | /d.o.f. | L | |
|---|---|---|---|---|
| ID | (10 | (1044 ergs s-1) | ||
| P1 | 0.0 | 1.82±0.4 | 201 / 221 | 13 |
| P2 | 0.0 | 1.95±0.15 | 88 /110 | 0.9 |
| P3 | 4.7 | 1.7 | 51 / 56 | 0.007 |
| P4 | 1.3 | 1.67 | 56 /95 | 0.7 |
| P5 | 0.4 | 1.88 | 68 / 85 | 2.1 |
| P6 | 0.2 | 1.95 | 109 /146 | 0.46 |


5 Discussion
5.1 Individual Sources
For source P1 which is the brightest of the serendipitous sources, the XMM effective area would allow more detailed fitting of spectral details than heretofore on such a faint object. However an acceptable fit is already evident with the baseline model.
We were concerned initially about contamination of source P2 by the on-axis target. However we note that at =2.4, P2 has the steepest of all the spectral slopes, yet for PKS0312-770 is 1.79, so that un-corrected contamination would harden the spectrum compared with that actually obtained. Since we reduce the accumulation radius from the 90% encircled energy to 80%, the energy-dependent part of the point-spread function caused by enhanced scattering at higher energies could result in a steeper spectrum. However even assuming a 50% miscalibration of the energy dependent inclusion fraction, the greatest change in slope would be 0.02. Thus we conclude P2 is truly a steep spectrum AGN source.
For source P3, fixing the absorption to the galactic column provides a power law slope of 1.0 (comparable with the estimate of Fiore et al Fiore (2000) ) but this is an unacceptable fit (Reduced 1.8). The free absorbing column added at the source redshift is formally, the highest value in this sample and the resulting power law returned is typical for an AGN, suggesting that the source is moderately absorbed, rather than demanding a more exotic emission mechanism. However neither the power law slope, nor the excess absorption are well-constrained, rendering it difficult to speculate on the emission mechanisms in detail.
Source P4 was poorly characterised in the Fiore et al (Fiore (2000)) optical spectroscopy. These authors speculate it is a Type 2 AGN with moderate absorption. We find slight evidence to constrain the absorption beyond the Galactic column, and find that the power law is harder than most of the objects in the sample, tending towards a type 2 AGN.
Source P6 is close to the edge of the MOS CCDs so a smaller encircled energy was used, with a possible underestimate of the energy dependent correction factor. However the spectral parameters are consistent with those obtained from the PN camera, which has more than half the combined effective area. Therefore encircled energy miscalibrations, if any, are expected to be small.
5.2 Flux Normalisation
We find a slight evidence that the XMM-determined fluxes are in excess of the CHANDRA estimated fluxes by about 10 (20)% in the soft (hard) band. There is no systematic trend in this variation with spectral slope, off-axis angle or brightness. As seen in Fig. 5, the discrepancies are small, and could be due to the normalisations resulting from the different models applied. As the XMM fluxes are estimated from a 90% encircled energy extraction region, a factor 20% over-estimate is thought unlikely to be due simply to the choice of extraction region. There is an on-going effort to reconcile the relative flux normalisations between various observatories (XMM, CHANDRA, ROSAT, ASCA and Beppo-SAX) but to date there is no evidence that XMM is significantly discrepant.
Fitting the MOS and PN cameras separately gives a flux determination on the sources which is typically within 5 - 10% consistent between the two camera types, despite the different vignetting corrections and different instrument behaviours. This allows some measure of systematic errors in the XMM-Newton fluxes, and this is lower than the apparent discrepancy between XMM EPIC and CHANDRA.
6 Conclusions
The increased XMM-Newton effective area allows a substantial improvement in photon-gathering capability compared with CHANDRA. This has been used in a follow-up of CHANDRA serendipitous sources. An unusual X-ray luminous, but otherwise apparently normal galaxy (P3) seems to be most likely explained as an obscured AGN.
We report a small deviation in fluxes derived from CHANDRA and XMM-Newton measurements. In the context of performing systematic comparisons of Log N-Log S studies, for Sunyaev-Zeldovich effect measurements, and source variability studies, this discrepancy in flux normalisations should be addressed by dedicated comparisons of selected spectral standard targets.
The LogN-LogS curve derived from this XMM-Newton field is consistent with population densities in the XMM-Newton Lockman Hole field, albeit limited by the different exposure duration, to a higher flux range.
The diagnosis of source populations of this exposure duration, typical for that expected in many guest Observer programs, confirms the rich serendipitous information to be obtained with XMM. Source fluxes can be measured down to 10-15 ergs cm-2 s-1, and hardness ratios determined to identify particularly extreme objects.
Acknowledgements.
We thank the members of the XMM Science Operations Centre, particularly those whose efforts in mission planning and operations activities were so crucial to the execution of the Calibration / PV phases of the mission.References
- (1) Dadina et al., 2001 submitted to A&A
- (2) Fiore, F., LaFranca, F., Vignali, C. et al., 2000, New Ast 5, 143
- (3) Giacconi, R., Rosati, P., Tozzi, P. et al., 2001, Ap J 551, 624
- (4) Hasinger, G., Burg, R., Giacconi, R. et al 1998 A&A 329, 482
- (5) Hasinger, G., Altieri, B., Arnaud, M. et al., 2001, A&A 365, L45
- (6) Hornschemeier, A., Brandt, W.N., Garmire, G.P. et al., 2000, ApJ 541, 49
- (7) Jansen, F., Lumb, D. H., Altieri, B. et al., 2001, A&A 365, L1
- (8) Lehmann, I., Hasinger, G., Schmidt, M., et al 2001, A&A, in press
- (9) Mushotzky, R., Cowie, L., Barger, A. and Arnaud, K. 2000, Nature 404, 459
- (10) Struder, L., Briel, U., Dennerl, K. et al., 2001, A&A 365, L18
- (11) Turner, M.J.L.T., Abbey, A., Arnaud, M. et al., 2001, A&A 365, L27
- (12) van Speybroek, L.P., Jerius,D., Edgar, R.J. et al., 1997, Proc SPIE 3113, 89
- (13) Watson, M. G., Augeres, J-L., Ballet, J. et al., 2001, A&A 365 L51