The Chandra Deep Field North Survey. VII. X-ray Emission from Lyman Break Galaxies
Abstract
We present results from stacking analyses, using the 1 Ms Chandra Deep Field North data, that constrain the X-ray emission of Lyman break galaxies at 2–4. Stacking the counts from 24 individually undetected Lyman break galaxies located within the Hubble Deep Field North, we have obtained average detections of these objects in the resulting 0.5–8.0 keV and 0.5–2.0 keV images; these images have effective exposure times of 22.4 Ms (260 days). Monte Carlo testing empirically shows the detections to be highly significant. The average rest-frame 2–8 keV luminosity of a Lyman break galaxy is derived to be erg s-1, comparable to that of the most X-ray luminous starbursts in the local Universe. The observed ratio of X-ray to -band luminosity is somewhat, but not greatly, higher than that seen from local starbursts. The X-ray emission probably arises from a combination of high-mass X-ray binaries, “super-Eddington” X-ray sources, and low-luminosity active galactic nuclei.
1 Introduction
Over the last few years, the Lyman break technique has been used extensively to isolate galaxies at 2–4 (e.g., Steidel et al. 1996; Lowenthal et al. 1997; Dickinson 1998; Steidel et al. 1999) observed near the peak in the cosmic star-formation rate (e.g., Blain et al. 1999). These objects often exhibit stellar and interstellar absorption lines characteristic of local starburst galaxies. Their morphologies are varied, with multiple knots of emission and diffuse wispy tails that suggest nonrelaxed systems. The Lyman break technique has found particular application in the Hubble Deep Field North (HDF-N; Williams et al. 1996) due to the excellent imaging data and photometry available there, although the small angular size of the HDF-N limits somewhat its utility for statistical studies (e.g., Dickinson 1998).
We have recently completed an Ms observation of the HDF-N and its environs with the Chandra X-ray Observatory (Weisskopf et al. 2000): the Chandra Deep Field North (CDF-N; Brandt et al. 2001b, hereafter Paper V). In addition to probing luminous active galactic nuclei (AGN) throughout the Universe, this survey is also useful for studying X-ray emission from more “normal” galaxies where the emission originates from X-ray binaries, supernova remnants, and low-luminosity AGN (LLAGN; e.g., Hornschemeier et al. 2001, Paper II; Brandt et al. 2001a, Paper IV). Stacking techniques are particularly powerful in this regard, since they allow detection of X-ray emission from objects lying below the detection limit for individual sources. In Paper IV we used stacking techniques to constrain the X-ray emission from normal spiral galaxies out to 0.5–1, finding that their X-ray luminosities were not more than a factor of larger (per unit -band luminosity) than those of spiral galaxies in the local Universe (). Stacking analyses using the 480 ks of data available at the time allowed effective exposures of 5–8 Ms to be achieved.
With the additional Chandra data recently obtained and improvements in our data processing techniques, we are now able to extend our constraints on galaxy X-ray luminosities to higher redshift. This is of cosmological interest since the X-ray luminosities of normal galaxies are expected to evolve with redshift due to the changing cosmic star-formation rate (e.g., van Paradijs 1978; White & Ghosh 1998; Ghosh & White 2001; Ptak et al. 2001). Here we present constraints on the X-ray emission from the Lyman break galaxy population found in the HDF-N itself.
The Galactic column density along this line of sight is cm-2 (Stark et al. 1992). km s-1 Mpc-1, , and are adopted throughout this paper. Coordinates throughout this paper are J2000.
2 Data, Analysis, and Results
We have used the Advanced CCD Imaging Spectrometer (ACIS; G.P. Garmire et al., in preparation) data sets and basic analysis methods described in Paper V. We employ three standard X-ray bands: 0.5–8.0 keV (full band), 0.5–2.0 keV (soft band), and 2–8 keV (hard band). We use data screened with the restricted ACIS grade set defined in Table 2 of Paper V, since this screening provides significantly improved signal-to-noise for faint sources. We restrict our focus to the data obtained within the HDF-N itself; our X-ray coverage is deepest in this area, and the Chandra background and point-spread function (PSF) are relatively uniform over the HDF-N. Chandra positions within the HDF-N are good to within .
For the stacking analysis, we selected galaxies in the HDF-N itself using the spectroscopic redshift catalogs of Cohen et al. (2000), Cohen (2001), Dawson et al. (2001), and references therein. We considered the 2–4 galaxies spectroscopically identified in the HDF-N; there are 28 such objects, and most were found using the Lyman break technique (the HST filter has allowed Lyman break galaxies to be found down to in the HDF-N; e.g., Dickinson 1998). Prior to stacking, we verified that none of the objects being stacked was individually detected by Chandra. This was accomplished by searching for nearby (within ) X-ray sources found by wavdetect with a false-positive probability threshold of (Dobrzycki et al. 1999; Freeman et al. 2001); it led to the removal of one source, the AGN 123639.6+621230 (associated with CXOHDFN J123639.5+621230). We have also manually inspected Chandra images in all three of the standard X-ray bands and removed three Lyman break galaxies lying near unrelated X-ray sources. 123645.3+621153 was removed because it lies within the region covered by the faint extended source CXOHDFN J123645.0+621142. 123645.8+621411 and 123654.7+621314 were removed because they lie relatively near (6–8) the bright X-ray sources CXOHDFN J123646.3+621404 and CXOHDFN J123655.4+621311, respectively, and could be affected by the low-level wings of the Chandra PSF. While we consider it unlikely that these three Lyman break galaxies suffer from significant contamination by the unrelated X-ray sources, we wanted to be cautious and avoid any problems with the background estimation. Figure 1 shows the redshifts and magnitudes of the 24 selected objects. The median redshift of the selected objects is , corresponding to a median lookback time of 11.9 Gyr (84% of the age of the Universe) and a median luminosity distance of 25,800 Mpc (Hogg 1999). These galaxies have a range of morphologies but generally appear nonrelaxed. They do not show signs of containing AGN in their optical spectra, although the spectral quality is often limited. They were not identified as AGN candidates by Jarvis & MacAlpine (1998), Conti et al. (1999), or Sarajedini et al. (2000). Two of the 24 galaxies have weak (6–8 Jy) radio emission at 8.5 GHz (Richards et al. 1998); this emission could be due to either starburst activity or AGN.
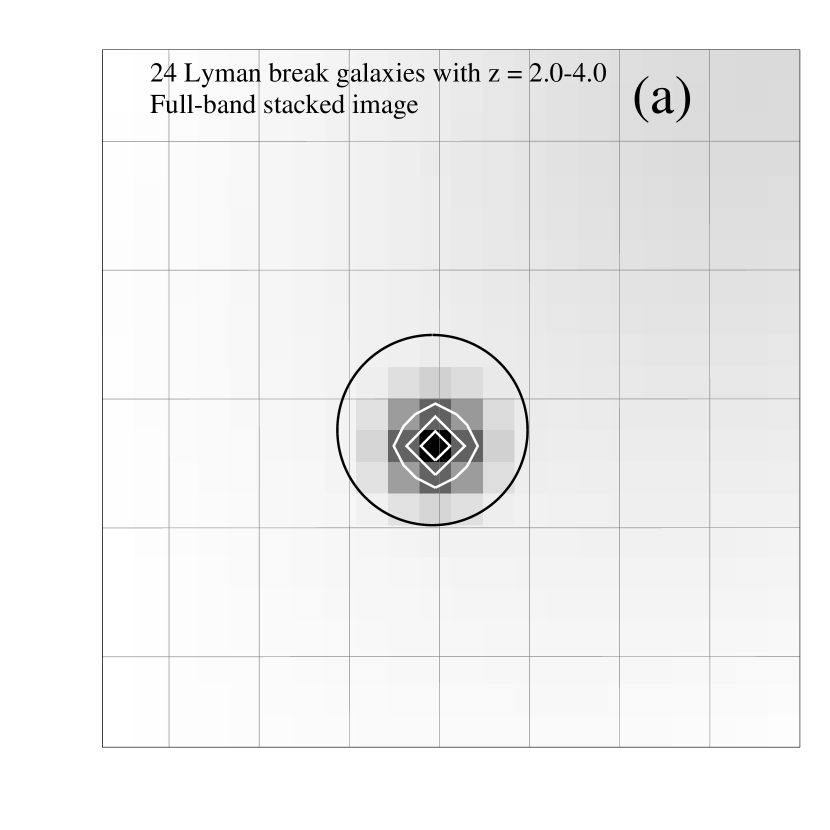
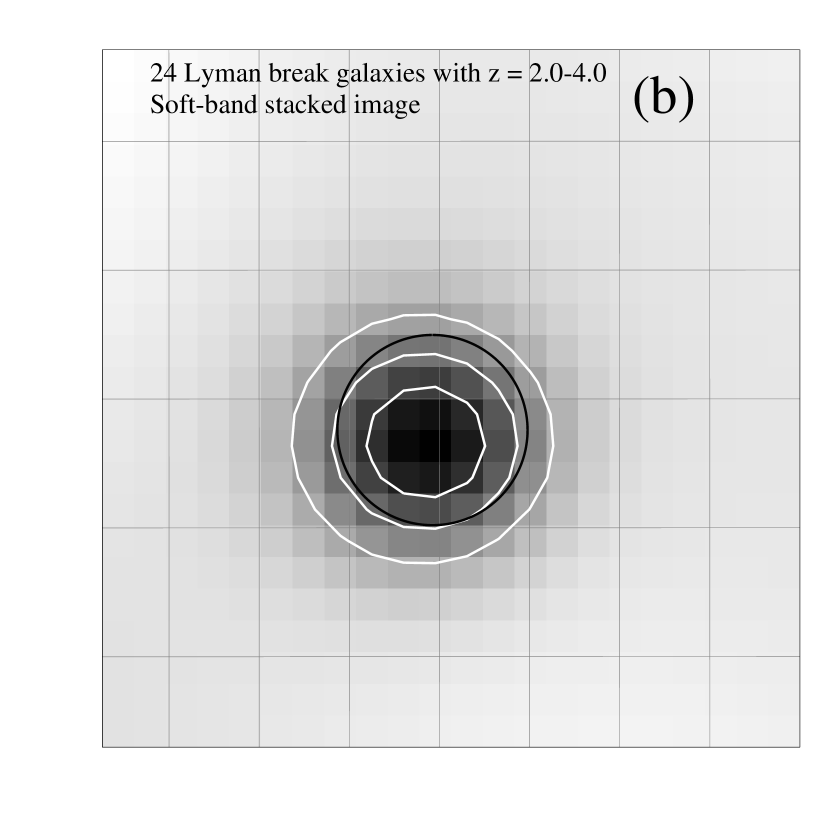
For each of the standard X-ray bands, we stacked “cutout” images centered on the positions of the 24 selected galaxies. For the photometry below we use an approximately circular aperture comprised of the 30 pixels with centers within of the stacking position (see §3.4 of Paper IV). In Figure 2 we show the number of full-band and soft-band counts obtained for each of the individual galaxies being stacked, and in Figure 3 we show images created from the stacked data. The stacked full-band image has an effective exposure time of 22.44 Ms (260 days). In this image, we find 164 counts within the 30-pixel aperture, while 134.3 are expected from the background. The Poisson probability of obtaining 164 counts or more when 134.3 are expected is , indicating a detection at the 99.5% confidence level. In the stacked soft-band image (22.46 Ms exposure), we find 43 counts when 26.2 are expected from background, corresponding to a detection at the 99.9% confidence level. The higher significance of the soft-band detection is most likely due to the lower background in this band. No significant detection is obtained in the hard band; unfortunately, the spectral constraint implied by the hard-band nondetection is not physically interesting.
Following Appendix A of Paper IV, we performed Monte Carlo stacking simulations to assess false-detection probabilities empirically. For each band, we performed 100,000 trials where we stacked 24 random positions using the same photometry aperture as was used for the Lyman break galaxies above. The random positions were chosen to lie within “local background regions” centered on each of the Lyman break galaxies (avoiding known Chandra sources) to reproduce the actual background as closely as possible. Figure 4 displays the number of trials giving a particular number of counts for the full and soft bands. The resulting distributions are very nearly Gaussian. In the full band 518 of the 100,000 stacking trials gave 164 counts or more; the corresponding detection confidence level of 99.5% is in excellent agreement with that computed from Poisson statistics above. In the soft band 103 of the 100,000 stacking trials gave 43 counts or more; again the corresponding detection confidence level of 99.9% agrees well with Poisson statistics. Again, no significant detection is obtained in the hard band.
We performed several additional tests to verify the robustness of our results. If we include the three Lyman break galaxies excluded above because they lie near to unrelated X-ray sources (123645.3+621153, 123645.8+621411, and 123654.7+621314), the statistical significance of our results is improved. We varied the size of the local background regions to examine if background gradients could be confusing the stacking analysis; our results remain highly significant for local background region sizes of , , and . Because use of the local background regions limits the number of independent random positions that can be chosen in the Monte Carlo simulations, we also performed simulations with “global background regions.” For these simulations we drew the random positions from larger areas, not restricting the positions to lie close to the Lyman break galaxies. The statistical significance of our results remained the same or was slightly improved. Finally, we varied the size of our photometry aperture, and our results remain significant for reasonable aperture-size choices. In fact, reducing the aperture size to include only the 14 pixels with centers within of the stacking position improves the statistical significance by a further factor of in both the full and soft bands.
We note that our results cannot be explained by instrumental effects (e.g., subtle cosmic ray afterglows) since such effects will not be preferentially correlated with Lyman break galaxies. Moreover, unrelated galaxies at lower redshift that by chance lie within our stacking apertures cannot explain the observed signal since these galaxies will be found equally in both the Lyman break galaxy stacking and the Monte Carlo simulations.
3 Discussion
The stacking analyses above extend our ability to detect relatively normal galaxies in the X-ray band to substantially higher redshifts ( 2–4) than was previously possible. At the median redshift of our sample of , the observed-frame full and soft bands correspond to rest-frame bands of 2.0–31.4 keV and 2.0–7.8 keV, respectively. Provided the basic X-ray production mechanisms of Lyman break galaxies are similar to those of spiral galaxies in the local Universe, the emission in these bands should have an effective power-law photon index of (e.g., Kim, Fabbiano, & Trinchieri 1992; Ptak et al. 1999); this is a typical photon index for both X-ray binaries and LLAGN. In the soft band, where we obtain the highest significance detection, the measured count rate ( count s-1) corresponds to an average observed-frame flux of erg cm-2 s-1 and an average rest-frame 2.0–7.8 keV luminosity of erg s-1 (at the median redshift).111For comparison, our soft-band flux limit for a single source is erg cm-2 s-1, corresponding to a rest-frame 2.0–7.8 keV luminosity of erg s-1. Note that these Lyman break galaxies are times more luminous from 2–8 keV than the 11 normal spiral galaxies at studied in §4.2 of Paper IV. Since these Lyman break galaxies are thought to contain significant starburst activity (see §1), it is appropriate to compare their X-ray luminosities to those of local starbursts. On average the 2–8 keV luminosities of these Lyman break galaxies are times larger than that of the starburst galaxy M82 (e.g., Griffiths et al. 2000; Kaaret et al. 2001) and are comparable to that of NGC 3256, one of the most X-ray luminous starbursts in the local Universe (e.g., Moran, Lehnert, & Helfand 1999; Lira et al. 2001). The star-formation rates in these Lyman break galaxies are uncertain but are thought to be often 30–50 M⊙ yr-1, compared to M⊙ yr-1 for M82 and M⊙ yr-1 for NGC 3256.
The HDF-N Lyman break galaxies are optically luminous with -band luminosities somewhat greater than present-day ; a present-day galaxy has a -band luminosity density of erg s-1 Hz-1 (e.g., Blanton et al. 2001). The 24 Lyman break galaxies used in the stacking analysis above have a mean rest-frame erg s-1 Hz-1 [the median erg s-1 Hz-1, and the range is (0.4–6.6) erg s-1 Hz-1]; this is times larger than for the 11 normal spiral galaxies at studied in §4.2 of Paper IV.222The rest-frame values for the Lyman break galaxies have been calculated using the observed-frame -band data in Table 2 of Papovich, Dickinson, & Ferguson (2001) and the irregular galaxy spectral energy distribution from Coleman, Wu, & Weedman (1980). The good match between the -band data and rest-frame for these objects removes nearly all of the dependence of on the spectral energy distribution. Therefore, the HDF-N Lyman break galaxies are times more X-ray luminous per unit -band luminosity than normal spiral galaxies at (also see Shapley, Fabbiano, & Eskridge 2001). An elevated ratio of X-ray to -band luminosity is observed in many starburst galaxies at low redshift. The starburst galaxies in §3 of David, Jones, & Forman (1992) have X-ray to -band luminosity ratios 3–15 times higher than for normal galaxies (for example, this ratio is times higher for M82). Thus, the X-ray to -band luminosity ratios for Lyman break galaxies are somewhat, but not greatly, higher than those of local starbursts. If the Lyman break galaxies suffered from more dust obscuration than local starbursts, this could explain their higher X-ray to -band luminosity ratios; dust would attenuate -band emission substantially more than 2–8 keV emission.
Theoretical efforts to predict the X-ray evolution of galaxies (e.g., van Paradijs 1978; White & Ghosh 1998; Ghosh & White 2001; Ptak et al. 2001) have typically focused on their low-mass X-ray binary (LMXB) populations which are predicted to peak in luminosity at . Much less work has been carried out, however, at the higher redshifts under study here. If the X-ray emission of Lyman break galaxies is indeed produced via the same mechanisms as those operating in local starburst galaxies, then high-mass X-ray binaries (HMXBs) and “super-Eddington” X-ray sources (e.g., Makishima et al. 2000) are likely to produce much of the observed emission in the rest-frame 2–8 keV band. Unlike LMXBs, which have an evolutionary timescale of yr, the X-ray emission from HMXBs should track the cosmic star-formation rate closely (any LMXBs contributing to the observed X-ray emission would have formed at ). Given the results from submillimeter and other surveys which are sensitive to star formation in dusty environments, cosmic star formation is likely to peak at roughly the redshifts under study here (e.g., Blain et al. 1999). The cosmic evolution of super-Eddington X-ray sources is impossible to predict reliably at present given that even the basic nature of these objects is poorly understood at low redshift. LLAGN with 2–8 keV luminosities erg s-1 could also contribute to the observed X-ray emission from some of these Lyman break galaxies, although none of the galaxies under study here has been found to contain an LLAGN (see §2); again, even the most basic properties of LLAGN at these redshifts are poorly constrained by current data.
Finally, these results show that the Chandra ACIS performs well at source detection even with effective exposure times of 260 days (the current longest Chandra exposures are 11.6 days for the CDF-N and the Chandra Deep Field South). Any systematic effects that cause the sensitivity to deviate from that expected due to photon statistics appear mild. Stacking analyses using deeper observations with Chandra should allow this work to be extended. Missions such as XEUS should ultimately allow the X-ray study of individual Lyman break galaxies.
References
- (1)
- (2) Blain, A.W., Smail, I., Ivison, R.J., & Kneib, J.-P. 1999, MNRAS, 302, 632
- (3)
- (4) Blanton, M.R., et al. 2001, AJ, 121, 2358
- (5)
- (6) Brandt, W.N., et al. 2001a, AJ, 122, 1 (Paper IV)
- (7)
- (8) Brandt, W.N., et al. 2001b, AJ, submitted (Paper V)
- (9)
- (10) Cohen, J.G., Hogg, D.W., Blandford, R., Cowie, L.L., Hu, E., Songaila, A., Shopbell, P., & Richberg, K. 2000, ApJ, 538, 29
- (11)
- (12) Cohen, J.G. 2001, AJ, 121, 2895
- (13)
- (14) Coleman, G.D., Wu, C.-C., & Weedman, D.W. 1980, ApJS, 43, 393
- (15)
- (16) Conti, A., Kennefick, J.D., Martini, P., & Osmer, P.S. 1999, AJ, 117, 645
- (17)
- (18) David, L.P., Jones, C., & Forman, W. 1992, ApJ, 388, 82
- (19)
- (20) Dawson, S., Stern, D., Bunker, A.J., Spinrad, H., & Dey, A. 2001, AJ, in press (astro-ph/0105043)
- (21)
- (22) Dickinson, M. 1998, in The Hubble Deep Field, eds. Livio, M., Fall, S.M., & Madau, P. (Cambridge University Press, Cambridge), p. 219
- (23)
- (24) Dobrzycki, A., Ebeling, H., Glotfelty, K., Freeman, P., Damiani, F., Elvis, M., & Calderwood, T. 1999, Chandra Detect 1.0 User Guide. Chandra X-ray Center, Cambridge
- (25)
- (26) Ebeling, H., White, D.A., & Rangarajan, F.V.N. 2001, MNRAS, submitted
- (27)
- (28) Freeman, P.E., Kashyap, V., Rosner, R., & Lamb, D.Q. 2001, ApJ, submitted
- (29)
- (30) Ghosh, P., & White, N.E. 2001, ApJ, in press
- (31)
- (32) Griffiths, R.G., et al. 2000, Science, 290, 1325
- (33)
- (34) Hogg, D.W. 1999 (astro-ph/9905116)
- (35)
- (36) Hornschemeier, A.E., et al. 2001, ApJ, 554, 742 (Paper II)
- (37)
- (38) Jarvis, R.M., & MacAlpine, G.M. 1998, AJ, 116, 2624
- (39)
- (40) Kaaret, P., Prestwich, A.H., Zezas, A., Murray, S.S., Kim, D.-W., Kilgard, R.E., Schlegel, E.M., & Ward, M.J. 2001, MNRAS, 321, L29
- (41)
- (42) Kim, D.-W., Fabbiano, G., & Trinchieri, G. 1992, ApJ, 393, 134
- (43)
- (44) Lira, P., Ward, M., Zezas, A., Alonso-Herrero, A., & Ueno, S. 2001, MNRAS, submitted
- (45)
- (46) Lowenthal, J.D., et al. 1997, ApJ, 481, 673
- (47)
- (48) Makishima, K., et al. 2000, ApJ, 535, 632
- (49)
- (50) Moran, E.C., Lehnert, M.D., & Helfand, D.J. 1999, ApJ, 526, 649
- (51)
- (52) Papovich, C., Dickinson, M., & Ferguson, H.C. 2001, ApJ, in press (astro-ph/0105087)
- (53)
- (54) Ptak, A., Serlemitsos, P., Yaqoob, T., & Mushotzky, R. 1999, ApJS, 120, 179
- (55)
- (56) Ptak, A., Griffiths, R., White, N.E., & Ghosh, P. 2001, ApJ, in press
- (57)
- (58) Richards, E.A., Kellermann, K.I., Fomalont, E.B., Windhorst, R.A., & Partridge, R.B. 1998, AJ, 116, 1039
- (59)
- (60) Sarajedini, V.L., Gilliland, R.L., & Phillips, M.M. 2000, AJ, 120, 2825
- (61)
- (62) Shapley, A., Fabbiano, G., & Eskridge, P.B. 2001, ApJ, in press (astro-ph/0106361)
- (63)
- (64) Stark, A.A., Gammie, C.F., Wilson, R.W., Bally, J., Linke, R.A., Heiles, C., & Hurwitz, M. 1992, ApJS, 79, 77
- (65)
- (66) Steidel, C.C., Giavalisco, M., Pettini, M., Dickinson, M., & Adelberger, K.L. 1996, ApJ, 462, L17
- (67)
- (68) Steidel, C.C., Adelberger, K.L., Giavalisco, M., Dickinson, M., & Pettini, M. 1999, ApJ, 519, 1
- (69)
- (70) van Paradijs, J. 1978, ApJ, 226, 586
- (71)
- (72) Weisskopf, M.C., Tananbaum, H.D., Van Speybroeck, L.P., & O’Dell, S.L. 2000, Proc. SPIE, 4012, 2
- (73)
- (74) White, N.E., & Ghosh, P. 1998, ApJ, 504, L31
- (75)
- (76) Williams, R.E., et al. 1996, AJ, 112, 1335
- (77)