Star Formation in M51 Triggered by Galaxy Interaction
Abstract
We have mapped the inner regions of M51 in the 158 m [C II] line at spatial resolution using the Far-infrared Imaging Fabry-Perot Interferometer (FIFI) on the Kuiper Airborne Observatory (KAO). The emission is peaked at the nucleus, but is detectable over the entire region mapped, which covers much of the optical disk of the galaxy. There are also two strong secondary peaks at 43% to 70% of the nuclear value located roughly to the north-east, and south-west of the nucleus. These secondary peaks are at the same distance from the nucleus as the corotation radius of the density wave pattern. The density wave also terminates at this location, and the outlying spiral structure is attributed to material clumping due to the interaction between M51 and NGC 5195. This orbit crowding results in cloud-cloud collisions, stimulating star formation, that we see as enhanced [C II] line emission. The [C II] emission at the peaks originates mainly from photodissociation regions (PDRs) formed on the surfaces of molecular clouds that are exposed to OB starlight, so that these [C II] peaks trace star formation peaks in M51. The total mass of [C II] emitting photodissociated gas is , or about 2% of the molecular gas as estimated from its CO(10) line emission. At the peak [C II] positions, the PDR gas mass to total gas mass fraction is somewhat higher, 317%, and at the secondary peaks the mass fraction of the [C II] emitting photodissociated gas can be as high as 72% of the molecular mass. Using PDR models, we estimate the far-UV field intensities are a few 100 times the local Galactic interstellar radiation field, similar to that found near OB star forming giant molecular clouds in the Milky Way. The density solution is degenerate, with both a low ( cm-3), and a high ( cm-3), density solution. Our analysis shows that a substantial amount of the observed [C II] emission from the galaxy as a whole can arise from the ionized medium, and that the contribution from the cold neutral medium (CNM) is not negligible. At the [C II] peaks, probably 7 – 36% of the [C II] emission arises from the CNM, while north-west of the nucleus, most of the observed emission may arise from the CNM.
1 Introduction
We are carrying out a study of the properties of the interstellar medium (ISM) in galaxies to understand the effects of the interplay between the global conditions of a galaxy and its star formation activity. The global properties of a galaxy most likely set the preconditions for star formation and also trigger the star formation. By “global” we are refering to the conditions in the spiral arms, interarm medium, nuclei, or individual regions in the few hundred parsec range. Interacting galaxies are excellent laboratories for this investigation because the interaction can speed up processes (e.g. increase mass flow rates) or enhance physical conditions (e.g. increase densities) in the interstellar medium. Since every galaxy is unique in some sense it is important to carry out case studies of individual interacting galaxies. Here we have chosen the galaxy M51 to investigate its ISM and its star formation activity.
The galaxy M51 (NGC 5194), also called the whirlpool galaxy, is a grand-design spiral of Hubble type Sbc. It has an inclination angle of (Tully 1974 b) and thus it is seen almost face on. The total spatial extent of M51, as seen in the visible, is about . M51 is interacting with its companion NGC 5195 which is to the north. Due to its proximity (9.6 Mpc, Sandage & Tammann 1975) and its face on appearance, M51 is one of the best studied interacting galaxies. Despite this fact some aspects of this galaxy remain a puzzle.
The star formation rate of M51 is not spectacular. It is quite normal for an isolated Sbc-Sc galaxy (Kennicutt 1998). However, M51 might have been a Sb galaxy prior to the interaction with NGC 5195 and evolved to a Sbc-Sc late-type galaxy (Tully 1974 c; Kennicutt 1998). The galaxy interaction is also believed to be responsible for the current density wave in M51 enhancing the inner spiral arm structure and triggering star formation in the spiral arms. The density wave pattern, however, terminates at corotation and the spiral arms beyond corotation are attributed to material clumping induced directly by the galaxy interaction (Tully 1974 c). It is clear from the arrangement of the ionized gas (Tully 1974 a,b,c; van der Hulst et al. 1988; Tilanus & Allen 1991), molecular gas (García-Burillo, Guélin, & Cernicharo 1993; Lo et al. 1987; Rand & Kulkarni 1990; Vogel, Kulkarni, & Scoville 1988), atomic gas (Tilanus & Allen 1989, 1991; Rots et al. 1990), and dust in the spiral arms that star formation in the arms is due to a density wave. However, the crowding of H II regions in the north-east and the south-west of M51, as seen for example in the H map of van der Hulst et al. (1988), may not be caused by the density wave but directly linked to the galaxy interaction. In this case the galaxy interaction has strong and direct control over the location and the strength of the star formation in M51.
To investigate the star formation activity, we observed M51 in the 158 m [C II] fine-structure line. The [C II] line emission from galaxies arises predominantly in the warm, dense, photodissociated surfaces of molecular clouds exposed to starlight from nearby OB stars (e.g. Stacey et al. 1991). These regions, commonly called photodissociation regions (PDRs) are heated predominantly by photoelectric ejection of energetic electrons from grains, and cooled by far-infrared (FIR) fine structure line radiation from O∘, and C+. Typically, the strongest cooling line is the [C II] line, but the [O I] 63 m line is often roughly the same strength in starburst nuclei. The [C II] line emission from moderate velocity shocks is much weaker than that from PDRs (Hollenbach and McKee 1989).
2 Observation
The observation of the [C II] fine structure line at 157.7409 m was carried out with the MPE/UCB Far-infrared Imaging Fabry-Perot Interferometer, FIFI (Poglitsch et al. 1991; Stacey et al. 1992), on board the Kuiper Airborne Observatory in June 1994 and April 1995. The field of view of the array was ( per pixel) and the beam size was ( sr; FWHM). We placed the array at 7 positions in M51. Four positions were placed apart in a square to cover the whole galaxy. To fully sample the central region, two positions were shifted diagonally in north-east and south-west directions by 1.5 pixels with respect to the center and one position was placed at the center. The center position ((0,0) position) is at RA = , Dec = (1950). The total observed field of view was . The position accuracy is estimated to be about .
Except for the position at the center all scans were carried out in “stare” mode (fixed plate separation of the resolution determining Fabry-Perot interferometer). The spectral resolution in this mode was 120 km s-1 (FWHM). To take the dispersion of the velocity shifts in M51 into account (more than 100 km s-1) we readjusted the plate separation of the Fabry-Perot interferometers for each individual array position. However, the spectral range of some of the edge pixel which cover outer parts of M51 do not cover the entire expected velocity range of the [C II] line. Those pixels were not used for the data analyses. For the center position we scanned the Fabry-Perot interferometer over 300 km s-1. The spectral resolution at this position was 114 km s-1 (FWHM). We used the H2S line at 158.0148 m to calibrate the transmission wavelength of the Fabry-Perot interferometers.
Internal blackbodies were used to flatfield the detector array. We observed the planets Jupiter (June 1994) and Mars (April 1995) for absolute calibration of our data. For the brightness temperatures of Jupiter at 158 m we used K (Hildebrand et al. 1985). We determined the brightness temperature of Mars to be 207 K at 158 m from the published values of Wright (1976) and Wright & Odenwald (1980). The mean diameter of Jupiter at the time of the observation was about and the mean diameter of Mars was about . The accuracy of the absolute calibration is about 30%.
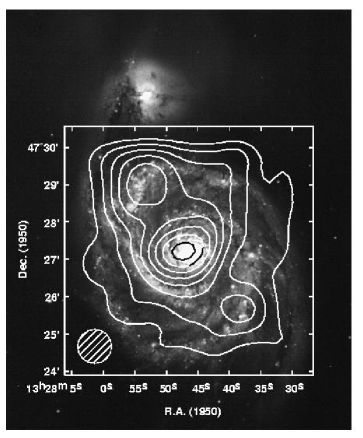
The final map of the integrated [C II] line intensity (Figure 1) was made using a maximum entropy image restoration program. This program was written especially for the FIFI data and follows the algorithm as outlined in Skilling & Bryan (1984). It takes the data from all positions observed with FIFI and reconstructs an image on a finer grid using the maximum entropy method and constrains the data points by a chi-square fit. The result is a deconvolved image which is then convolved with a (FWHM) Gaussian beam. An additional large error term was added to pixels which do not cover the full velocity range within their beam. This resulted in a smoothing effect due to a strong influence from neighboring pixels which do cover the full veloctiy range. The contour lines in the final map are smoother then in the raw map and all features can be traced back to the observed data (no artificial features were introduced by the program). On the other hand all obvious features in the observed data appear in the final map.
3 Results
3.1 Morphology
The contour map of the integrated [C II] line intensity superimposed on an optical image of M51 (Figure 1) shows that the [C II] emission is distributed over the whole galaxy, covering a total solid angle of sr and peaking at the nucleus. The integrated [C II] intensity at this peak is erg s-1cm-2sr-1. This is in very good agreement with an earlier measurement of the integrated [C II] intensity by Stacey et al. (1991) who found erg s-1cm-2sr-1 (Stacey 2001; see also Crawford et al. 1985). A comparison of the FIFI [C II] results with our ISO [C II] data of M51 will be presented in a separate paper (Nikola et al. 2002). Preliminary reduction of our [C II] ISO measurement of M51 shows a lower intensity compared to the FIFI intensity, but roughly consistent with the ratio of the beam sizes.
There is also a peak in the north-east (NE peak) of M51 (at RA = , Dec = (1950)) coinciding with an enhancement in the optical emission in the spiral arm. The integrated [C II] intensity at the NE peak is erg s-1cm-2sr-1 or about 70% of the nuclear value. A third peak in the [C II] emission in the south-west (SW peak) of M51 (at RA = , Dec = (1950)) coincides with a position of a spiral arm where enhanced optical emission can be seen. Here the integrated [C II] intensity is erg s-1cm-2sr-1.
The NE and SW peaks are roughly symmetrically aligned with respect to the nucleus, and fall on local brightness peaks in the optical spiral arms. Other than this, there is only a weak indication for spiral structure in the [C II] map. There is an extension in the [C II] emission that follows the northern spiral arm past the NE [C II] peak, but the NE and SW peaks appear to be quite localized, essentially point sources to our beam.
3.2 Comparison with FIR Continuum
A comparison of the distribution of the [C II] emission with the distribution of the FIR emission shows very good agreement. Figure 2 shows the contour map of the integrated [C II] line intensity superimposed on a contour map of the 170 m FIR continuum (Smith 1982) at a spatial resolution () similar to that of the [C II] map. The location of the main peak and the NE peak in both distributions match each other very well. There is no peak towards the SW, but there is a ridge from the nuclear region that touches our SW [C II] peak. It is likely that these are the same structures, but not coincident due to modest signal-to-noise ratios in both maps.
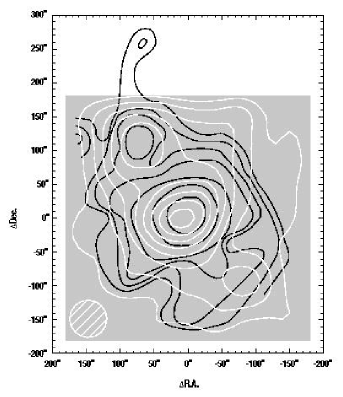
The integrated [C II] luminosity of M51 is or 1% of the FIR luminosity as measured by the IRAS satellite (, Rice et al. 1988, scaled to 9.6 Mpc). This is at the high end of the / ratio observed in galactic nuclei(Crawford et al. 1985; Stacey et al. 1991), but consistent with the reported ratios for late type galaxies (NGC 6946, Madden et al. 1993; NGC 4038/4039, Nikola et al. 1998). We use the Smith (1982) map to calculate the / ratio within our beam. To do this, we correct the Smith (1982) luminosity estimates (that include only the 80 m and 200 m contiunuum) to include the shorter wavelength FIR continuum as observed by IRAS. This correction amounts to a factor of 1.5 increase in the Smith (1982) map. The ratios range form 0.6% at the nucleus to 1.1% and 1.4% respectively at the NE and SW peaks (Table1).
| Main [C II] Peak | NE Peak | SW Peak | Total M51a) | |
| [] | ||||
| b) [] | ||||
| / | 0.6% | 1.1% | 1.4% | 1.0% |
a) Averaged over the whole galaxy M51
( sr).
b) From Smith (1982) (corrected to include flux m using
IRAS numbers)
3.3 Comparison with CO (10) Observations
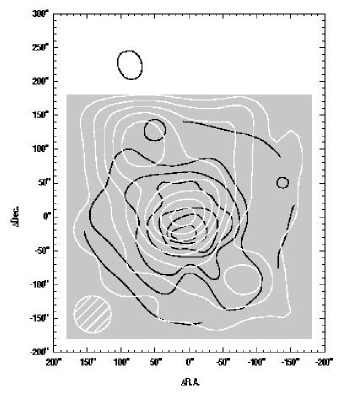
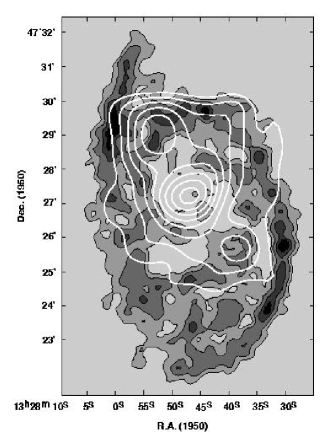
As shown by Crawford et al. (1985) and Stacey et al. (1991) the combination of the integrated [C II] intensity with the integrated intensity of the 12CO (10) line is a powerful diagnostic tool for measuring the star formation activity. To do this analysis we derived a CO (10) contour map from the CO data of Lord & Young (1990) because their observations have been carried out with a spatial resolution () similar to our [C II] observation. However, their selection of positions does not cover the whole galaxy and we interpolated over the narrow gaps in their observation. Unfortunately their coverage shows a gap at the position of the NE peak. Figure 3 shows the superposition of the [C II] contour map on top of the derived contour map of the CO (10) line. The peak integrated intensity of the CO emission is erg s-1cm-2sr-1. At the [C II] peaks we derived integrated intensities of the CO line of erg s-1cm-2sr-1 at the main [C II] peak, erg s-1cm-2sr-1 at the NE peak, and erg s-1cm-2sr-1 at the SW peak. The peak of the CO emission is not at the nominal nucleus of M51 and does not coincide with the main peak of the [C II] emission. Another observation of the CO (10) line by Scoville & Young (1983) with the same spatial resolution but worse spatial coverage shows the peak of the CO emission in the center of the galaxy. The CO (10) map of García-Burillo, Guélin, & Cernicharo (1993), with a spatial resolution of , shows a local minimum at the center and the CO peak shifted by about (, ) relative to the center of M51. This position is again in better agreement with the CO peak of Lord & Young (1990). Apart from the slightly different positions of the CO peak and the [C II] main peak both distributions are reasonable similar. The distribution of the CO emission is also elongated in north-east south-west direction and shows an extension toward the SW peak. The overall agreement suggests much of the observed [C II] emission arises in PDRs on the surface of molecular clouds.
3.4 Comparison with H Emission
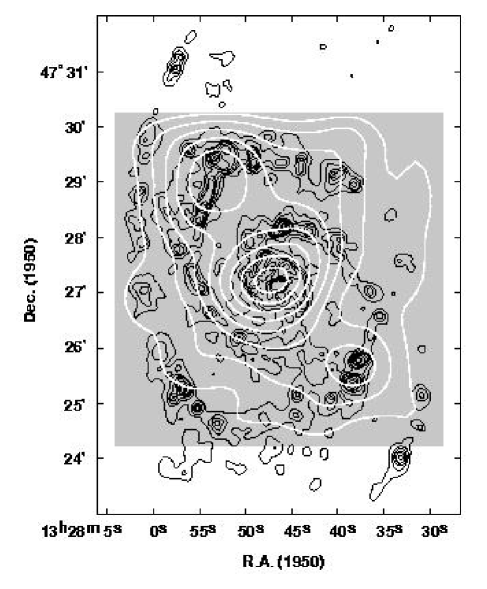
Figure 4 shows the superposition of the [C II] contour map on the H contour map of van der Hulst et al. (1988). Despite the very different spatial resolution ( for the H map) the maps are similar in the sense that the NE peak and the SW peak coincide with an accumulation of strong, discrete H knots in the spiral arms. There are three moderately strong H peaks located in the spiral arm in the south-east where we only detect weak [C II] emission. This might be the result of incomplete coverage of the full velocity dispersion at the edge of our array as described in section 2. Pixels showing this effect have not been taken into account for the data reduction. These “missing” pixels created an incomplete image plane near the edge of our field of view and can therefore easily cause the wavy contour line. Apart from this, the superposition of the [C II] map on the H map shows nicely that the [C II] emission peaks coincide with strong H II regions and that the [C II] emission therefore traces mainly PDRs in star formation regions. However, weak [C II] emission is also seen in regions where there is almost no H emission, e.g. in the west-north-west region of M51.
4 Origin of the [C II] emission in M51
4.1 Cold and warm neutral medium
Comparison of the H I column density maps of Weliachew & Gottesman (1973) and Tilanus & Allen (1991) (Figure 5) with our [C II] map shows that the distributions do not agree. The H I column density has a minimum at the center of M51 and shows a ridge of higher column density around the nucleus. On top of the H I column density ridge are several local column density maxima. The NE or SW peaks lie on this H I column density ridge but do not coincide with the local column density maxima. Although local H I column density maxima are in the vicinity of the NE and SW peak the overall morphology of the [C II] distribution and the H I column denisty distributions do not agree. It therefore seems unlikely that much of the peak [C II] emission arises from diffuse neutral medium.
Here we calculate the expected integrated [C II] intensity from the cold and warm atomic medium. For the calculation we assume that C+ behaves like a two-level system and that the [C II] radiation is optically thin. This gives:
(see also Madden et al. 1993, 1997) where is the Planck constant, is the frequency of the transition, is the Einstein coefficient for spontaneous emission, s-1 (Nussbaumer & Storey 1981), and is the ratio of the statistical weights in the upper and lower level. The first term in the equation above is due to excitation by hydrogen impacts while the second term is due to excitation by electron impacts. The critical density for collisions with atomic hydrogen, , is deduced from the cooling function for collisional excitation of [C II] by atomic hydrogen (Launay & Roueff 1977), and that for collisions with electrons, , is deduced from collision strengths for [C II] collisions with electrons (Blum & Pradhan 1992), and fitted as functions of temperature. We further assume a gas phase abundance of carbon relative to hydrogen of , that all the carbon is ionized, a beam filling factor of , and that the same range of conditions for the cold neutral medium (CNM temperature K, density cm-3 and ionization fraction and the warm neutral medium (WNM temperature K, density cm-3 and ionization fraction ) (Kulkarni & Heiles 1987; Kulkarni & Heiles 1988) of the Milky Way apply for M51. We derived the H I column density for our calculation from the gas surface density values of Lord & Young (1990) who used H I data of Rots et al. (1990) smoothed to a resolution of for their estimate. The results are given in Table 2.
| in [erg s-1cm-2sr-1] | |||||
|---|---|---|---|---|---|
| Main [C II] Peak | NE Peak | SW Peak | Total M51a) | ||
| Observed | |||||
| [cm-2] | |||||
| b) | (8%)e) | (15%) | (23%) | (32%) | |
| CNM | b) | (12%) | (24%) | (36%) | (49%) |
| b) | (12%) | (24%) | (36%) | (49%) | |
| c) | (0.6%) | (1%) | (2%) | (3%) | |
| WNM | c) | (1%) | (2.5%) | (4%) | (5%) |
| c) | (7%) | (13%) | (20%) | (27%) | |
| [pc cm-6] | 1387 | 412 | 653 | 91 | |
| d) | (30%) | (7.2%) | (16.8%) | (21%) | |
| ELDWIM | d) | (%) | (42%) | (%) | (%) |
a) Averaged over the whole galaxy M51
( sr).
b) Temperatures and densities used for CNM:
min.: cm-3, K;
max.: cm-3, K;
standard: cm-3, K;
c) Temperatures and densities used for WNM:
min.: cm-3, K;
max.: cm-3, K;
standard: cm-3, K;
d) see text for minimum and maximum contribution
e) Fractions of observed integrated [C II] intensity are
noted in parenthesis.
Clearly, emission from the WNM is not important for most of the regions mapped in [C II]. Even the maximum values for the expected integrated [C II] intensity from the WNM are below the [C II] detection limit.
A non-negligible contribution to the [C II] emission from the WNM is only possible in the north-west where extended [C II] emission at the detection limit is visible. At this position the H I column density derived from the data of Lord & Young (1990) reaches its maximum value of cm-2. The estimated contribution of the WNM in this region goes from a minimum of erg s-1cm-2sr-1 or about 7% of the integrated [C II] intensity ( erg s-1cm-2sr-1) up to a maximum of erg s-1cm-2sr-1 or 77% over the range of the physical conditions of the WNM. In this region, in the north-west, the contribution of the CNM to the integrated [C II] intensity can easily account for the total observed intensity in the north-west region. Even the minimum contribution from the CNM ( erg s-1cm-2sr-1) can account for all of the observed [C II] emission. At standard conditions ( cm-3, K) the contribution from CNM to the [C II] emission is erg s-1cm-2sr-1 which is more than 1.5 times the observed [C II] emission.
At the [C II] peak positions the estimated integrated [C II] intensity arising from the CNM can also be relatively high. The estimated fraction of [C II] emission coming from the CNM at the NE and SW peak is between % and % (see Table 2). Although the CNM contribution is smaller at the position of the main [C II] peak it is still not negligible (8 – 12%; see Table 2).
Since we assumed that all carbon in the CNM and WNM is in the form C+ and that all of the observed H I column density is associated with the [C II] emission, the estimated values are upper limits. Therefore a contribution to the [C II] emission form the CNM is likely smaller than that called out above, so that at the nucleus , NE and SW peaks, the contribution may be small (10 – 20%). However, in the north-west region of M51 the CNM could be the dominant source of the [C II] emission.
4.2 Ionized medium
The estimate of the contribution of the ionized medium to the [C II] emission is very controversial. We will discuss four different approaches here. The easiest approaches are similar to the one we used to estimate the contribution of the CNM and WNM. This leads to the following formula
where cm-3 is the critical density of C+ for collisions with electrons at 8000 K (Blum & Pradhan 1992), and is the emission measure (EM).
Klein, Wielebinski, & Beck (1984) and van der Hulst et al. (1988) determined the flux density of the thermal radio continuum from single-dish measurements with a beam size of and from interferometric measurements with a spatial resolution of , respectively. The thermal flux density derived from the interferometric measurement is about 34% of that derived from the single-dish observation and originates mainly from prominent giant H II regions with sizes of about 500 pc and electron densities of about cm-3. These H II clouds are distributed within the nuclear region of M51 and along the spiral arms. In contrast, the distribution of the thermal 2 cm radio continuum derived from the single-dish observation does not show any spiral signature.
Due to the big beam size of FIFI the main contributer of the ionized medium within the beam is most likely the extended low density warm ionized medium (ELDWIM). In our first approach we therefore estimate a possible [C II] emission from ionized gas using the single-dish measurements of the radio continuum of Klein, Wielebinski, & Beck (1984) assuming that all the thermal radio continuum arises from the ELDWIM. In this case the intensity of the thermal radio continuum is the same within the FIFI beam as within the single-dish beam. From the emission measure, derived from the thermal radio continuum, and assuming the low density limit () and a beam filling factor of unity we estimate the contribution of the ELDWIM to the observed [C II] intensity from the above formula. The flux density of the thermal radio continuum at the NE and SW peak are taken from the 2 cm thermal continuum contour map of Klein, Wielebinski, & Beck (1984; their Figure 7). The intensity of the thermal radio continuum at 2 cm () at the NE peak is mK. From this we get an emission measure of pc cm-6 (see Spitzer 1978 for the calculation) resulting in an expected integrated [C II] intensity from ELDWIM at the NE peak of erg s-1cm-2sr-1. This is about 20% of the observed integrated [C II] intensity. At the SW peak we get an intensity of the thermal radio continuum at 2 cm of mK from the contour map in Klein, Wielebinski, & Beck (1984). This leads to an emission measure of pc cm-6 and an integrated [C II] intensity of erg s-1cm-2sr-1 which is about 52% of the observed integrated intensity. Within an area of at the center of M51, Klein, Wielebinski, & Beck (1984) determined a thermal radio continuum at 2 cm of 11 mJy. Assuming again the same intensity within the FIFI beam as within this area we calculate an emission measure of pc cm-6 and an expected integrated [C II] intensity of erg s-1cm-2sr-1. This is about 90% of the observed integrated [C II] intensity. The flux density of the thermal 2 cm radio continuum of the whole galaxy M51 is mJy (Klein, Wielebinsky, & Beck 1984). This flux density was measured within an elliptical area with half axis of and . The corresponding emission measure is pc cm-6. This results in an expected mean integrated [C II] intensity from H II regions of erg s-1cm-2sr-1 for the whole galaxy which is about 21% of the observed mean integrated [C II] intensity.
In the nuclear region and the north-east region the interferometer map of the 6 cm radio continuum of van der Hulst et al. (1988) reveals numerous strong sources. Thus the assumption that all the thermal radio continuum radiation in these regions arises from ELDWIM might be too simple. In our second approach we therefore assume that 34% of the thermal radio continuum arises from clumpy H II regions as indicated in the radio continuum map of van der Hulst et al. (1988). Correcting for beam filling from the beam to the beam and assuming an electron density of cm-3 for the clumpy medium enhances the expected integrated [C II] intensity originating from the clumpy medium and ELDWIM by a factor of 1.26 compared to the first approach.
Except for the NE peak and the total galaxy both approaches result in large fractions of the [C II] emission attributed to ELDWIM reaching 100% for the nucleus. However, by assuming a beam filling factor of unity and the low density limit these values are upper limits.
Another approach to estimate the [C II] emission from ELDWIM is to compare the integrated [C II] intensity with integrated [N II] intensity. The [N II] emission comes entirely from ionized medium and the critical densities of the [N II] emission lines are similar to the critical density of the [C II]. Treating the N+ ion as a pure three level system and assuming an abundance ratio for (C+)/(N+) it is possible to estimate the contribution of the ELDWIM to the [C II] emission from [N II] measurements. In the low density limit the expected ratio of the integrated [C II] intensity to the integrated [N II] 122m intensity from ELDWIM is
| (1) | |||||
where and are the emission coefficients for spontaneous emission of the [C II] line and the 122 m [N II] line, respectively (Nussbaumer & Storey 1981, Nussbaumer & Rusca 1979), the ’s are the collision rate coefficients derived from the effective collision strengths given by Lennon & Burke (1994), and and are the critical densities for collisions with electrons at a temperature of K for the [C II] line and the 122 m [N II] line, respectively. The contribution of the ELDWIM to the observed [C II] emission is then given by . For the comparison it is preferable to have the [N II] and [C II] intensities obtained with the same instrument. Using our ISO [N II] 122 m and ISO [C II] data (Nikola et al. 2002) we obtain a contribution of the ELDWIM to the observed ISO [C II] emission of for the NE peak, for the nucleus, and for the SW peak, where the intensities are in units of . These numbers are higher than the values derived above in our first two approaches. Note that the calibration of our ISO data is still uncertain. Therefore the individual ISO intensities should only be used with reservations. However, the ratio of the ISO intensities should not be affected by the calibration uncertainty. The relative statistical errors of the ISO [N II] intensities are at the NE- and SW-peak and at the nucleus, and the relative statistical errors of the ISO [C II] intensities are at the NE-peak, at the SW-peak, and at the nucleus.
From recent COBE FIRAS observation Petuchowski & Bennett (1993) estimated the morphology of the ionized medium in the Milky Way. They estimate that only a small fraction (17%) of the [N II] 122m emission actually arises from ELDWIM and that the majority (82%) of the [N II] emission comes from externally ionized cloud surfaces. These externally ionized cloud surfaces have higher densities ( cm-3) than the ELDWIM. If we assume the same conditions in M51 as in the Milky Way then the low density limit used in the above calculation might therefore not be appropriate. Assuming again a pure three level system for the N+ ion and a pure two level system for the C+ ion the expected intensity ratio of the 158 m line to the 122 m line in an ionized medium with a density of 150 cm-3 and a temperature of K decreases to . If we divide the [N II] emission into a part (17%) arising from ELDWIM and a part (82%) arising from more dense externally ionized cloud surfaces and using our ISO data we obtain a much lower contribution of the ELDWIM to the observed [C II] emission: 7.2% for the NE peak, 30% for the nucleus, and 16.8% for the SW peak. For reference Petuchowski & Bennett (1993) estimate that the ELDWIM in the Milky Way contributes about 53% to the [C II] emission. This fraction is higher than the fractions we derive using the estimated [N II] morphology from COBE for all our positions but similar or smaller than the fraction we estimated for the SW peak and the nucleus in the first three approaches. For the NE peak this contribution would be higher than the values derived above in all four approaches.
For the minimum ELDWIM contribution to the [C II] emission we listed the estimated integrated [C II] intensity derived from the COBE FIRAS [N II] 122 m morphology (Table 2). For the total galaxy M51 the only way to estimate the minimum value was by our first approach. All the maximum contribution from ELDWIM are higher than 100%, except for the NE peak. We got the maximum contribution to the [C II] emission at this position when we assumed that all the ISO [N II] emission arises from ELDWIM.
In the further analysis we will use the minimum [C II] contribution from the ELDWIM.
4.3 Photodissociation regions
Strong [C II] emission is commonly attributed largely to PDRs associated with molecular cloud surfaces. However, as shown in the previous section in the case of M51 components other than PDRs can account for a large fraction of the observed integrated [C II] intensity. But presently it is not possible to make firm statements about how much of the [C II] emission is really coming from other components of the interstellar medium other than PDRs. Therefore we will follow four ways in analyzing the [C II] emission from PDRs. First we assume that all the observed integrated [C II] intensity originates from PDRs (“case-1”). Then we subtract the minimum contribution of all non-PDR contributions from the observed integrated [C II] intensity (“case-2”). As a third case we subtract the standard contributions of the CNM and the WNM and the minium contribution of the ELDWIM from the observed [C II] intensity and attribute the remaining intensity to PDRs (“case-3”). For the last case we subtract the maximum contribution from CNM, WNM, and ELDWIM from the observed integrated intensity (“case-4”). In this case the NE peak is the only position where a PDR contribution to the [C II] emission is left over.
4.3.1 Determination of density, FUV intensity, and beam filling factor of PDRs
To determine the density, the far-UV (FUV) intensity and the beam filling factor of the PDRs we compare the integrated [C II] intensity with the integrated 12CO(10) intensity from Lord & Young (1990) and the intensity of the FIR continuum from Smith (1982) as corrected using IRAS data and relate this to PDR model predictions (Wolfire et al. 1989, Stacey et al. 1991). We determine these values for the three points of interest, the main [C II] peak, the NE peak, and the SW peak. In addition we determine the mean values for the entire galaxy M51. The values used in this estimate are given in Table 3.
| Main C II peak | NE peak | SW peak | Total M51a) | |
| b)c) | ||||
| d) | 112 | 40 | 20 | 23 |
| Observed | ||||
| b) | ||||
| / | 2000 | 5000 | 3300 | 1300 |
| Minimum Contribution from non-PDRs subtracted | ||||
| b) | ||||
| Standard Contribution from the CNM and the WNM | ||||
| and minimum of ELDWIM subtracted | ||||
| b) | ||||
| Maximum Contribution from non-PDRs subtracted | ||||
| b) | 0 | 0 | 0 | |
a) Averaged over the whole galaxy M51
( sr).
b) The integrated intensities are in units of
[erg s-1cm-2sr-1].
c) [erg s-1cm-2sr-1]
(from Lord & Young 1990)
d) From Smith (1982) (corrected to include flux m using
IRAS numbers);
in units of the local interstellar radiation field:
erg s-1cm-2sr-1 (Draine 1978)
Figure 6 shows the densities (solid lines) and the FUV intensities (dashed lines) as functions of and from PDR models (Wolfire, Hollenbach, & Tielens 1989, Stacey et al. 1991), where is the integrated FIR intensity expressed in units of the local Galactic interstellar radiation field erg s-1cm-2sr-1 (Draine 1978). Using the ratios and eliminate the contribution of the beam filling factor if it assumed that the [C II] and 12CO () line and FIR continuum emission are associated with the same PDRs. The solid lines connect PDR models with the same density while dashed lines connect PDR models with the same incident FUV intensity. At a density of about 104 cm-3 the ratio reaches a maximum. This results in a degeneracy of the PDR model solutions. If the (, ) point falls above the 102 cm-3 density curve then two different solutions (low and high density) exist for the density and the FUV intensity. The filled symbols represent “case-1” (all [C II] from PDRs), the star symbol represent “case-2” (minimum contribution of [C II] emission of non-PDRs subtracted) and the open symbols represent “case-3” (standard contribution of [C II] emission of non-PDRs subtracted) for the individual positions. The gray bar shows the range of possible [C II] contributions originating in PDRs. If all the [C II] emission would arise from non-PDRs then the gray bar reaches . The (, ) positions of “case-1” for the NE peak and the SW peak are just at the edge of the range for a possible PDR solution but fall clearly within the range of a solution if the uncertainty of the [C II] measurement is taken into account.
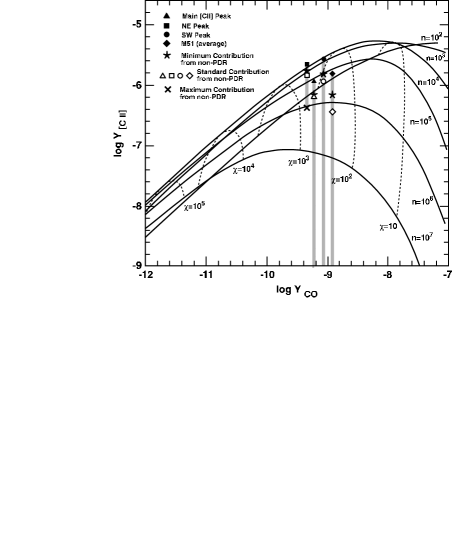
The PDR solutions for the main [C II] peak, the NE and SW peak, and the total galaxy that we derived from this plot are shown in Table 4. As can be seen from the PDR plot the FUV intensities for all the positions in M51 are modest. The beam filling factor which can be determined by the intensity ratio of the observed FIR radiation and the modeled FUV radiation (Wolfire, Hollenbach, & Tielens 1989, Stacey et al. 1991) is also shown in Table 4. The calculation of the beam filling factor assumes that about all the FUV radiation impinging on the PDR is converted into FIR continuum. We use this ratio instead of the ratio of the observed to the predicted [C II] intensity because of the uncertainty of the fraction of [C II] originating from PDRs. Also the change of the modeled FUV intensities is small for the different [C II] contributions from PDRs. For the area at the main [C II] peak we get a very high beam filling factor of nearly 100% for the low density PDR solution. In all other cases the beam filling factor is between 7% and 38%.
4.3.2 Mass and column density of the [C II] emitting regions
We estimate the column density and the mass of the [C II] emitting photodissociated gas using the results of the PDR model above. For the calculation we assume optically thin emission. The column density and mass is then given by:
where is the area in steradian, is the proton mass, is the mass of the sun, is the distance, is the Planck constant, is the vacuum speed of light, is the Einstein coefficient for spontaneous emission, is the abundance of ionized carbon, and are the statistical weights for the upper and lower level, is the ionization fraction, and is the mean critical density for collisions with atomic and molecular hydrogen. The density and the beam filling factors were taken from the PDR results (Table 4). In this calculation we assumed that all carbon is in singly ionized form and that the gas temperature is 200 K. For this gas temperature we assume a critical density for collisions with electrons of cm-3. This critical density is deduced from the collision strengths given by Blum & Pradhan (1992).
| Main C II peak | NE peak | SW peak | Total M51a) | |||||
| Density | Density | Density | Density | |||||
| Low | High | Low | High | Low | High | Low | High | |
| From observed values | ||||||||
| [cm-3] | 300 | — | 900 | 200 | ||||
| b) [] | 130 | 460 | — | 300 | 130 | 200 | 60 | 200 |
| c) | 0.86 | 0.24 | — | 0.13 | 0.15 | 0.10 | 0.38 | 0.12 |
| Minimum non-PDRs contribution subtracted | ||||||||
| [cm-3] | 750 | 270 | — | |||||
| b) [] | 100 | 520 | 350 | 420 | 100 | 300 | — | 250 |
| c) | 1.12 | 0.22 | 0.11 | 0.10 | 0.20 | 0.07 | — | 0.09 |
| Standard non-PDRs contribution subtracted | ||||||||
| [cm-3] | 700 | 140 | — | |||||
| b) [] | 100 | 530 | 200 | 500 | 80 | 300 | — | 250 |
| c) | 1.12 | 0.21 | 0.20 | 0.08 | 0.25 | 0.07 | — | 0.09 |
| Maximum non-PDRs contribution subtracted | ||||||||
| [cm-3] | — | — | — | — | — | — | — | |
| b) [] | — | — | — | 760 | — | — | — | — |
| c) | — | — | — | 0.05 | — | — | — | — |
a) Averaged over the whole galaxy M51
( sr).
b) In units of the local interstellar radiation field:
erg s-1cm-2sr-1 (Draine 1978)
c) Beam filling factor:
The results for the column density and the mass are presented in Table 5. For comparison, the molecular masses at NE and SW peak and at the nucleus within a FIFI beam and of the total galaxy M51 are also determined. The mass of the molecular gas was derived from the column density of the molecular hydrogen given in Lord & Young (1990). The mass of the [C II] emitting gas averaged over M51 and at the nucleus is between 2 – 34% of the molecular mass. At the NE and the SW peak the fraction of the mass of the [C II] emitting photodissociated gas is as high as 72%.
| Main C II Peak | NE Peak | SW Peak | Total M51a) | |||||
| b) [] | ||||||||
| Density | Density | Density | Density | |||||
| Low | High | Low | High | Low | High | Low | High | |
| From Observed Values | ||||||||
| [cm-2] | — | |||||||
| [] | — | |||||||
| Minimum non-PDR contribution subtracted | ||||||||
| [cm-2] | — | |||||||
| [] | — | |||||||
| Standard non-PDR contribution subtracted | ||||||||
| [cm-2] | — | |||||||
| [] | — | |||||||
| Maximum non-PDR contribution subtracted | ||||||||
| [cm-2] | — | — | — | — | — | — | — | |
| [] | — | — | — | — | — | — | — | |
a) Averaged over the whole galaxy M51
( sr).
b) The molecular mass was derived from the H2 column
densities given in Lord & Young (1990).
5 Discussion
5.1 Starbursts at the NE and SW Peaks
The [C II]/12CO(10) line intensity ratio is an indicator of OB star formation activity in dusty galaxies (Stacey et al. 1991). A ratio of 4400 is typically found in starburst nuclei, while a value near 1200 is more typical of quiesent spiral galaxies. In the north-east of M51, near the NE peak, we obtain the highest [C II] to CO integrated intensity ratios in M51 (5000; for “case-1”) similar to starburst nuclei. From their data Lord & Young (1990) also derived the highest star formation efficiency in the north-east region close to the NE peak. The moderate integrated intensity ratio at the nucleus () indicates moderate star formation activity. Although the peak of the [C II] emission is located at the center of M51 there is also a large amount of CO in this region resulting in the moderate intensity ratio. In addition the nucleus of M51 is most likely an AGN (Ford et al. 1985; Makishima et al. 1990; Kohno et al. 1996; Grillmair et al. 1997) and not a starburst region. The integrated intensity ratio in the south-west of M51 () is smaller than at the NE peak. Although we can not give a firm value for the fraction of [C II] emission from PDRs in M51 at the NE peak at least 50% or more of the integrated [C II] intensity originates most likely from PDRs. This result and the high [C II]/CO(10) intensity ratio suggest that the most active star forming region in M51 lies in the north-east region, probably near the NE peak. The maximum of the [C II] to CO integrated intensity ratio, however, is next to the NE peak between the spiral arms. This is likely the result of interpolation in the CO map. No CO data were obtained by Lord & Young (1990) at the exact location of the NE peak. The low [C II]/CO(10) intensity ratios at the nucleus and the SW peak may be the effect of beam dilution. If the ISM in these regions consists of only a few but highly active star forming knots within an extended, less active region the [C II]/CO(10) intensity ratio averaged over the FIFI beam would be low. Such a morphology of the ISM is suggested e.g. for NGC 4038/39 (Nikola et al. 1998).
The finding of enhanced star formation activity in the north-east and probably also in the south-west is also supported by the distribution of the H emission (van der Hulst et al. 1988), the FUV emission (Bersier et al. 1994), and the 12CO(21) emission (García-Burillo, Guélin, & Cernicharo 1993), the FIR continuum (Smith 1982), and the thermal radio continuum at cm (Klein, Wielebinski, & Beck 1984). All the distributions show emission which either peaks in the north-east and south-west or only peaks in the north-east but is elongated in north-east south-west direction. However, this distribution is most pronounced in the [C II] emission with a main focus towards the north-east region.
Additional support for the enhanced star formation activity and the special location of the activity comes from analysis of the kinematics and dynamics of M51. Tully (1974 c) concluded in his analysis that the density-wave pattern in M51 is confined between the inner Lindblad resonance and corotation and that the spiral arms outside corotation can be accounted for by material clumping induced by the galaxy interaction. Corotation occurs at a radius of about 5.8 kpc (Tully 1974 c; converted to a distance of M51 of 9.6 Mpc). Both the NE peak and the SW peak lie at about the same distance from the center of M51 as corotation. Thus they are located at the transition zone of the density-wave pattern and the spiral arms which are attributed to material clumping. Especially the SW peak coincides with a position of extreme clumping (Tully 1974 c; position “n” in Figure 10 therein). This is also the position where the orbits of all the test particles which were originally at or beyond 6.7 kpc pass through (Toomre & Toomre 1972). Material clumping can also be seen at the position of the NE peak. The encounter model of Toomre & Toomre (1972) shows crowding of test particles along the outer spiral arm which starts at the NE peak where the density-wave arm terminates and follows on to north and west to the southern tidal tail. This spiral arm can be attributed to material clumping (Tully 1974 c). The relatively weak [C II] emission that we observe in the north-west region might originate from this clumped material. The coincidence of the location of the NE and SW peak with the region where most or all trajectories of the test particles pass through and where the density wave arms terminate might indicate that the enhanced [C II] emission is caused by an enhanced mass flow crossing the spiral arms. This could result in a high rate of cloud-cloud collisions which then trigger star formation. The position of the NE and SW peak at these special locations where the tidal tials emerge from the disk in the simulations of Toomre & Toomre (1972) also indicates that the star formation there is triggered by the galaxy interaction. The trajectories of test particles crossing the spiral arms shown by Toomre & Toomre (1972) are almost concentrated in a single spot in the south-west in contrast to the north-east where the crossing area is more spread out. This would result in a beam dilution effect at the SW peak, resulting in a smaller [C II]/CO(10) intensity ratio.
5.2 Comparison with other Spiral Galaxies
Except for the NE and SW peak and the main peak in the center of M51 the [C II] emission is distributed very uniformly over the whole galaxy. There is no clear signature of the spiral structure visible in the [C II] emission. This could be due to a smoothing effect given our beam size or the presence of an underlying [C II] emission in M51 or both. However, [C II] observations with FIFI of NGC 6946 (Madden et al. 1993), which is at about the same distance as M51 but a little bit less extended, shows some spiral structure. Also the [C II] map of M83 taken with FIFI (Geis et al. in preparation), which has a similar extension as M51 reveals very clumpy [C II] emission following the spiral arms. This difference in the NGC 6949 and M83 maps and the M51 map supports the presence of an underlying extended [C II] emission in M51. We have shown in the previous sections that the CNM and the ELDWIM can in principle contribute a large fraction to the [C II] emission. The ELDWIM is most likely the main contributer to an underlying [C II] emission in most of M51. But in the north-west region of M51 the CNM is most likely the main source of the [C II] emission. How much the ELDWIM contributes to the [C II] emission in M51 remains unclear. Even with the use of the [N II] 122m line it was not possible to present a firm statement about the real contribution of the [C II] emission from ionized gas. Mapping of M51 in the [C II] and both [N II] lines with high spatial resolution might help to disentangle the contributions from the various ionized gas phases and to distinguish between an on-arm, inter-arm, and underlying [C II] emission. High spatial resolution would also be required to find out if the PDRs lie on a separate spiral arm (maybe between the ionized arm and the molecular arm or coinciding with the molecular arm) and to distiguish between [C II] emission from a possible PDR arm and emission from neutral gas in the H I arm.
The PDRs at the NE and SW peak might be located in molecular superclouds of masses within the giant molecular association with masses of observed by Vogel, Kulkarni, & Scoville (1988) and Rand & Kulkarni (1990) in these regions. This is supported by the low FUV intensity of which we estimated from the PDR models. Such low FUV intensities are normally expected in PDRs in giant molecular clouds () (Stacey et al. 1991, 1993) and might therefore also be the case in PDRs in molecular superclouds.
In the nucleus the high density PDR solution is supported by the detection of the HCN molecule in the center of M51 and in the inner spiral arms (Nguyen et al. 1992; Kuno et al. 1995; Kohno et al. 1996). This finding suggests that the density of the molecular gas in these clouds is cm-3. No observations of this density tracer are available in the outer parts of M51 and therefore no statement can be made about which PDR solution is more likely.
6 Summary
We obtained a map of M51 in the [C II] fine structure line at 158 m with a spatial resolution of (FWHM). The [C II] emission arises from the whole visible extent of M51. The main peak of the [C II] emission is located at the center of M51 and has an integrated intensity of erg s-1cm-2sr-1. In addition we found a [C II] peak in the north-east and in the south-west of M51. The NE peak is stronger than the SW peak and has an integrated [C II] intensity of 70% of the integrated intensity of the main peak. The NE peak and the SW peak lie roughly on a straight line going through the center of M51 and they have the same distance to the center as corotation of the density wave pattern. Both peaks are located at the position where the density wave pattern terminates and where the spiral structure is attributed to material clumping due to the interaction of M51 with NGC 5195. The [C II] emission in the NE peak originates mainly from PDRs. We also find that the strongest star formation activity occurs in the north-east of M51 close to the NE peak. We suspect that this enhanced star formation activity is triggered by cloud-cloud collisions due to a high mass flow crossing the spiral arms. There might also be high star formation activity in the south-west triggered by the same effect but which is hidden to our observation due to beam dilution.
From the PDR model we derive two possible solutions for the individual positions we investigated in M51. The estimated FUV intensity is similar for both solutions with an intensity of a few 100 times the local Galactic interstellar radiation field. For the density we obtain very different solutions with cm-3 for the low density solution and cm-3 for the high density solution. At the center of M51 the high density solution is supported by the detection of HCN in this region. The PDRs in the NE and SW peak are most likely associated with the molecular superclouds and giant molecular associations found in these regions. This is supported by the relatively low FUV intensity derived from the PDR model. The total mass of the [C II] emitting photodissociated regions in M51 is . This is only a small fraction (2%) of the total molecular mass. If all [C II] arises in PDRs that fraction can be as high as 34%. In the nucleus the fraction of the [C II] emitting photodissociated gas ranges between 3% and 19% and at the NE and SW peak the mass of the [C II] emitting gas can be as high as 72%.
A large fraction of the overall [C II] emission in M51 can originate in an underlying extended medium. It remains unclear how much the ELDWIM contributes to this emission, but it could be the main source. The CNM can also be a significant source of [C II] emission. Especially at the north-west part of M51 where most of the [C II] emission might originate from CNM. At the NE and SW peak a smaller fraction of the [C II] emission might emerge from CNM.
References
- (1)
- (2) Bersier, B., Blecha, A., Golay, M., & Martinet, L. 1994, A&A, 286, 37
- (3)
- (4) Blum, R.D., & Pradhan, A.K. 1992, ApJS, 80, 425
- (5)
- (6) Crawford, M.K., Genzel, R., Townes, C.H., & Watson, D.M. 1985, ApJ, 291, 755
- (7)
- (8) Draine, B.T. 1978, ApJS, 36, 595
- (9)
- (10) Ford, H.C., Crane, P.C., Jacoby, G.H., Lawrie, D.G., & van der Hulst, J.M. 1985, ApJ, 293, 132
- (11)
- (12) García-Burillo, S., Guélin, M, & Cernicharo, J. 1993, A&A, 274, 123
- (13)
- (14) Geis, N. et al. in preparation
- (15)
- (16) Greenawalt, B., Walterbos, R.A.M., Thilker, D., & Hooper, C.G. 1998, ApJ, 506, 135
- (17)
- (18) Grillmair, C.J., Faber, S.M., Lauer, T.R., Hester, J.J., Lynds, C.R., & O’Neil, E.J. 1997, AJ, 113, 225
- (19)
- (20) Hildebrand, R.H., Loewenstein, R.F., Harper, D.A., Orton, G.S., Keene, J., & Whitcomb, S.E. 1985, ICARUS, 64, 64
- (21)
- (22) Kennicutt, R.C., 1998, in: Saas-Fee-Advanced Course 1996, “Galaxies: Interactions and Induced Star Formation”, ed. D. Friedli, L. Martinet, D. Pfenninger (Berlin: Springer Verlag), p.22
- (23)
- (24) Klein, U., Wielebinski, R., & Beck, R. 1984, A&A, 135, 213
- (25)
- (26) Kohno, K., Kawabe, R., Tosaki, T., & Okumura, S.K. 1996, ApJ, 461L, 29
- (27)
- (28) Kulkarni, S., & Heiles, C. 1987, in: “Interstellar Processes”, ed. D.J. Hollenbach & H.A. Thronson (Dordrecht:Reidel), 87
- (29)
- (30) Kulkarni, S., & Heiles, C. 1988, in: “Galactic and Extragalactic Radio Astronomy”, ed. G. Verschuur & K. Kellerman (Berlin: Springer), 95
- (31)
- (32) Kuno, N., Nakai, N., Handa, T., & Sofue, Y. 1995, PASJ, 47, 745
- (33)
- (34) Launay, J.M. & Roueff, E. 1977, J.Phys. B, 10, 879
- (35)
- (36) Lennon, D.J. & Burke, V.M. 1994, A&AS, 103, 273
- (37)
- (38) Lord, S.D., & Young, J.S. 1990, ApJ, 356, 135
- (39)
- (40) Madden, S.C., Geis, N., Genzel, R., Herrmann, F., Jackson, J.M., Poglitsch, A., Stacey, G.J., & Townes, C.H. 1993, ApJ, 407, 579
- (41)
- (42) Madden, S.C., Poglitsch, A., Geis, N., Stacey, G.J., & Townes, C.H. 1997, ApJ, 483, 200
- (43)
- (44) Makishima, K., Ohashi, T., Kondo, H., Palumbo, G.G.C., & Trinchieri, G. 1990, ApJ, 365, 159
- (45)
- (46) Monnet, G. 1971, A&A, 12, 379
- (47)
- (48) Nussbaumer, H. & Storey, P.J. 1981, A&A, 96, 91
- (49)
- (50) Nussbaumer, H. & Rusca, C. 1979, A&A, 72, 129
- (51)
- (52) Nguyen, Q-Rieu, Jackson, J.M., Henkel, C., Troung, B., & Mauersberger, R. 1992, ApJ, 399, 521
- (53)
- (54) Nikola, T., Genzel, R., Herrmann, F., Madden, S.C., Poglitsch, A., Geis, N., Townes, C.H., Stacey, G.J. 1998, ApJ, 504, 749
- (55)
- (56) Nikola, T. et al. 2002, in preparation
- (57)
- (58) Petuchowski, S.J. & Bennett, C.L. 1993, ApJ, 405, 591
- (59)
- (60) Poglitsch, A., Beeman, J.W., Geis, N., Genzel, R., Haggerty, M., Haller, E.E., Jackson, J., Rumitz, M., Stacey, G.J., & Townes, C.H. 1991, Int. J. Infrared Millimeter Waves, 12, 895
- (61)
- (62) Rand, R.J., & Kulkarni, S.R. 1990, ApJ, 349, L43
- (63)
- (64) Rice, W., Lonsdale, C.J., Soifer, B.T., Neugebauer, G., Kopan, E.L., Lloyd, L.A., de Jong, T., & Habing, H.J. 1988, ApJS, 68, 91
- (65)
- (66) Rickard, L.J., & Palmer, P. 1981, A&A, 102, L13
- (67)
- (68) Rots, A.H., Bosma, A., van der Hulst, J.M., Athanassoula, E., & Crane, P.C. 1990, AJ, 100, 387
- (69)
- (70) Sandage, A., & Tammann, G.A. 1975, ApJ, 196, 313
- (71)
- (72) Scoville, N., & Young, J.S. 1983, ApJ, 265, 148
- (73)
- (74) Skilling, J., Bryan, R.K. 1984, MNRAS, 211, 111
- (75)
- (76) Smith, J. 1982, ApJ, 261, 463
- (77)
- (78) Spitzer, L. 1978, ” Physical Processes in the Interstellar Medium”, New York: Wiley & Sons
- (79)
- (80) Stacey, G.J., Geis, N., Genzel, R., Lugten, J.B., Poglitsch, A., Sternberg, A., & Townes, C.H. 1991, ApJ, 373, 423
- (81)
- (82) Stacey, G.J., Beeman, J.W., Haller, E.E., Geis, N., Poglitsch, A., & Rumitz, M. 1992, Int. J. Infrared Millimeter Waves, 13, 1689
- (83)
- (84) Stacey, G.J., Jaffe, D.T., Geis, N., Genzel, R., Harris, A.I., Poglitsch, A., Stutzki, J., Townes, C.H. 1993, ApJ, 404. 219
- (85)
- (86) Stacey, G.J. 2001, privat communication
- (87)
- (88) Tilanus, R.P.J., & Allen, R.J. 1991, A&A, 244, 8
- (89)
- (90) Toomre, A., & Toomre, J. 1972, ApJ, 178, 623
- (91)
- (92) Tully, R.B. 1974 , ApJS, 27, 415, a
- (93)
- (94) Tully, R.B. 1974, ApJS, 27, 437, b
- (95)
- (96) Tully, R.B. 1974, ApJS, 27, 449, c
- (97)
- (98) van der Hulst, J.M., Kennicutt, R.C., Crane, P.C., & Rots, A.H. 1988, A&A, 195, 38
- (99)
- (100) Vogel, S.N., Kulkarni, S.R., & Scoville, N.Z. 1988, Nature, 334, 402
- (101)
- (102) Weliachew, L., & Gottesman, S.T. 1973, A&A, 24, 59
- (103)
- (104) Wolfire, M.G., Hollenbach, D., & Tielens, A.G.G.M. 1989, ApJ, 344, 770
- (105)
- (106) Wright, E.L. 1976, ApJ, 210, 250
- (107)
- (108) Wright, E.L., & Odenwald, S. 1980, BAAS, 12, 456
- (109)