The mass donor of Scorpius X-1 revealed
Abstract
We present the first detection of the mass donor star in the prototype X-ray binary Scorpius X-1. Phase resolved spectroscopy revealed narrow emission lines components from the irradiated secondary star. Radial velocity fits to the Bowen blend emission are used to establish an absolute orbital ephemeris and derive an accurate value for the systemic velocity; km s-1. Emission from the irradiated front side of the secondary leads to solid limits to the radial velocity of the mass donor of km s-1. In conjunction with an upper limit to the velocity of the primary km s-1, we derive a firm limit on the mass ratio of Sco X-1 of . A likely set of system parameters satisfying the various constraints as well as the recent inclination estimate by Fomalont et al. (2001) is km s-1, km s-1, corresponding to component masses of , for an orbital inclination of .
1 Introduction
Scorpius X-1 is the prototype low-mass X-ray binary (LMXB), consisting of a neutron star accreting matter from a Roche lobe filling companion star. It is the brightest persistent X-ray source in the sky and has been the target of detailed analysis for the last 35 years in all energy bands, from radio to X-rays. An orbital period of 18.9 hr was reported by Gottlieb, Wright & Liller (1975) from brightness eye estimates on 1068 plates during the interval 1890-1974. The optical B-band light curve shows a 0.13 mag amplitude modulation (Augusteijn et al. 1998) which is being interpreted as the visibility of the X-ray heated companion. Radial velocity curves of HeII 4686 and HI confirmed the orbital period and indicated that the inferior conjunction of the emission line regions are close to the photometric minimum and, hence, they must originate near the compact object (e.g. LaSala & Thorstensen 1985). Bradshaw et al. (1999) measured the trigonometric parallax of Sco X-1 using VLBA radio observations and deduce a distance of kpc. Intensive radio observations were also used to measure the properties of the twin radio lobes around the source which are inclined at an angle of relative to the line of sight (Fomalont et al. 2001). Despite intensive efforts, spectroscopic signatures of the companion star have not yet been observed in optical-IR data (e.g. Schachter, Filippenko & Kahn 1989; Bandyopadhyay et al. 1997,1999). Here we present high resolution spectroscopy of Sco X-1 which enable us to detect the companion star for the first time.
2 Observations and reduction
The phase resolved spectroscopy of Scorpius X-1 was obtained with the 4.2m William Hershel Telescope on La Palma in combination with the ISIS double beam spectrograph. The R1200B grating centred at 4601Å delivered a wavelength coverage of 4150-5050Å at 0.45Å/pixel on the 2048x4096 pixel EEV CCD detector. A 1.2” slit width resulted in a spectral resolution of 0.84Å, corresponding to 55 km s-1 at our central wavelength. The data were part of a campaign to look for circular polarisation from accreting binaries, and to this end a quarter-wave plate and a Savart calcite slab were placed in the optical path (see Tinbergen & Rutten (1992) for more details). The slit position angle was adjusted to remain close to parallactic throughout the observations. A total of 137 spectra were obtained in the course of three consecutive nights covering 75% of the 18.9 hour orbital cycle. A journal of observations can be found in Table 1.
The insertion of the calcite slab in the light path results in the projection of two target beams on the detector. The intensity ratio then represents the fraction of circular polarisation. For the analysis presented in this Letter, we ignored the polarisation characteristics of the light, and combined the extracted spectra from both beams. Frames were first de-biased using a median bias frame obtained by combining 10-15 individual bias exposures. The overscan strip was then used to subtract any residual bias from each frame. A median of 29 Tungsten exposures was constructed at each night in order to perform flat field correction. Each beam was then optimally extracted. Some frames were affected by transient CCD pickup noise producing variable bias structure at the level of 3-5 ADU. For those frames affected (around 8 on the second night and 10 on the third night), we introduced an additional reduction step before optimal extraction that subtracted the pickup noise using a 2nd order polynomial fit to each CCD row. Regular CuAr arclamp exposures allowed us to establish an accurate wavelength scale for each spectrum. Finally, a wide slit exposure of the flux standard BD28+4211 (Oke 1990) was used to perform flux calibration using the MOLLY data analysis package. The two extracted spectra for each frame were then added to produce the final set of 137 calibrated Sco X-1 spectra.
3 Analysis
3.1 The emission line spectrum
The optical spectrum of Sco X-1 is dominated by strong and broad emission lines from the Balmer series as well as HeI/HeII. However, closer inspection revealed a large number of weaker and very narrow emission line features that showed significant Doppler motions as a function of orbital phase. In particular, the strong Bowen blend near 4640Å was resolved into an underlying broad component as well as several narrow components from the individual Bowen transitions. Broad and highly variable emission around 4640Å was already noted by Sandage et al. (1966) in the paper discussing the identification of the optical counterpart of Sco X-1. A more detailed investigation of the same data by Westphal, Sandage & Kristian (1968) did also indicate complex and strongly time dependent fine structure in the broad emission structures and some preliminary evidence for velocity changes in the strong Balmer and HeII lines. More recently, Bowen emission in Sco X-1 was noted by Willis et al. (1980) while Schachter, Filippenko & Kahn (1989) discuss the Bowen fluorescence process in Sco X-1 in detail. However, neither had the spectral resolution to resolve the individual components. We will see in the next sections that these narrow emission features can be attributed to the irradiated companion star, thus revealing a direct signature from the mass donor in Sco X-1 for the first time. In Figure 1 we present the average normalised spectrum of Sco X-1 in the rest frame of the companion star to facilitate the identification of the narrow features. Most lines were identified using the planetary nebulae emission line lists from Kaler (1976) as well as the Kurucz atomic line list. Many narrow lines from OII are present as well as a few SiIII, CII and NIII transitions.
3.2 Bowen emission from the donor
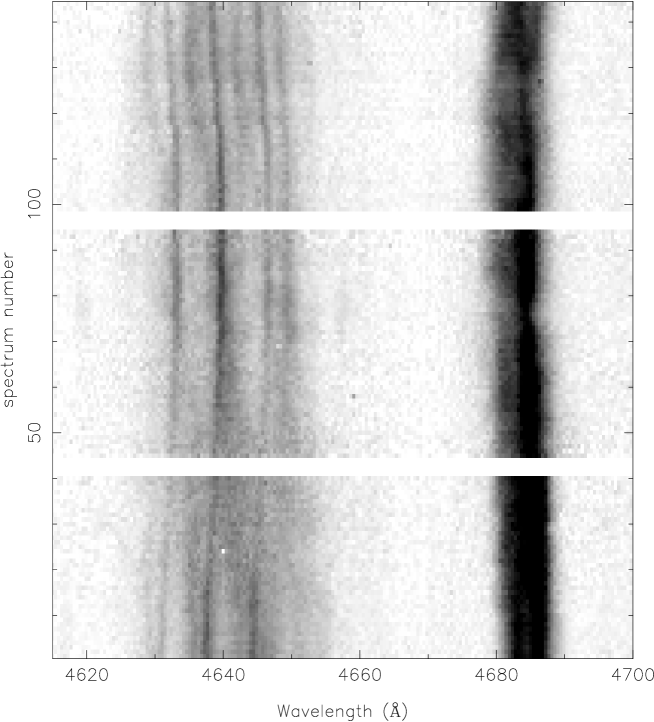
In order to establish the origin of the narrow emission line components, we measured the velocity of the narrow Bowen components as a function of phase. As can be seen in Figure 1, the strongest Bowen components are the two NIII components at 4634.13Å and 4640.64Å, and the CIII components at 4647.4/4650.1Å. In Figure 2, we display the Bowen blend and HeII4686 emission in the form of a trailed spectrogram. All the individual spectra were first normalised to the continuum using a 3rd order polynomial fit. The two NIII components as well as the CIII component at 4647Å clearly move in phase with each other, and are extremely narrow. In the background more diffuse emission can be seen to move roughly in anti-phase with these sharp components. For comparison, the broad and weakly double peaked HeII line shows completely different line kinematics.
The velocities of the various components were measured using multiple Gaussian fits to the individual spectra. At first we fitted the Bowen profiles using 3 narrow Gaussians corresponding to the 3 strongest Bowen components as well as an underlying broad component. The FWHM of the Gaussians were determined from a fit to the average Bowen blend profile and fixed to 80 km s-1 for the narrow components and 1550 km s-1 for the broad component. The position and strength for each Gaussian was a free parameter for each individual spectrum. The derived radial velocities of the sharp components were identical within the error bars. We thus decided to reduce the number of free parameters in our fits and give the three narrow Gaussians a common radial velocity, but an independent strength. The 6 parameters were optimised for each observed spectrum through least square fitting to determine the common velocity of the three narrow components and its associated formal error.
Figure 3 plots the derived radial velocity curve of the Bowen components together with a least squares sinusoidal fit. The best fit gives a velocity amplitude of km s-1 with a mean velocity of km s-1. Given the extreme narrowness of the components, they cannot originate from the accretion flow or hot-spot that is expected to be responsible for the broad emission line components. Such narrow emission components are, however, regularly seen in the line profiles of cataclysmic variables where they originate from the irradiated front side of the companion star (e.g. Harlaftis et al. 1999, Schwope et al. 2000). This has also been observed in the intermediate mass X-ray binary Her X-1 (Still et al. 1997), where narrow Bowen blend components from the mass donor are present. An origin on the mass donor is furthermore supported by the fact that the crossing of the emission components from blue shift to red shift occurs near minimum light, and that the strength of the emission is weakest then, since we are looking at the unirradiated backside of the secondary. The inferred systemic velocity of km s-1 furthermore agrees well with previous estimates using the strong emission lines (e.g. Lasala & Thorstensen 1985). We thus have established a radial velocity curve of the mass donor in Sco X-1 for the first time. The radial velocity curve directly gives us an unbiased value for the systemic velocity of the binary and establishes the correct absolute orbital phases. From the sinusoidal fit we established the following orbital ephemeris which we will use throughout this paper;
where we took the value for the orbital period as derived by Gottlieb, Wright & Liller (1975). Using our ephemeris, the phase of minimum light as established by Gottlieb, Wright & Liller corresponds to an absolute phase of , where we have allowed for the uncertainties in both and . This confirms that the photometric modulation is indeed related to the X-ray heated hemisphere of the donor star. values based on the inferior conjunction of the HeII 4686 emission, on the other hand, are delayed by (Cowley & Crampton 1975) and (LaSala & Thorstensen 1985), indicating that the emission line regions trail the compact object. We will revisit these emission line velocities in Section 3.3.
Since we have detected narrow lines from the mass donor in emission rather than absorption, they must originate from the front half of the Roche lobe. The derived radial velocity amplitude is thus biased towards lower values depending on the detailed distribution of the line emission over the Roche lobe surface. This in analogy with the bias towards larger velocities when using absorption lines that are predominantly formed near the backside of the Roche lobe (e.g. Wade & Horne 1988). The fact that the radial velocity curve is not strictly sinusoidal also suggests that the emission is not distributed uniformly. However, allowing for an ellipticity in the fit does not significantly improve the of the fit. We can thus constrain the true velocity of the centre of mass of the mass donor () to be km s-1. Without any knowledge of the mass ratio and the extent of disc shadowing effects in Sco X-1, it is very difficult to quantify the K-correction that needs to be applied to the Bowen blend velocities in order to define the true . A more detailed modelling of the phase dependence of the emission from the mass donor, both in terms of velocity as well as strength is required, which will be discussed in a future paper.
3.3 The radial velocity of the primary
Direct inspection of the trailed spectra (Figure 2) clearly shows that the HeII 4686 line is anti-phased with the CIII/NIII narrow emissions and, therefore, it must come from near the compact object. Significant phase shifts between the line core and centroid have been reported, due to possible contamination by complex variable hot-spots (e.g. Cowley & Crampton 1975). Therefore, we have followed the double-Gaussian technique to estimate the velocity semi-amplitude of the compact object from the line wings (see Schneider & Young 1980 for details). We employed a two Gaussian band-pass with FWHM=100 km s-1 and Gaussian separations km s-1 in steps of 100 km s-1. Radial velocity curves of different line sections yield consistent results with velocity semi amplitudes in the range 50-56 km s-1 and blue-to-red crossing phases 0.64-0.60. Phase delays of relative to the expected motion of the compact object, are typically observed in cataclysmic variables (CVs), probably due to residual hot-spot contamination. We have also attempted to extrapolate the velocity points towards phase 0.5 using the light-centre technique (see Marsh 1988 for details) but the method fails given the very small derived phase drift as we move from the line core into the wings. Applying the same technique to the H line produces similar values for the line core, however the phase offset increases dramatically in the line wings. We therefore choose to use the HeII lines as our basis for an estimation of . The bottom panel of Figure 3 presents the radial velocity curve of HeII 4686 for km s-1, before velocity points start to be corrupted by continuum noise. A formal sine-wave fit provides km s-1 which we take as an upper limit to the true .
3.4 Doppler mapping
Many of the narrow lines that can be identified in Figure 1, move in phase with the secondary star and thus are also the result of reprocessed emission from the irradiated front side of the Roche lobe. Unfortunately, due to weakness of the lines, a Gaussian fit to each spectrum is not possible. Instead, we use Doppler tomography (Marsh & Horne 1988) to measure the radial velocity amplitudes of the many weak narrow emission lines that are present. By mapping the observed data onto a velocity coordinate frame, Doppler mapping makes use of all data at once, and can thus be used for features that are too weak to be separated in each individual spectrum. One effectively resolves the distribution of line emission in the corotating frame of the binary system, providing an excellent tool for identifying the origin and kinematics of the various emission components. It also allows us to map the emission line distribution from the broad HeI,HeII and Balmer lines. Secondary star emission is readily identified in Doppler tomograms since the solid body rotation of the Roche lobe is mapped to a corresponding Roche lobe area along the positive axis. We employed a maximum entropy implementation of Doppler tomography whereby the data is fitted under the added constraint of maximising the entropy, i.e. image smoothness of the tomogram (Marsh & Horne 1988). This reduces the presence of noise artifacts in the recovered tomograms and allows a simultaneous fit to a number of heavily blended lines.
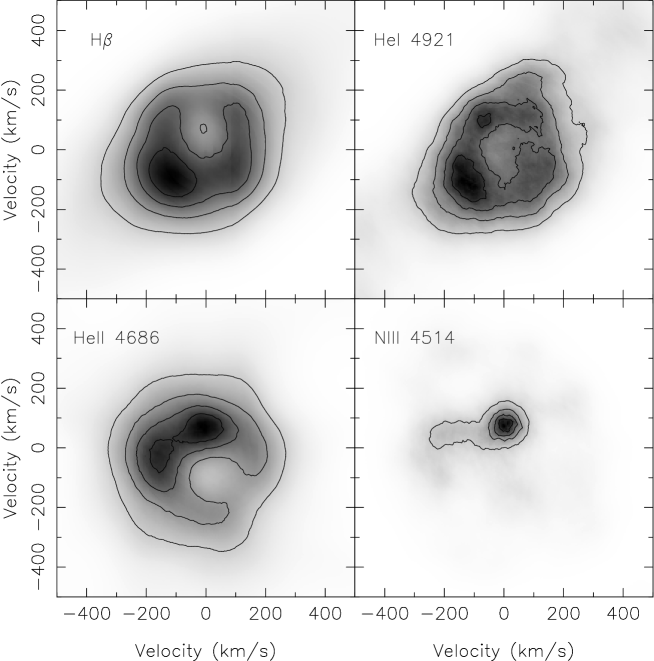
To check that the method of measuring the velocity of the narrow emission lines using tomography is consistent with the method of employing (multiple) Gaussian fits, we started by producing tomograms for the Bowen blend components. The Bowen blend data was fitted simultaneously with three Doppler images corresponding to the rest wavelengths of the three strongest Bowen emission components. The tomograms revealed the secondary star emission as a sharp spot along the axis, and a 2D Gaussian fit was used to accurately measure the position of the spot. This lead to inferred velocities of , and km s-1 respectively, confirming that this method can be used to extract reliable radial velocities. We then repeated the same procedure for a range of other weak emission lines present in the spectrum of Sco X-1. The inferred velocities for emission from the mass donor spanned from 66 km s-1 for SiIII at 4568Å, 78 km s-1 for OII doublet at 4415Å to 87 km s-1 for NIII at 4379Å. An example tomogram showing secondary star emission from the NIII line at 4514Å is plotted in Figure 4. The fitted velocity based on this tomogram gives 79 km s-1. Unfortunately, the width of the narrow components are of the order of our instrumental resolution and so are not well resolved. However, since only the front half of the Roche lobe can contribute to the line emission, we can confidently increase our lower limit to km s-1. This technique in conjunction with higher spectral resolution data could be used to map the emission on the Roche lobe as a function of ionisation potential such as done in for example Harlaftis (1999), and provide even more stringent constraints to the true value of .
In Figure 4 we also present Doppler tomograms of the strong and broad H, HeII4686 and HeI4921 lines for comparison. Clearly their line dynamics are radically different and are dominated by contributions from the accretion disc around the primary. However, significant asymmetries are present in all lines, leading to localised hot-spots in the tomograms. In the case of HeII at 4686Å, we can identify a clear emission contribution from the secondary star, whereas the Balmer and HeI lines do not show a secondary star emission component. If anything, the H tomogram indicates a depression of line flux at the location of the mass donor. The tomograms directly illustrate that the use of emission line velocities as a measure of the radial velocity amplitude of the compact object is severely affected and distorted by asymmetries in the line profiles. Indeed, our analysis in Section 3.3 revealed significant phase offsets between the phasing of the secondary star components and the broad emission lines. The different phase offsets that exist between the velocities of the H line a versus HeII are due to the fact that the HeII is mainly distorted by emission from the mass donor, whereas the H line is distorted by a spot in the lower left quadrant of the Doppler image. The fact that our data reveals the same phase shifts as found by Lasala & Thorstensen (1985), suggest this asymmetry is a persistent feature in Sco X-1.
The complex morphology of the Doppler tomograms complicates the reliable estimation of . If the emitting gas was symmetrically distributed around the primary, the Doppler image would reveal a circular distribution centred on . In order to estimate the true centre of the emission line distribution, we subtracted the symmetrical component from the H Doppler maps and inspected the residuals. We cycled the assumed centre of symmetry between -100 and +25 km s-1 in steps of 2 km s-1 and measured the mean of the residuals at high velocities in the upper right quadrant which is not affected by the spot. The mean residuals show a pronounced minimum around an assumed centre of symmetry of km s-1. This suggests that the true value of is indeed closer to 40 km s-1 for Sco X-1.
4 Discussion
We have presented the first direct detection of the mass donor in Sco X-1 by resolving emission components originating from the irradiated front side of its Roche lobe. Radial velocity fits were used to establish an absolute orbital ephemeris and measure the systemic velocity to high accuracy; km s-1. A lower limit to the radial velocity of the mass donor is given by the radial velocity amplitude of the sharp Bowen blend emission components which leads to km s-1. Detection of secondary star emission at even higher velocities in other transitions lead to a more stringent lower limit of km s-1. The strong broad emission line show orbital motions roughly in anti-phase with the secondary star. We confirm significant phase shifts between the radial velocity curves of the strong lines and the absolute ephemeris. Doppler tomography reveals that these phase shifts are due to persistent asymmetries in the emission line distribution around the compact object. The formal double Gaussian method leads to a firm upper limit to the primary radial velocity amplitude of km s-1. A more reliable value is derived by searching for the optimal centre of symmetry in the accretion disc emission which leads to an estimated value of km s-1. Our absolute ephemeris confirms previous suggestions that the phase of optical minimum light corresponds closely to orbital phase zero, when the contribution from the heated mass donor is smallest.
The combination of our upper limit to and at the same time a lower limit to leads to a firm limit to the mass ratio of when using the formal values of and as derived from the Gaussian fits. Using the more restrictive values , , we derive a limit of . Another constraint is given by the fact that the observed emission originates from the front half of the Roche lobe and its velocity thus lies in between that of the true value and the velocity of the L1 point (). Since we observe emission at velocities as low as 66 km s-1, we can thus derive an upper limit on for a given mass ratio in order to make sure that the velocity of L1 is not greater than 66 km s-1. In Figure 5 we plot the various limits on as a function of mass ratio. As can be seen in the plot, the combination of and leads to km s-1 regardless of the mass ratio. This upper limit proves interesting from the point of view of the recent inclination estimate based on the active radio lobes of Sco X-1 (Fomalont et al. 2001). If the orientation of the radio lobes corresponds to the rotation axis of the orbital plane, we can estimate the component masses using Kepler’s law. With a typical neutron star mass of , this inclination () predicts relatively high values across the allowed mass ratio range (Figure 5). This suggests that a slightly lower orbital inclination seems more likely unless the neutron star is atypical and significantly less massive than the Chandresekhar limit. However, given the uncertainty on the inclination, all constraints are still compatible with a 1.4 neutron star within 1. A likely set of parameters for Sco X-1 given the various constraints could be km s-1, km s-1, corresponding to component masses of , for an orbital inclination of . Given the orbital period of Sco X-1, the companion star must then be a significantly evolved subgiant having a radius of more than twice of the corresponding main sequence radius of . Its mean density is solely determined by the orbital period which gives g cm-3 compared to g cm-3 for a main sequence star. We note that these parameters are also consistent with Sco X-1 being a persistent X-ray binary, with an approximate mass transfer rate of using the prescription from King, Kolb & Burberi (1996). This is enough to maintain the irradiated-disc hotter than 6500 K everywhere avoiding global instabilities and thus outbursts.
Bandyopadhyay et al. (1997,1999) fail to detect any features from the companion star in their IR spectra of Sco X-1 at two epochs. Most notably, the CO band-head near 2.2 that is present in late type stars is absent. However, the appearance of the donor star will be affected by irradiation and both epochs were taken near orbital phase 0.5 (using our derived ephemeris) when these effects would be particulary severe. In addition, the use of the CO-bands for spectral type classification can be misleading because their strength is strongly dependent on effective temperature and, furthermore, the C,O abundances can be significantly non-solar for companion stars in interactive binaries (e.g. Howell 2001). In order to derive more accurate system parameters, we need to be able to model the K-correction, and use higher spectral resolution data to resolve the emission across the Roche lobe for a range of transitions using the methods described in this paper. Detecting the companion star in absorption should be possible around true orbital phase zero when the effects of X-ray heating are minimal.
References
- (1) Augusteijn, T. et al. 1992, A&A, 265, 177
- (2) Bandyopadhyay, R.M., Shahbaz, T., Charles, P.A., Naylor, T., 1999, MNRAS, 306, 417
- (3) Bandyopadhyay, R.M., Shahbaz, T., Charles, P. A., van Kerkwijk, M. H., Naylor, T., 1997, MNRAS, 285, 718
- (4) Bradshaw, C.F., Fomalont, E.B., Geldzahler, B.J., 1999, ApJ, 512, L121
- (5) Cowley, A.P, Crampton, D., 1975, ApJ, 201, L65
- (6) Fomalont, E.B., Geldzahler, B.J. Bradshaw, C.F., 2001, ApJ, in press
- (7) Gottlieb, E.W., Wright, E.L., Liller, W., 1975, ApJ, 195, L33
- (8) Harlaftis, E.T. 1999, A&A, 346, 73
- (9) Harlaftis, E. T., Steeghs, D., Horne, K., Martin, E. & Magazzu, A. 1999, MNRAS, 306, 348
- (10) Howell, S., 2001, PASJ, in press (astro-ph/0106214)
- (11) Kaler, J.B., 1976, ApJSS, 31,517
- (12) King, A. R, Kolb, U., Burderi, L., 1996, ApJ, 464, L127
- (13) LaSala, J., Thorstensen, J.R., 1985, AJ, 90, 207
- (14) Marsh, T.R., Horne, K., 1988, MNRAS, 235, 269
- (15) Marsh, T.R. 1988, MNRAS, 231, 1117
- (16) Oke, J.B. 1990, AJ, 99, 1621
- (17) Sandage, A.R. et al. 1966, ApJ, 146, 316
- (18) Schachter, J., Filippenko, A.V., Kahn, S.M., 1989, ApJ, 340, 1049
- (19) Schneider, D.P., Young, P., 1980, ApJ, 238, 946
- (20) Schwope, A.D., Catalan, M.S., Beuermann, K., Metzner, A., Smith, R.C. & Steeghs, D. 2000, MNRAS, 313, 533
- (21) Still, M.D., Quaintrell, H., Roche, P. D. & Reynolds, A. P. 1997, MNRAS, 292, 52
- (22) Tinbergen, J. & Rutten, R. 1992, La Palma ING User Manual 21, Isaac Newton Group, La Palma
- (23) Wade, R.A. & Horne, K. 1988, ApJ, 324, 411
- (24) Westphal, J.A., Sandage, A. & Kristian, J. 1968, ApJ, 154, 139
- (25) Willis, A.J. et al. 1980, ApJ, 237, 596
| Date | UT interval | Number of spectra | Exposure time | Orbital phase interval |
|---|---|---|---|---|
| 28/6/1999 | 21:55 – 02:10 | 40 | 300s | 0.81-1.03 |
| 29/6/1999 | 20:55 – 02:15 | 51 | 300s | 0.03-0.31 |
| 30/6/1999 | 20:56 – 01:55 | 46 | 300s | 0.30-0.56 |