The IR counterpart of the black-hole candidate 4U 163047††thanks: Based on observations collected at the European Southern Observatory, Chile.
We present band photometry of the region including the radio error box of the soft X-ray transient 4U 163047 during its 1998 outburst. We detect a variable source at =16.1 mag located inside the radio error circle which we identify as the counterpart to the X-ray source. We discuss the properties of the source, and conclude that it is most likely a black-hole X-ray binary similar to 4U 1543$-$47, GRO J1655$-$40 or SAX J1819.3$-$2525, containing a relatively early-type secondary.
Key Words.:
Accretion, accretion disks – Stars: individual: 4U 163047 – X-rays: stars1 Introduction
Despite the regular outburst behavior (600–690 days, e.g., Jones et al. jones76 (1976); Kuulkers et al. 1997b ) of the soft X-ray transient (SXT) 4U 1630$-$47, little is known about this source. Its X-ray spectral (Parmar et al. parmar86 (1986); Barret et al. barret96 (1996); Oosterbroek et al. tim98 (1998)) and X-ray timing (Kuulkers et al. 1997a ; Sunyaev & Revnivtsev sunyaev00 (2000)) properties during outburst suggest it harbors a black-hole (see also Dieters et al. stefan00 (2000); Tomsick & Kaaret tomsick00 (2000); Trudolyobov et al. trudo01 (2001)).
Optical/infra-red identification of 4U 163047 has been hampered due to the high extinction and the crowded field near its X-ray position (Reid et al. reid80 (1980); Parmar et al. parmar86 (1986)). A more precise location became available when the source was discovered in the radio during its 1998 outburst (Hjellming & Kuulkers hjell98 (1998); Buxton et al. buxton98 (1998); see also Hjellming et al. hjell99 (1999)): (J2000) RA = , Dec = (VLA) or RA = , Dec = (ATCA). This position lies well within the Einstein HRI error region (Parmar et al. parmar97 (1997)).
A first attempt to localize the infrared counterpart during the 1996 outburst was recently presented by Callanan et al. (callan00 (2000), henceforth CMG). We here report on a search for the infrared counterpart during its 1998 outburst.
2 Observations and reduction
We observed 4U 163047 with the infrared spectrograph and imaging camera SOFI on the 3.5-m NTT at the European Southern Observatory, La Silla, Chile on 4 separate occasions during the course of the 1998 outburst. A log of the observations is presented in Table 1.
All observations were made with a Rockwell HgCdTe 10241024 Hawaii array using the “small field” objective, which provides a 247247 field, with a pixel size of 0144. The filter used during the observations is slightly different from both the and filters defined by Wainscoat & Cowie (wain92 (1992)). The long wavelength edge of the is similar to that of the filter, but the short wavelength edge is similar to that of the filter. Thus, the filter avoids both the atmospheric absorption feature at 1.9 m and the radiation from the thermal background beyond 2.3 m (Lidman & Cuby lidman98 (1998)).
To accurately determine the sky brightness across the field the observations in each night consisted of 20 slightly-dithered frames with an exposure time of 30 seconds each. These frames were flat-fielded and sky subtracted. The source is located in the Galactic plane, and crowding is the main limitation to reaching faint magnitudes. We therefore selected in each case the best quality images and co-registered these to form a master frame for each night, producing a total on-target integration time of between 270 and 330 seconds. The seeing in the resulting frames as derived from the point-spread-function (PSF) determined for each observation (see Sect. 4.2) is listed in Table 1.
| Date (UT) | Tmid(JD2450000) | Texp(sec) | seeing(″) |
|---|---|---|---|
| 12/03/1998 | 885.90196 | 300 | 1.00 |
| 14/03/1998 | 887.90360 | 270 | 0.59 |
| 18/03/1998 | 889.90981 | 330 | 0.51 |
| 16/05/1998 | 950.83178 | 300 | 0.75 |

3 X-ray outburst light curve
In Fig. 1 we give the observed 1.5–12 keV fluxes (i.e. not corrected for absorption) during the 1998 outburst of 4U 163047 (January 11 to June 15, 1998). The RXTE/ASM data points were derived by dividing the observed daily averaged count rates by the total average Crab count rate during the same period (74.940.20 ASM cts s-1) and assuming that 1 Crab equals 2.97510-8 erg s-1 cm-2 (1.5–12 keV). The other data points were derived from the spectral fit parameters as given by Oosterbroek et al. (tim98 (1998): BeppoSAX/MECS+PDS, their Table 2), Tomsick & Kaaret (tomsick00 (2000): RXTE/PCA+HEXTE, their Table 5) and Trudolyubov et al. (trudo01 (2001): RXTE/PCA, their Table 2). We have normalized the derived fluxes from the observations of Oosterbroek et al. (tim98 (1998)) and Trudolyubov et al. (trudo01 (2001)) to those of Tomsick & Kaaret (tomsick00 (2000)) using observations done closest to each other in time (i.e. near JD 2450892 or March 19, 1998). This resulted in correction factors of 1.30 and 0.91 for the Oosterbroek et al. (tim98 (1998)) and Trudolyubov et al. (trudo01 (2001)) observations, respectively. In Fig. 1 we have also indicated the mid-times of the IR observations discussed below with arrows.
The outbursts in 4U 163047 occur fairly regularly. From its first detection in 1969 to the mid-1980’s the outbursts appeared to be periodic with a recurrence time of days. However, from the mid-1980’s to the 1998 outburst discussed here the recurrence time appeared to be longer, at about 690 days (Kuulkers et al. 1997b ; Kuulkers gnotor98b (1998)). The latest two outbursts, which reached maximum X-ray fluxes as derived from the RXTE/ASM data at approximately JD 245 1350 and 245 1885, respectively, indicate a different recurrence time again. A linear fit to all dates indicates an average recurrence time of days, with a root-mean-square (rms) spread of days. We believe that the observed variation in the outburst timings is in fact intrinsic to the mechanism causing the outbursts, and the recurrence time just reflects the typical time-scale. The next outburst is expected to occur somewhere in the second half of the year 2002.
4 Search for a Near-Infrared Counterpart
4.1 Astrometry
Astrometry was done relative to the USNO-A2.0 catalogue (Monet et al. monet98 (1998)). For all 35 USNO-A2.0 stars overlapping with the best-seeing image of March 18, 1998, centroids were determined. Five of these were extended and therefore rejected. With the remaining stars, the zero point position, the plate scale, and the position angle on the sky were determined. After rejection of four outliers, with positions deviant by more than 05, the rms residuals for the 26 remaining stars were 015 and 019 in right ascension and declination, respectively, consistent with the expected uncertainties on the USNO-A2.0 positions. Therefore, we expect that the tie to the system defined by USNO-A2.0 is good to about 004. The uncertainty in the tie to the International Celestial Reference Frame should thus be dominated by the systematic uncertainties in USNO-A2.0 itself, of about 02.
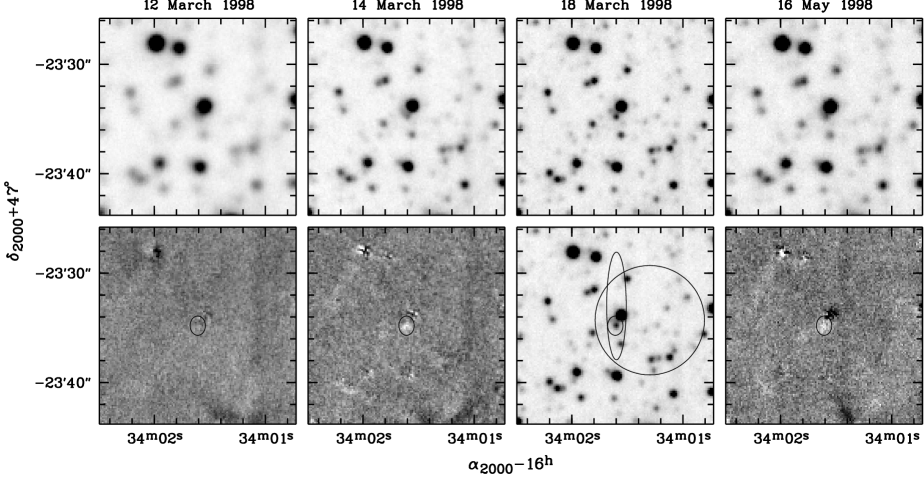
The other images were rebinned to an image matching in position and orientation with the 18 March, 1998 image, using some 40 secondary stars to determine the alignment. The aligned images are shown in the top row in Fig. 2. Also shown are the 95% confidence error circles derived using the ATCA, VLA and HRI positions (where for each position, the uncertainty we used includes the 02 uncertainty in the optical position added in quadrature). Clearly, several stars lie inside the smallest (ATCA) error circle.
4.2 Photometry
| No | 12/03/1998b | 14/03/1998b | 18/03/1998c | 16/05/1998b | ||||||
| (arcsec)a | ||||||||||
| 1 | –0.50 | 0.98 | 0.000 | 0.025 | –0.007 | 0.011 | 13.630 | 0.011 | –0.035 | 0.033 |
| 2 | 0.00 | 0.00 | 0.058 | 0.041 | 0.215 | 0.032 | 16.011 | 0.018 | 0.198 | 0.041 |
| 3 | –0.44 | –1.67 | 0.112 | 0.036 | 0.024 | 0.025 | 16.056 | 0.019 | 0.001 | 0.039 |
| 4 | 0.51 | 0.54 | 0.351 | 0.091 | –0.051 | 0.072 | 17.118 | 0.033 | 0.120 | 0.069 |
| 5 | –0.63 | –0.56 | 0.17 | 0.12 | 0.29 | 0.10 | 17.520 | 0.063 | 0.074 | 0.089 |
| 6 | 1.42 | –0.03 | –0.36 | 0.17 | 0.05 | 0.13 | 17.823 | 0.070 | –0.03 | 0.13 |
| 7 | –1.73 | 1.11 | .. | .. | 0.42 | 0.15 | 17.861 | 0.072 | –0.01 | 0.12 |
| 8 | 1.40 | 1.84 | –0.18 | 0.14 | 0.24 | 0.12 | 17.971 | 0.055 | 0.20 | 0.12 |
| 9 | –0.02 | 0.51 | –0.79 | 0.20 | –0.23 | 0.24 | 18.25 | 0.12 | –0.38 | 0.21 |
| 10 | –1.72 | –1.92 | 0.22 | 0.20 | 1.28 | 0.42 | 18.36 | 0.11 | 0.55 | 0.23 |
| 11 | 1.19 | –0.85 | –0.89 | 0.24 | –0.25 | 0.21 | 18.53 | 0.14 | –0.14 | 0.27 |
| 12 | 0.56 | –1.09 | .. | .. | .. | .. | 18.75 | 0.14 | 0.52 | 0.31 |
| 13 | 0.11 | 1.88 | .. | .. | .. | .. | 19.03 | 0.21 | .. | .. |
| 14 | –0.90 | –1.71 | .. | .. | .. | .. | 19.04 | 0.22 | .. | .. |
| 15 | 0.65 | 1.37 | .. | .. | .. | .. | 19.42 | 0.27 | 0.11 | 0.53 |
| a The positions are relative to star 2 as determined from the March 18, 1998 observations. | ||||||||||
| Star 2 is located at RA = , Dec = (J2000) | ||||||||||
| b Magnitudes relative to the March 18, 1998 observations. | ||||||||||
| c To compare these magnitudes with other observations, the error of 0.054 mag in the | ||||||||||
| photometric zeropoint should be added quadratically (see text) | ||||||||||
A region of 45″45″, approximately centered on the radio error circle, was extracted from the resulting frame for each night and analyzed with DAOPHOT (Stetson stetson87 (1987)) using a constant PSF. Photometric calibration was obtained through the observation of the NICMOS standard 9172 (= S279F; Persson et al. nicmos98 (1998)) which was observed close in time and in position on the sky to the March 14, 1998 observations. The photometric zeropoint of the data was determined by performing aperture photometry of the (relatively isolated) stars used to determine the PSF after having removed nearby stars using standard routines supplied in DAOPHOT. The resulting zeropoints showed a rms spread of 0.054 mag when averaged over the different PSF stars, and we take this value as the error in the zeropoint. The data in the other nights were calibrated by comparing the magnitudes of the PSF stars as derived by DAOPHOT in the different night with the data of March 14, 1998. The resulting relative zeropoints show an rms spread of 0.022 mag for the March 12, 1998 data, 0.011 mag for the March 18, 1998 data, and 0.022 mag for the May 16, 1998 data. These values determine the accuracy with which we can compare the data from the different nights.
4.3 Variability
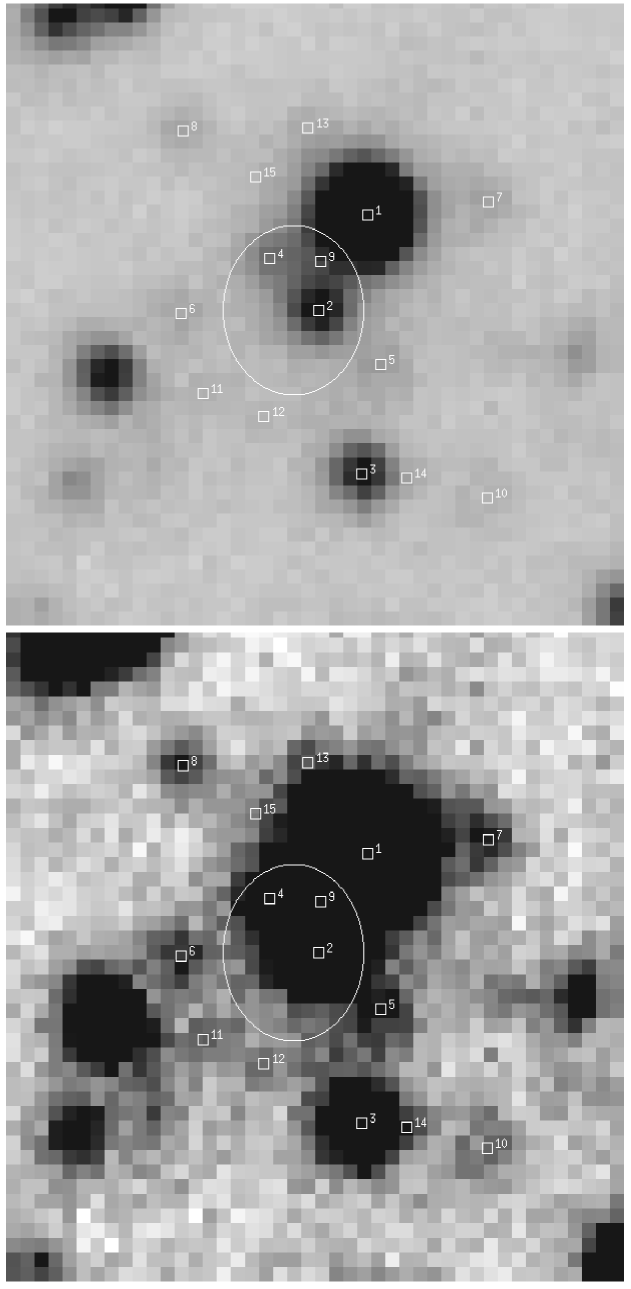
The main problem in comparing the data from different nights is that due to the varying seeing, objects which are identified as single objects can split in to various components, or individual sources can no longer be separated and are detected as one object. This is especially true for the field of 4U 163047 as it is located in the Galactic plane, and the field is very crowded. As the best seeing was obtained on March 18, 1998, we have used those data as a basis. In the region of the radio position there is a fairly tight cluster of stars, and, using DAOPHOT, we identify a total of 15 objects in, or close to, the radio error circle as shown in Fig. 3. The relative positions and magnitudes of these 15 stars are given in Table 2.
Using the position of star 1, which is the brightest of all the stars (see Table 2), as reference point the positions of the 15 stars were used to determine the magnitudes of the objects in the data from the other nights. It still could be that an object detected in the March 18, 1998 image in fact consists of more than one star, but in this way we assure that each time the brightness of the same star(s) is measured in the different nights. As the seeing during the other nights was significantly worse, not all 15 stars are detected in each observation. As one might expect mostly the fainter stars were not detected. To check our method we also derived the position and magnitude of the sources in the different nights leaving the positions free. In all cases half of all the sources were recovered, mostly the brighter objects. The remaining fits converged to nearby, relatively bright stars. The position and magnitudes of the objects that were recovered were all consistent with those derived using the fixed positions, giving us confidence that our method provides reliable results.
In Table 2 we give the relative magnitudes with respect to the March 18, 1998 observations of the sources that were detected in each night using fixed positions. The errors in the relative magnitudes refer to the formal errors derived by DAOPHOT added quadratically to the error in the relative zeropoints for each night (see Sect. 4.2). Looking at the last 3 nights, one can see that only star 2 is variable by more than 3-sigma, where the source is 0.215 mag fainter (6.7-sigma) on March 14, 1998 and 0.198 mag fainter (4.8-sigma) on May 16, 1998 with respect to the March 18, 1998 observations. In the March 12, 1998 observations there are various sources which have varied between 3- and 4-sigma with respect to the March 18, 1998 observations, but we believe this is due to the poor seeing of these observations which leads to some systematic variation in the measured brightness of the sources. However, we can conclude from the March 12, 1998 observations that star 2 is at a similar brightness level as during the March 18, 1998 observations.
There might be some concern about these results given the crowded nature of the field, and considering the slightly deviating results in the March 12, 1998 observations. To quantify the degree to which seeing contributes to systematic variations in the measurements we have degraded the data of March 18, 1998 to various degrees by convolving the original data with a 2-d Gaussian. This was done in such a way as to match the seeing of the other data sets. Subsequently, the convolved data were then subjected to the whole reduction process in the same way as the original data. The resulting magnitudes for the different stars in the experimental data follow fairly closely the results presented in Table 2, with the exception of star 2 which shows variations far smaller than the variations observed in the real data. The results for the simulated data are consistent with star 2 being constant, but in principle they are also consistent with a possible systematic shift in the results relative to the March 18, 1998 observations of up to 0.04 mag. If such systematic shifts exist in the analysis of the real data, the significance of the observed variations is somewhat lower. This analysis does confirm our belief that the relatively large deviations observed in the results from March 12, 1998 are due to the poor seeing of the data, and that the observed variations of star 2 are not just the result of variations in the seeing.
Furthermore, to get a perhaps clearer, or at least a different, measure of the variability in all images, we formed difference images with the best-seeing, March 18, 1998 image. For this purpose, we used the optimal image subtraction technique introduced by Alard & Lupton (alard98 (1998)). In this method, the image with better seeing is convolved with a kernel chosen such that the convolved point-spread function is as close as possible to that of the image with the worse seeing. The difference images found using the above method are shown in the lower panels of Fig. 2 (here, the difference is in the sense image minus convolved March 18, 1998 image). Although the subtraction is not perfect (especially for the brightest objects) there clearly is a residue close to the center of the ATCA error circle in the March 14, and May 16, 1998 images (see Fig. 2). The centroid of these residues coincide with the position of star 2, and the relative brightness variations in the different images are consistent with the photometric brightness variations derived above, which indicates that these results are not an artifact of the method used to analyze the data.
Given its variability and position, we conclude that star 2 is the IR counterpart to 4U 163047. From our astrometry we derive a position of RA = , Dec = (J2000) for this star.
5 Discussion
5.1 Previous observations
Previous IR imaging of the region 4U 163047 taken during the 1996 outburst, and in quiescence in 1995 and 1998 were presented by CMG. These observations were taken with a pixel scale of 065 per pixel and with a relatively poor seeing of 15 which makes the detection and measurement of fainter stars in this crowded field very difficult. In fact, CMG detect only 2 stars close to the ATCA error circle where we detected 15 sources in our best seeing image. These two stars correspond to stars 1 and 3 as shown in Fig. 3 and presented in Table 2. The magnitude of =13.650.05 derived by CMG for star 1 is fully consistent with our results, while the two measurements of =16.50.2 and 16.90.2 presented by CMG for star 3 are somewhat fainter than our results (see Table 2). A third star to the East of star 3 was also measured twice by CMG at =16.80.2 and 16.70.2 mag. For this star we derived a magnitude of 16.020.06, which is nearly the same as we measured for star 3 and brighter by a similar amount compared to CMG. As it seems unlikely that these two stars have changed in brightness by a similar amount, we believe that the measurements for these stars presented by CMG were affected by the poor resolution (both in seeing and pixel size) of their data, and that these sources are probably constant.
Of course, any measurement of star 1 will have included star 2 which we believe is the counterpart of 4U 163047. However, if this star would have been as bright as during our observations and have contributed all its flux to the measurement of star 1, it would only contribute 0.1 mag. As CMG used PSF fitting to derive their magnitudes, star 2 would only have effected the flank of star 1 on one side, and its contribution will likely have been a few 0.01 mag at most. It is, therefore, perfectly plausible that star 2 reached a similar brightness in during the 1996 outburst as during the 1998 outburst.
5.2 What kind of system is 4U 163047?
Although it is clear that the interstellar reddening towards 4U 163047 is high, the precise value is not certain. column densities as derived from spectral fits to X-ray data are in the range 5-151022 cm-2 (Parmar et al. parmar86 (1986), parmar97 (1997); Kuulkers et al. gnotor98a (1998); Tomsick et al. tomsick98 (1998); Oosterbroek et al. tim98 (1998); Cui et al. cui00 (2000); Dieters et al. stefan00 (2000); Tomsick & Kaaret tomsick00 (2000); Trudolyubov et al. trudo01 (2001)) which varies with the X-ray brightness of the system, and clearly includes a contribution from within the system. Deriving the column density from HI radio surveys (Kerr et al. kerr86 (1986)) yields a value of 21022 cm-2. However, at high optical depth the derived column densities are unreliable, and probably underestimate the true value (Dickey & Lockman dickey90 (1990)). Furthermore, this value does not include the possible contribution of molecular hydrogen. Considering this, we will assume a conservative range of 21022 cm-2 51022 cm-2 for the column density towards 4U 163047. Using the relation between and interstellar extinction (Predehl & Schmitt nhav95 (1995)), and a ratio (Rieke & Lebofsky akav85 (1985)) the observed column density corresponds to a band extinction of 1.3 3.1 mag.
Given its location on the sky and the high interstellar absorption, the source is most likely at the distance of the Galactic center or beyond, and following previous authors we will assume a distance of 10 kpc. It is interesting to note that the source lies in the direction of a giant molecular cloud (GMC: Corbel et al. corbel99 (1999)). This GMC is located at a distance of 11 kpc, and the column density of this cloud alone exceeds the value derived from X-rays, indicating that the source is most likely on the near side of this cloud. In any case, given the large uncertainty in the extinction, the precise distance to the source is not very important for the following discussion. For an average magnitude of = 16.1 for star 2 during our observations we derive –0.2 –2.0 mag.
The general X-ray properties of 4U 163047 suggest that the source is a (transient) low-mass X-ray binary (LMXB), and the optical/IR emission in outburst is likely dominated by the hot X-ray heated accretion disk (i.e., K over most of the disk surface; see Van Paradijs & McClintock jvpmcc95 (1995)). For Sco X-1, which is thought to be dominated by emission from its accretion disk (Hertz & Grindlay hertz84 (1984); Van Paradijs & McClintock jvpmcc94 (1994), henceforth VPM). However, in the case a system contains a late-type giant secondary it is expected to contribute significantly to the IR emission compared to the optical, and for GS 2023+338 in outburst we derive (Gehrz et al. gehrz89 (1989); VPM). Using these two values as extremes, we derive for the visual absolute magnitude of 4U 163047 in outburst 0.4 –2.3 mag.
The absolute visual magnitudes of LMXBs with known distances and orbital periods are well represented by the relation , where , and is the observed X-ray luminosity in units of the Eddington limit for a 1.4 M⊙ neutron star (VPM). The average X-ray flux at the time of the IR observations was erg cm-2 s-1 (see Fig. 1), which corresponds to erg s-1 at 10 kpc. The above relation then implies 11 hr 29 d. Assuming that the outbursts in SXTs are due to a disk instability and taking into account the effect of X-ray heating of the disk Van Paradijs (jvp96 (1996)) derived that for a system to show outbursts the X-ray luminosity must conform to the inequality . The average X-ray luminosity over the outburst cycles for the 1996 and 1998 outbursts (CMG; Oosterbroek et al. tim98 (1998)) corresponds to erg s-1 (at 10 kpc), and for 4U 163047 to be transient its orbital period must be 13 hr which agrees well with the above estimate.
Compared to other black-hole SXTs, the orbital period estimates best match those of 4U 154347, XTE J1550$-$564, GRO J165540, SAX J1819.32525 and GS 2023+338 (Orosz et al. orosz98 (1998), orosz01 (2001); Sánchez-Fernández et al. sanchez99 (1999); Jain et al. 2001b ; Shahbaz & Kuulkers shahbaz98 (1998), and references therein). Also the estimated absolute visual magnitude for 4U 163047 agrees well with that of 4U 154347 and SAX J1819.32525, though it is too bright compared to XTE J1550564, and a bit faint compared to GRO J165540 and especially GS 2023+338.
The main problem with the identification of the source as an LMXB is the small observed brightness variations. For an X-ray heated disk one expects the flux to vary as (Van Paradijs & McClintock jvpmcc95 (1995)). During our IR observations the X-ray flux varied by a factor 5 (see Fig. 1), which implies a variation of 1 mag in the brightness of the disk as compared to the small variation observed over the course of our observations. However, if the source is a long orbital period LMXB, the secondary is expected to contribute significantly to the brightness in the IR reducing the expected variation seen in the band. Furthermore, the outburst amplitude in the optical (and most likely the IR as well) of 4U 154347 and GRO J165540 are the smallest among SXTs (Orosz et al. orosz98 (1998); Shahbaz & Kuulkers shahbaz98 (1998)) and they varied only by 2-3 mag over the course of an entire outburst. By analogy one might expect that any variation in average brightness in the IR of 4U 163047 during an outburst is small.
The latter two sources (and also SAX J1819.32525) all contain rather early-type (late-B to mid-F) secondaries, and to a certain extent they are not true ‘low-mass’ X-ray binaries. However, the mass-transfer in these source is still thought to occur through Roche-lobe overflow and the optical emission (at least in outburst) is dominated by the (X-ray heated) accretion disk. In that sense, the above discussion concerning the orbital period of 4U 163047 is still valid.
The detection of a dip in the X-ray light curve during the 1996 outburst (Kuulkers et al. gnotor98a (1998)) indicates that the inclination of the system is fairly high (), similar to GRO J165540. In the latter system the orbital brightness variations have an amplitude of 0.3–0.5 mag (Van der Hooft et al. vdh97 (1997), vdh98 (1998)), which could also mask longer term average brightness variations if the source is observed on only a few occasions as is the case for our observations of 4U 163047. Another possibility is that there is an additional (varying) source of IR emission. In fact, the May 16, 1998 observations coincide with the soft-to-hard state transition observed in X-rays (Tomsick & Kaaret tomsick00 (2000)). In other systems in the low/hard X-ray state there is an excess radio emission component which probably extends to the IR (Fender et al. fenderetal01 (2001); Fender fender01 (2001) and references therein), and most likely originates from a compact jet. Especially interesting in that respect are the observations of XTE J1550564 during outburst (Jain et al. 2001a ). The transition from the soft to the hard state itself has also been associated with the ejection of relativistic plasma (Corbel et al. corbel00 (2000); Corbel et al. corbel01 (2001); Brocksopp et al. brock01 (2001)).
We conclude that our observations are consistent with 4U 163047 being a system with a relatively long orbital period, and that it is most likely similar to 4U 154347, GRO J165540 or SAX J1819.32525 containing a relatively early type secondary.
Not only do the general properties of 4U 163047 suggest that it is a LMXB type system, also GRO J165540 and GRS 1915+105, which are the two sources that most closely resemble its X-ray behavior (e.g., Kuulkers et al. 1997a , 1997b ), are both LMXBs (Bailyn et al. bailyn95 (1995); Greiner greiner01 (2001)). However, we note that the range in absolute band magnitude derived for 4U 163047 also agrees with the source being a (intrinsically slightly reddened) B star (at 10 kpc), which one would expect if the source is a detached Be/X-ray binary. Furthermore, the observed variability is typical for what is observed for these binaries in the IR (Coe et al. coe97 (1997)), so on the basis of our photometry alone we can not exclude this possibility. Probably only IR spectroscopy will be able to settle this question definitely.
Acknowledgements.
We thank Chris Lidman for help with obtaining the observations. EK thanks John Tomsick for providing their XSPEC spectral fit results in numerical form. The RXTE/ASM data used in this paper was obtained from the public ASM database at MIT, which is supported by the ASM and RXTE instrument teams at MIT and Goddard Space Flight Center. We thank the referee John Tomsick for various useful comments.References
- (1) Alard, C., Lupton, R. 1998, ApJ, 503, 325
- (2) Bailyn, C. D., Orosz, J. A., Girard, et al. 1995, Nat 374, 701
- (3) Barret, D., McClintock, J.E., Grindlay, J.E. 1996, ApJ, 473, 963
- (4) Brocksopp, C., Jonker, P.G., Fender, R.P., et al. 2001, MNRAS 323, 517
- (5) Buxton, M., Sood, R., Rayner, D., et al. 1998, IAU Circ. 682
- (6) Callanan, P.J., McCarthy, J.F., Garcia, M.R. 2000, A&A, 355, 1049 (CMG)
- (7) Coe, M. J., Buckley, D. A. H., Fabregat, et al. 1997, A&AS, 126, 237
- (8) Corbel, S., Chapus, C., Dame, T.M., Durouchoux, P. 1999, ApJ 526, L29
- (9) Corbel, S., Fender, R.P, Tzioumis, A.K, et al. 2000, A&A 359, 251
- (10) Corbel, S., Kaaret, P., Jain, R.K, et al. 2001, ApJ, in press [astro-ph/0102114]
- (11) Cui, W., Chen, W., Zhang, S. N. 2000, ApJ, 529, 952
- (12) Dickey, J.M., Lockman, F.J. 1990, ARA&A, 29, 215
- (13) Dieters, S. W., Belloni, T., Kuulkers, E., et al. 2000, ApJ, 538, 307
- (14) Fender, R.P. 2001, MNRAS 322, 31
- (15) Fender, R.P., Hjellming, R.M., Tilanus, R.P.J. et al. 2001, MNRAS 322, L23
- (16) Gehrz, R.D., Johnson, J., Harrison, T. 1989, IAU Circ. 4816
- (17) Greiner, J., McCaughrean, M.J., Cuby, J.-G., Castro-Tirado, A.J., Mennickent, R.E. 2001, Proc. of 3rd Microquasar workshop, ed. A.J. Castro-Tirado, J. Greiner, & J.M. Paredes, Astrophys. Space Sci. Rev, in press [astro-ph/0012074]
- (18) Hertz, P., Grindlay, J. E. 1984, ApJ, 282, 118
- (19) Hjellming, R.M., Kuulkers, E. 1998, IAU Circ. 6827
- (20) Hjellming, R. M., Rupen, M. P., Mioduszewski, A. J., et al. 1999, ApJ, 514, 383
- (21) Jain, R.K, Bailyn, C.D., Orosz, J.A., McClintock, J.E., Remillard, R.A. 2001, ApJ Lett., in press [astro-ph/0105115]
- (22) Jain, R.K, Bailyn, C.D., Orosz, J.A., et al. 2001, ApJ 546, 1086
- (23) Jones, C. Forman, W., Tananbaum, H., Turner, M.J.L. 1976, ApJ, 210, L9
- (24) Kerr, F. J., Bowers, P. F., Kerr, M., Jackson, P. D. 1986, A&AS, 66, 373
- (25) Kuulkers, E., 1998, NewAR 42, 613
- (26) Kuulkers, E., van der Klis, M., Parmar, A.N. 1997a, ApJ, 474, L47
- (27) Kuulkers, E., Parmar, A.N., Kitamoto, S., Cominsky, L.R., Sood, R.K. 1997b, MNRAS, 291, 81
- (28) Kuulkers, E., Wijnands, R., Belloni, et al. 1998, ApJ, 494, 753
- (29) Lidman, C., Cuby, J.-G. 1998, SOFI User’s Manual, Doc. No. LSO-MAN-ESO-40100-0003, Issue 1.0
- (30) Monet, D., et al. 1998, The PMM USNO-A2.0 Catalog, US Naval Observatory
- (31) Oosterbroek, T., Parmar, A.N., Kuulkers, E., et al. 1998, A&A, 340, 431
- (32) Orosz, J. A., Jain, R. K., Bailyn, C. D., McClintock, J. E., Remillard, R. A. 1998, ApJ, 499, 375
- (33) Orosz, J. A., Kuulkers, E., van der Klis, M., et al. 2001, ApJ, in press [astro-ph/0103045]
- (34) Parmar ,A.N., Williams, O.R., Kuulkers, E., Angelini, L., White, N.E. 1997, A&A, 319, 855
- (35) Parmar, ,A.N., Stella, L., White, N.E. 1986, ApJ, 304, 664
- (36) Persson, S.E., Murphy, D. C., Krzeminski, W., Roth, M., Rieke, M. J 1998, AJ, 116, 2475
- (37) Predehl, P., Schmitt, J.H.M.M. 1995, A&A, 293, 889
- (38) Reid, C.A., Johnston, M.D., Bradt, et al. 1980, AJ 85, 1063
- (39) Sánchez-Fernández, C., Castro-Tirado, A.J., et al. 1999, A&A 348, L9
- (40) Sunyaev, R., Revnivtsev, M. 2000, A&A, 358, 617
- (41) Rieke, G.H., Lebowski, M.J. 1985, ApJ, 288, 618
- (42) Shahbaz, T., Kuulkers, E. 1998, MNRAS, 295, L1
- (43) Stetson, P.B. 1987, PASP, 99, 191
- (44) Tomsick, J.A., Lapshov, I., Kaaret, P. 1998, ApJ, 494, 747
- (45) Tomsick, J.A., Kaaret, P. 2000, ApJ, 537, 448
- (46) Trudolyubov, S.P., Borozdin, K.N., Priedhorsky, W.C. 2001, MNRAS 322, 309
- (47) Van der Hooft, F., Groot, P. J., Shahbaz, T., et al. 1997, MNRAS, 286, L43
- (48) Van der Hooft, F., Heemskerk, M. H. M., Alberts, F., Van Paradijs, J. 1998, A&A, 329 ,538
- (49) Van Paradijs, J. 1996, ApJ, 464, L139
- (50) Van Paradijs, J., McClintock, J.E. 1994, A&A, 290, 131 (VPM)
- (51) Van Paradijs, J., McClintock, J.E. 1995, X-ray Binaries, ed. W.H.G. Lewin, J. van Paradijs, & E.P.J. van den Heuvel, Cambridge University Press, p. 58
- (52) Wainscoat, R. J., Cowie, L. L. 1992, AJ, 103, 332