11email: areiners@hs.uni-hamburg.de 22institutetext: European Southern Observatory, Casilla 19001, Vitacura, Santiago 19, Chile
Detection of differential rotation in Cap with profile analysis††thanks: Based on observations collected at the European Southern Observatory, La Silla (65.L-0101)
We report detection of differential rotation on the F5 dwarf Cap using line profile analysis. The Fourier transform of both Fe i 5775 and Si i 5772 are used to obtain a projected rotational velocity of km s-1. Modelling of the Fourier transformed profiles shows that the combined effects of equatorial velocity, inclination and differential rotation dominate the line profile while limb darkening and turbulence velocities have only minor effects. Rigid rotation is shown to be inconsistent with the measured profiles. Modelling the line profiles analogous to solar differential rotation we find a differential rotation parameter of (%) comparable to the solar case. To our knowledge this is the first successful measurement of differential rotation through line profile analysis.
Key Words.:
Methods: data analysis – Stars: activity – Stars: individual: Cap – Stars: late-type – Stars: rotation1 Introduction
According to the standard paradigm of stellar activity differential rotation is a central ingredient for the magnetic dynamo presumed to underlie all activity phenomena. In a turbulent convection zone differential rotation is expected to be a central element of stellar activity. The interaction of rotation and convection naturally produces deviations from rigid rotation. One example for this effect is the Sun, whose equator rotates 20% faster than higher latitudes (e.g. Lang, 1992). Direct predictions of the dependence of differential rotation on rotational velocity and spectral type have been made (e.g. Belvedere et al., 1980; Kitchatinov & Rüdiger, 1999). Observations suggest a strong correlation between rotation and activity in late-type stars with many pieces of evidence summarized as “rotation-activity connection” (Hempelmann et al., 1995; Messina et al., 2001).
However, measurements of differential rotation among stars are either complicated or time-consuming or both. One method to determine differential rotation is to examine spectral line shapes. Subtle differences exist between the line profile of a rigidly rotating star and that of a differentially rotating star, because the underlying flow fields are different. Although significant differences between the two cases are predicted, all previous attempts to measure differential rotation through line profiles alone remained unsuccessful and yielded results consistent with rigid rotation (e.g. Gray, 1982; Dravins et al., 1990; Groot et al., 1996). At any rate, for a successful measurement one needs high spectral resolution and high signal to noise. With the Very Long Camera (VLC) of the Coudé Echelle Spectrograph (CES) at ESO’s 3.6m telescope an instrumental setup satisfying these requirements is available. In this letter we report the detection of differential rotation in the F5 dwarf Cap, to our knowledge the first successful measurement of differential rotation through line profiles.
2 Data
Cap (HD 197 692, F5 V, , km s-1; Uesugi et al., (1982)) is the fastest rotator in a set of solar-like stars in the solar neighbourhood we observed on October 13, 2000 at ESO’s 3.6m telescope (La Silla). The spectral resolution achieved with the CES / VLC setup was ( 1.28 km s-1). Three consecutive exposures of Cap of 270 s each covering the wavelength range between 5770 – 5810 Å were taken. The signal to noise ratio of the extracted spectrum is per pixel with proper flat fielding and removal of interference pattern (c.f. Kürster, 2001, Sect. 6).
We concentrate our analysis on Fourier transforms of well isolated lines (Fe i 5775 and Si i 5772), for which continuum placement because of line blending is not a problem even for large values. The signal to noise ratio of our data is high enough to show the crucial features in the Fourier transform already from a single line.
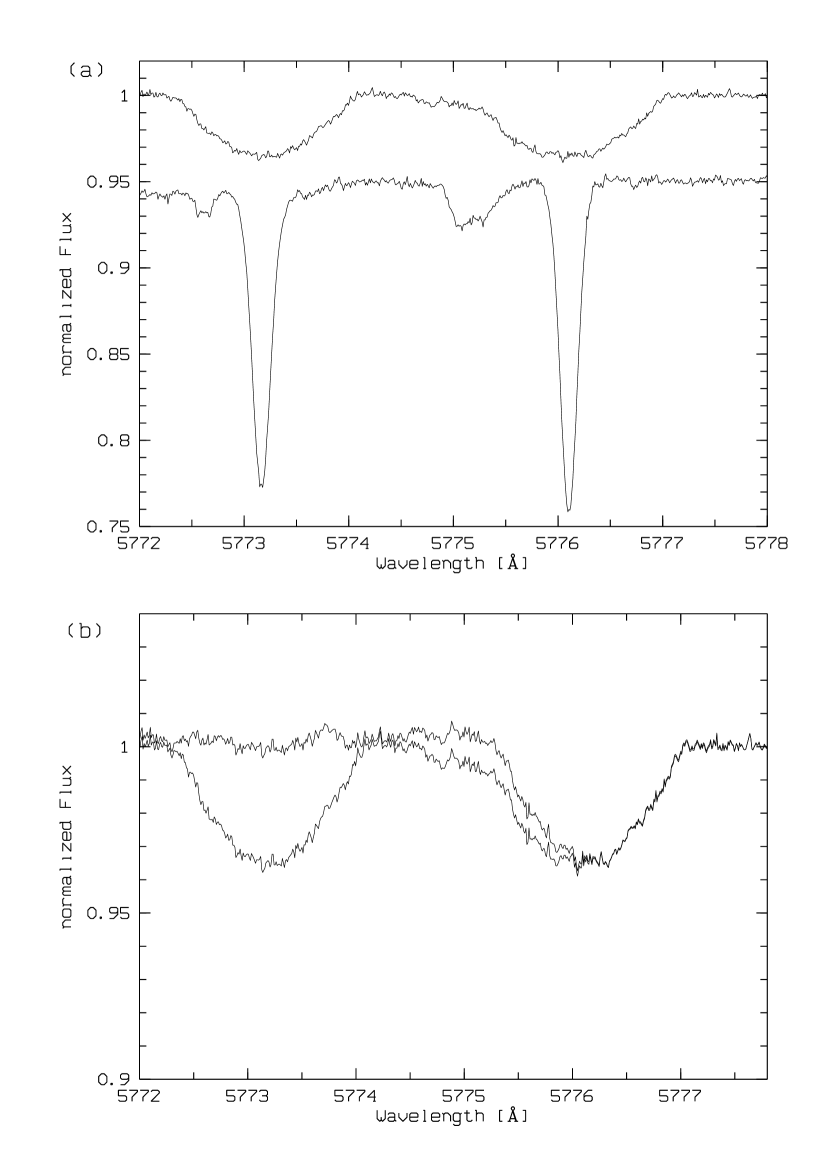
Still, in Fe i 5775 a small blend occurs from a neighbouring set of weak lines Å apart, the influence of which on differential rotation determination is not clear. During our observing run a spectrum of the slow rotator Psc (HD 222 368; F7 V) was taken. In Fig.1a both spectra are shown, with the profile of Psc shifted according to its relative radial velocity. Deblending of Fe i 5775 was accomplished by, first, removing the line in the spectrum of Psc “by hand”, broadening this template with km s-1 and subtracting it from the Cap spectrum. In Fig. 1b the recorded spectrum as well as the modified spectrum of Cap are shown. Obviously, the Si i5772 equivalent widths of Cap and Psc are the same, since it has been successfully removed (cf. Fig.1b). The Fe i 5775 line appears symmetric, thus we think that deblending was successful.
3 Method of Analysis
Absorption line profiles are influenced by a number of different effects. An absorption line profile at any point on the star is determined by temperature, gravity, element abundances and atomic parameters. This “intrinsic” profile is Doppler broadened by velocity fields. Many efforts have been undertaken to distinguish these velocity fields, one of them being the stellar rotation (see Gray, 1988, and references therein). In addition to the projected rotational velocity of the star, radial-tangential macro- and isotropic microturbulence (denoted with and resp.) turned out to be a reasonable parameterization of stellar atmospheric velocity fields. These parameterizations assume that Doppler broadenings can be treated as convolutions; and that the “intrinsic” profiles are identical over the apparent stellar disk. For fast rotators ( km s-1) and stationary atmospheres rotational broadening dominates and no complications occur with this assumption.
Interpreting the observed data profile as a a multiple convolution (denoted by ) between the intrinsic profile (including microturbulence broadening), the rotational broadening profile , the instrumental profile and the macroturbulence profile , can be written as
| (1) |
We calculated using the packages Atlas9 (Kurucz, 1979, 1993) and Bht (Baschek el al., 1966). Atomic damping coefficients obtained from VALD (Kupka et al., 1999; Kurucz, 1994) were included in the profile calculations; we chose solar metallicity and for the velocity dispersion of the opacity distribution function in Atlas9 we used 1.0 km s-1. The temperature has been set to K (Blackwell & Lynas-Gray, 1998). To calculate a modified version of a package developed and described by Townsend, (1997) is used. The surface integration is carried out over about 25 500 visible surface elements. The adopted limb-darkening law is given by
| (2) |
with denoting the angle between the surface element normal and the observer’s line of sight and the limb darkening coefficient. We parametrize the differential rotation law through
| (3) |
with being the latitude. Specifically, differential rotation is expressed in terms of . The differential rotation law (Eq. 3) is adopted from the solar case, where ; a more general approach would expand in terms of orthogonal polynomials. The instrumental profile has been determined from the shapes of calibration lamp lines, a correction for thermal broadening according to the lamp temperature of C was applied. The macroturbulence broadening function is adopted from Gray, (1992, p. 407).
The contributions of different velocity fields are difficult to separate especially in the wavelength domain. In the Fourier domain convolutions become multiplications which are much easier to handle; the advantages of Fourier domain are discussed in detail by Gray, (1992). In the Fourier domain Eq. 1 becomes
| (4) |
The Fourier frequency is expressed in cycles / (km s-1) = s km-1. Noise in Fourier domain can be expressed as (Gray, 1992), with being data noise and step size in the wavelength domain, N is the number of data points. The Fourier transform of a real, symmetric profile yields a real function in the Fourier domain. Investigations of imaginary transforms of asymmetric lines show that these are no reliable tracers of profile properties (Gray, 1980). We created a symmetric profile by mirroring the absorption profile at it’s center; the achieved Fourier transform turned out to be stable against small variations of the center position. Rotational broadening, which dominates the line broadening in the case of Cap, yields symmetric profiles. Asymmetries due to convection are believed to be of the order km s-1. In Fourier space this is s km-1 while our analysis focuses on s km-1. In the case of Fe i 5775 an asymmetry may occur due to imperfect deblending, for Si i 5772 no mechanism should contribute asymmetries of this order.
The Fourier transformed observed line profile was compared with a Fourier transformed model profile via a test. Within our adopted modelling approach the following six fit parameters determine the model profiles: rotational velocity (), inclination angle (), differential rotation (), limb darkening (), macro- () and microturbulence (). The -calculations have always been carried out directly on . No further corrections have been applied to the data to avoid complications with amplified noise. Bruning, (1984) pointed out that the convolution method induces systematic errors due to incorrectly estimated line depths especially in slow rotators. Our study is not focused on reproducing equivalent widths, which can be tuned e.g. by element abundances. The main goal is to reproduce the line shapes. Although we do not examine slow rotators in this study, normalized transformed profiles were used, that is, Fourier transformed profiles have been scaled to unity at .
4 Results and Discussion
After a rough determination of a grid calculation in the six fit parameters was carried out. As to our model parameterization we note that this description contains parameters whose physics is poorly understood, i.e., the micro- and macroturbulence. We thus use only as a relative parameter and not as an absolute criterion as to whether a model is acceptable or not; denotes the goodness of fit relative to the best fit, for which is set. For the actual grid we chose the parameter ranges of (0.4 – 0.8), (4.0 – 7.0) km s-1 and (1.0 – 2.5) km s-1. The rotation velocity was limited to km s-1 ().
Goodness of fit calculations have been carried out on Fe i 5775 and Si i 5772; both lines show identical results. In the following we show only the results for Fe i 5775.
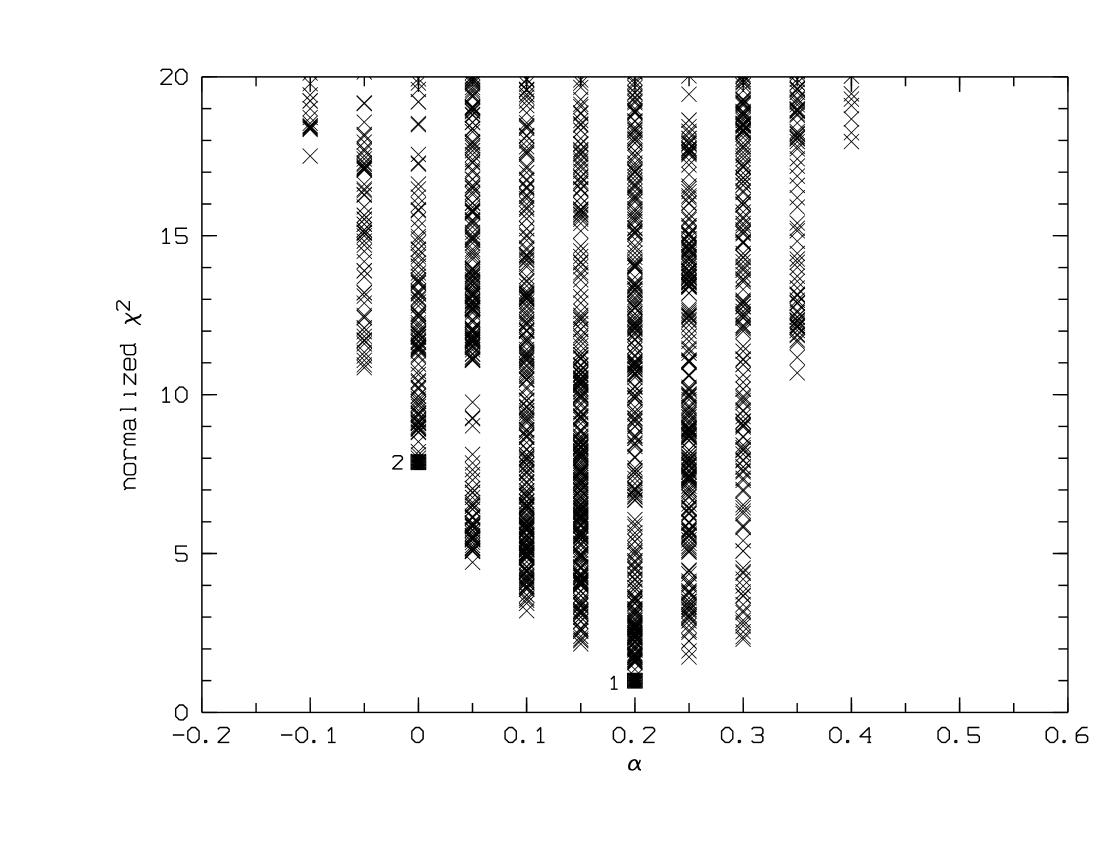
In Fig. 2 we plot the resulting as a function of the differential rotation parameter ; for each fixed value of , we plot the values obtained by varying all other model parameters. Clearly, a well defined lower envelope curve exists with a minimum at . The best fits for differential rotation (here ; , Model 1) and rigid rotation (, , Model 2) are marked by full squares; all parameters are shown in Tab. 1.
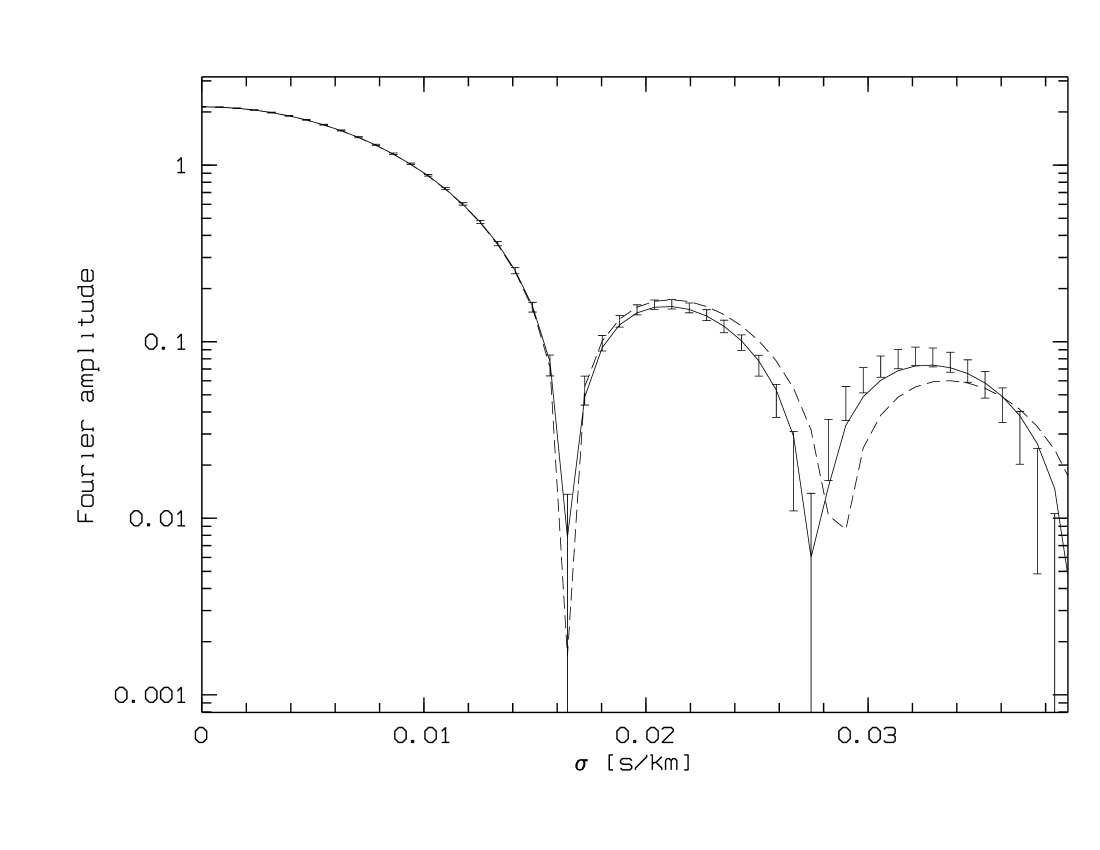
In Fig. 3 we plot the corresponding profiles in the Fourier domain; obviously, Model 1 provides a much better fit than Model 2, which is not an adequate description of our data. While no statistical uncertainties can be given on our -values, Fig. 3 shows -values of 7.9 to be clearly unacceptable.
Inspection of the calculated -grid shows that the parameters and produce only second order effects; the fits are driven by the chosen values of , and , and we cannot determine all model parameters independently. Therefore, we fixed the values (Carbon & Gingerich, 1969), km s-1 and km s-1 (Gray, 1988, and references therein). We emphasize that our subsequent findings do not require these specific parameter settings, and that the influences of , and are too small to revoke the effects of , and . For the given parameters the best fit value for is 42.3 km s-1. We estimate the total systematic errors to be km s-1. Models outside the range km s-1 all have .
Theoretical investigations of the line profile behaviour in Fourier space show that with differential rotation the inclination becomes important (e.g. Bruning, 1981). For comparable values of the best fit values of and are correlated. In Fig. 4 we consider calculated models with fixed , , , between 41.3 and 43.3 km s-1 and varying , and . Three groups of models are distinguished; , and .
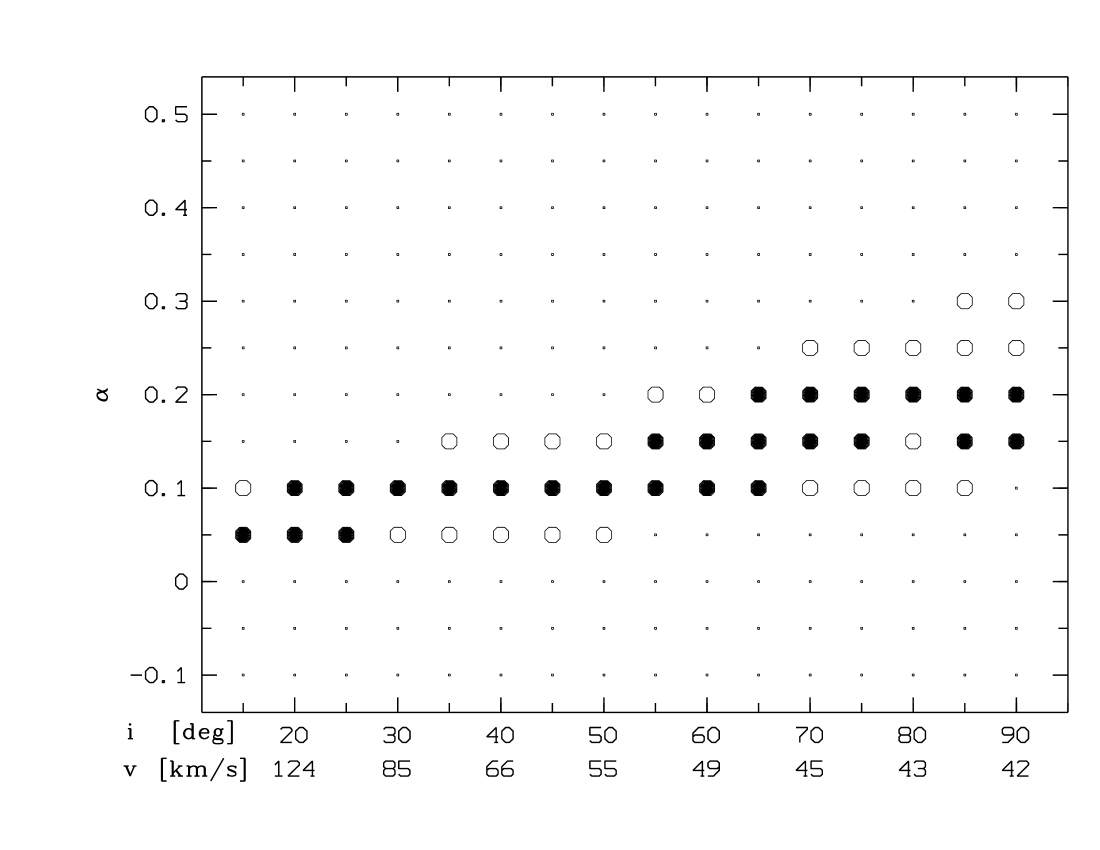
A well defined area of reliable fits in the – plot emerges. All fits with show . Although we used no absolute criterion on wheter a model is acceptable, the estimation of systematic errors and a comparison with Fig. 3 shows that the threshold is a rather high choice.
A variety of combinations of equatorial velocity and inclination seems possible for . A smaller differential effect is preferred for faster rotating models. For extremely high values of km s-1 rigid rotation might be argued, but such velocities seem unlikely given the age of Cap of a (Lachaume et al., 1999). Even the minimum rotational velocity of 42 km s-1 seems uncommonly high. From Fig. 4 we derive . The identical result was found for Si i 5772, where the same procedure was applied.
To summarize differential rotation has been established for the rapid rotator Cap independently from two absorption line profiles. While Cap rotates at least 20 times faster than the Sun, it’s differential rotation is comparable to the solar value, but not with the differential rotation patterns determined from Doppler images of the fast rotators AB Dor (Donati & Collier Cameron, 1997) and PZ Tel (Barnes et al., 2000). As direct predictions for a F5 dwarf have not been calculated by Kitchatinov & Rüdiger, (1999) and the rotation period of Cap is only poorly determined, the consistency of our result and the model is not clear. Assuming and , we find for Cap the rotation law rad/d; Cap does not rotate like a rigid body as suggested for AB Dor and PZ Tel. To compare theory and observations more detailed predictions especially on spectral type dependence and a greater sample of direct observations are needed. In particular verification of the differential rotation results of line profile analysis and Doppler imaging for the same star will be instructive.
Acknowledgements.
A.R. acknowledges financial support from Deutsche Forschungsgemeinschaft DFG-SCHM 1032/10-1.References
- Barnes et al., (2000) Barnes J.R., Collier Cameron A., James D.J., Donati J.-F., 2000, MNRAS 314, 162
- Baschek el al., (1966) Baschek B., Holweger H., Traving G., 1966, Abhandl. Hamburger Sternwarte 8, 26
- Belvedere et al., (1980) Belvedere G., Paternò L., Stix M., 1980, A&A 88, 240
- Blackwell & Lynas-Gray, (1998) Blackwell D.E., Lynas-Gray A.E., 1998, A&AS 129, 505B
- Bruning, (1981) Bruning D.H, 1981, ApJ 248, 274
- Bruning, (1984) Bruning D.H, 1984, ApJ 281, 830
- Carbon & Gingerich, (1969) Carbon D.F., Gingerich O., 1969, in Theory and Observation of normal stellar atmospheres, MIT Press, Ed. Gingerich O.
- Donati & Collier Cameron, (1997) Donati J.-F., Collier Cameron A., 1997, MNRAS 291, 1
- Dravins et al., (1990) Dravins D., Lindegren L., Torkelsson U., 1990, A&A 237, 137
- Gray, (1980) Gray D.F., 1980, ApJ 235, 508
- Gray, (1982) Gray D.F., 1982, ApJ 258, 201
- Gray, (1988) Gray D.F., 1988, Lectures on spectral-line analysis: F, G and K stars, The Publisher, Arva
- Gray, (1992) Gray D.F., 1992, The observation and analysis of stellar photospheres, Cambridge Univ. Press, Cambridge
- Groot et al., (1996) Groot P.J., Piters A.J.M., van Paradijs J., 1996, A&AS 118, 545
- Hempelmann et al., (1995) Hempelmann A., Schmitt J.H.M.M., Schultz M., Rüdiger G., Stȩpien K., 1995, A&A 294, 515
- Kitchatinov & Rüdiger, (1999) Kitchatinov L.L., Rüdiger G., 1999, A&A 344, 911
- Kürster, (2001) Kürster M., 2001, The CES User Manual; http://www.ls.eso.org/lasilla/Telescopes/360cat/ces/
- Kurucz, (1979) Kurucz R.L., 1979, ApJS 40, 1
- Kurucz, (1993) Kurucz R.L., 1993, in Peculiar versus normal phenomena in A-type and related stars, IAU Coll. 138, Eds. Dworetsky et al., ASP Conf. Series, 87
- Kurucz, (1994) Kurucz R.L., 1994, SAO, Cambridge, CDROM 20-22
- Kupka et al., (1999) Kupka F., Piskunov N.E., Ryabchikova T.A., Stempels H.C., Weiss W.W., 1999, A&AS 138, 119
- Lachaume et al., (1999) Lachaume R., Dominik C., Lanz T., Habing H.J., 1999, A&A 348, 897
- Lang, (1992) Lang K.R., 1992, Astrophysical Data I. Planets and Stars. Springer-Verlag, Berlin
- Messina et al., (2001) Messina S., Rodonò M., Guinan E.F., 2001, A&A 366, 215
- Townsend, (1997) Townsend R., 1997b, MNRAS 284, 839
- Uesugi et al., (1982) Uesugi, A., Fukuda, I., Catalogue of stellar rotational velocities (revised), Kyoto: University of Kyoto, Departement of Astronomy, 1982, Rev.ed