Cometary activity in 2060 Chiron
at minimum brightness
(Accepted for publication in Planetary & Space Science)
Abstract
We present two-colour CCD imaging of 2060 Chiron obtained between 1996 and 1998 with the 2.15 m telescope at CASLEO (San Juan, Argentina). These post-perihelion observations show that Chiron was then near its historical brightness minima, however a coma was clearly detected. The dynamical state of the coma is studied by means of azimuthally averaged surface brightness profiles, which show the signatures of radiation pressure on the dust grain distribution. Aperture photometry shows an achromatic dimming with an amplitude mag in approximately one hour. If due to rotation of the nucleus, this rather high amplitude is used to derive a new value for the nuclear magnitude, mag.
1 Introduction
The Centaur (2060) Chiron has been the target of extensive study, particularly since 1989 when its cometary activity was first detected (Meech and Belton, 1989). Ground-based surface photometry revealed a dust coma extending out to km from the nucleus (Luu and Jewitt, 1990; Meech and Belton, 1990; West, 1991; Marcialis and Buratti, 1993; Luu, 1993), while the inner coma was probed by means of stellar occultations (Elliot et al., 1995; Bus et al., 1996) and using HST (Meech et al., 1997). Water ice has been recently detected in Chiron (Foster et al., 1999; Luu et al., 2000), and its cometary activity is supposed to be powered by the release of trapped within the ice matrix (Prialnik et al., 1995; Fanale and Salvail, 1997).
Photometric observations have revealed, in addition to the rotational lightcurve, brightness variations with time-scales of days, weeks, and years which are ascribed to changing activity. However, it remains to be explained why Chiron’s brightness decreased while approaching perihelion, and why the presence of a prominent coma is not always coincident with brightness maxima (e.g., Lazzaro et al., 1997, and references therein). Hence, a continuous monitoring of this object, especially near perihelion, has often been encouraged. Considered as a nearby representative of Kuiper Belt objects, investigation of Chiron, and Centaurs in general, is ideal for getting a closer look at the frozen bodies of the outer Solar System (e.g., Stern and Campins, 1996). In this paper we present broad-band CCD imaging of Chiron during a post-perihelion period (1996–1998) when published optical photometry is rather scarce. The observations are described in Section 2, while Section 3 presents the results of our aperture and surface photometry. Our conclusions are given in Section 4.
2 Observations
We obtained broad–band (Johnson) and (Cousins) CCD imaging of 2060 Chiron on 5 nights during three different observing runs with the “Jorge Sahade” 2.15 m telescope of CASLEO (San Juan, Argentina). The detector was a cryogenically cooled Tek 1024 CCD, with a gain of 1.98 electrons adu-1 and a read-out noise of 9.8 electrons. A focal reducer provided a field of view approximately 9 arcmin in diameter, with a scale of 0.82 arcsec pix-2. The telescope was tracked at sidereal rate, hence exposure times of individual frames were limited to a maximum of 180 sec in order to avoid smearing of the images because of Chiron’s proper motion ( arcsec min-1).
The observations span a time interval of 16 months; the dates, UT at mid-exposure, and individual exposure times at and , respectively, are given in the first four columns of Table 1. Weather conditions varied along the nights, with very good atmosphere transparency during the 1997 run, but with thin cirrus during the two other runs, while seeing FWHM was never better than arcsec. Several standard stars fields from Landolt (1992) were also observed each night for calibrating the photometry to the standard system. Data reduction was made following normal procedures with the iraf software package444IRAF is distributed by the National Optical Astronomy Observatories, which are operated by the Association of Universities for Research in Astronomy, Inc., under cooperative agreement with the National Science Foundation.. All frames were debiased and flat-fielded using high signal–to–noise dome flats.
3 Results and Discussion
3.1 Aperture Photometry
Aperture photometry of Chiron and the standard stars was performed on every individual image with the apphot package within iraf, using an aperture radius of 10 pix (8.2 arcsec). Given the relatively high galactic latitude of Chiron during the observations (), there were no severe crowding problems in our images.
Table 1 also gives the apparent magnitude and colour, along with their respective photometric errors, for each observation. The corresponding heliocentric () and geocentric () distances and phase angles () were taken from the ephemeris, and were used to calculate the absolute () magnitudes, following Bowell et al. (1989), and adopting a slope parameter (Bus et al., 1989) to correct the magnitudes to phase angle . However, the presence of some degree of cometary activity (see Sect. 3.2) probably invalidates the use of such value (Lazzaro et al., 1997), hence reduced (, i.e., without any phase correction) magnitudes are also listed. Apparent magnitudes and astrometry obtained from the same observations have been reported by Orellana et al. (1998).
During our 1997 and 1998 observations Chiron was very close to its historical minima ( mag) of 1983-85 and 1995 (Lazzaro et al., 1996, and references therein), while in late 1996 it appeared slightly brighter, although the rather large error bar in this case prevents any reliable comparison. Mean absolute magnitudes were and for the 1997 and 1998 runs, respectively. The 1998 observations were done under non-photometric conditions, hence they had to be tied to a previous night with better weather through 6 stars within the CCD field that were observed both nights. Although a systematic error may thus still be present in the absolute photometry, a differential lightcurve for Chiron against a comparison field star () clearly shows a mag dimming in about one hour, as displayed in Figure 1. Differential magnitudes () of a second control field star () against , also shown, give a stability check. After correcting for light-time effect and adopting a synodic period of 5.917813 hs (Marcialis and Buratti, 1993), this brightness decrease is consistent with Chiron’s rotational lightcurve (Luu and Jewitt, 1990; Lazzaro et al., 1997) although the peak-to-peak amplitude seems to be larger than most published values ( mag). Our result matches the amplitude observed by Bus et al. (1989) during the 1986 brightness minimum, when no coma was directly observed and, hence, a small dilution was expected. Note that, if the brightness variation we report here is purely rotational, we can only set a lower limit to its amplitude since a clear minimum was not detected.
The corresponding colours in Table 1 get slightly bluer with time; however, this bluing is only apparent, being caused by the fact that the frames were taken a few minutes after the corresponding frames, and hence Chiron was then dimmer. Correction of this effect (by interpolating the magnitudes at the same instants of observation as the ones) gives a fairly constant colour, with a mean . This achromatic behaviour supports rotation of an asymmetric object as the origin of the light variation, against the effect of dark (and red) spots on the body’s surface.
Following Luu and Jewitt (1990, see their Eq. 19), a bare nucleus magnitude can be estimated from the relation between observed light-curve amplitude () and mean absolute magnitude. Our data ( mag, ) are best fitted with a relatively faint nuclear magnitude (see also Marcialis and Buratti, 1993) and a bare nucleus amplitude mag. However, Lazzaro et al.’s (1997) data are consistent with a much lower . An alternative explanation could be that the 1998 dimming was part of a larger, non-rotational brightness variation.
The 1997 data, obtained under photometric conditions, also show a mag dimming from the first to second nights, although in this case the time sampling is insufficient for trying a match with the rotational light-curve.
3.2 Surface Photometry
Azimuthally averaged surface brightness profiles (SBPs) of Chiron and two comparison stars within the same CCD frame were obtained with the ellipse task within iraf - stsdas from our deepest images, those obtained on 1997, June 27, and 1998, April 28. Several (2–7) frames per band corresponding to each night were summed up in order to improve the signal-to-noise ratio. Background objects were masked-out and a clipping routine was used to eliminate remaining faint objects and bad pixels. Comparison stars with magnitudes as close as possible to that of Chiron, and lying within no more than arcmin of projected distance from it, were always selected.
The images obtained on Apr 28, 1998 span a considerable range in time ( hour), hence two different composite frames were generated for each band: one using the centroids of several field stars for registering the frames before summing them up, and the other using the centroids of Chiron’s images. This procedure thus resulted in two sets of images, one with sidereal tracking, from which the comparison stars SBPs were obtained, and the other set as if “coarsely tracked” on Chiron, with 840 and 700 sec total exposure times in and , respectively.
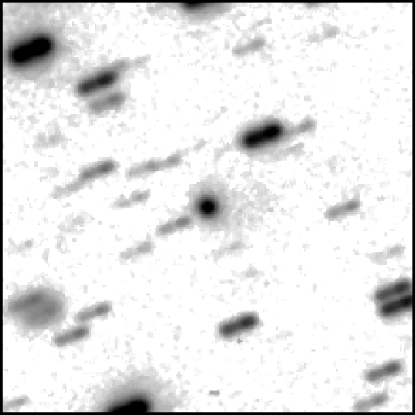
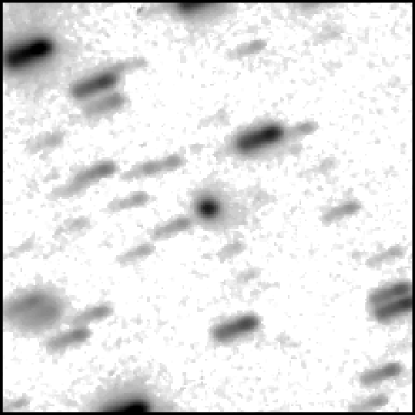
Grey level reproductions of the central arcmin of the Chiron–tracked, sky-subtracted images are shown in Figure 2. North is up and East to the left, with the anti-solar direction at position angle . A faint coma extending at least arcsec ( km projected distance) from the centre of Chiron’s image is visible in that direction. Note that Chiron’s orbital motion was directed at position angle , as can be seen from the star trails. Contour plots (of arcmin sub-images) are also shown in Figure 3, with the faintest contours displayed corresponding to mag arcsec-2 and mag arcsec-2, respectively, and a 1 mag arcsec-2 contour spacing.
Chiron’s coma is also evident from the high signal-to-noise SBPs as a surface brightness enhancement above the stellar PSF for distances to the nucleus (Figure 4); however, it is only marginally detected in the images with shorter effective exposure times obtained in 1996 and 1997 Jun 25-26. In every case, the fluxes of the two comparison stars within an 8 arcsec radius aperture were scaled to match that of Chiron. Special care was taken for sky determination and subtraction, since low surface brightness features are very sensitive to small errors in the adopted sky level. First, a plane was fitted to the sky background of each image and this fit was subtracted. Then, the SBPs were computed, and a final fine-tuning of the local sky level for each object (typically a few adu) was made by plotting the total flux vs. radius, and checking that the total flux attained a constant value for sufficiently large radii ( arcmin). Finally, the SBPs were re-computed after correcting for the residual sky.
A power-law , where is the surface brightness in intensity units and is the radial distance from the nucleus in arcsec, was fitted to the 1998 SBPs, after subtraction of scaled mean stellar profiles. The fits were made in the log–log plane, with the fitting range set to (), avoiding the seeing-smeared central regions as well as the noisy outer regions. The slopes thus obtained were and , for and , respectively.
These values are roughly consistent with a dust coma were radiation pressure effects are important (; e.g., Jewitt and Meech, 1987). However, still allowing for the respective errors, the slope of the SBP is steeper in than in , corresponding to a change in colour from at to at . Due to poorer seeing conditions, no reliable slope values could be obtained from the 1997 data; however, a qualitatively similar gradient is evident beyond the seeing disk and out to ( km) in a vs. plot.
This blue gradient could be tentatively explained as a scattering effect due to a smaller mean grain size at larger distances from the nucleus. Since the ratio of solar radiation pressure to solar gravity on the grain () is inversely proportional to the grain radius :
| (1) |
where kg m-2, is the radiation pressure scattering efficiency, and is the grain density (Meech et al., 1997), smaller grains should be more efficiently accelerated by radiation pressure thus traveling farther from the nucleus than larger grains.
Curiously, this outwards bluing of Chiron’s coma is opposite to the gradient observed by West (1991) in 1990. Since unnoticed systematic errors may be affecting our photometry at very faint surface brightness levels, independent confirmation would be desirable.
4 Conclusions
Our post-perihelion observations ( AU) show that during 1997 and 1998 Chiron was still at a brightness minimum, however, a coma was clearly detected. This coma can be traced out to a projected distance km in the anti-solar direction, and down to a surface brightness mag arcsec-2 , i.e, at least as faint as the deepest observations of Chiron published to date (Luu, 1993).
The slopes of the SBPs of this feature are consistent with a dust coma affected by radiation pressure. On the other hand, a significant (at a level) gradient is detected, with colours getting bluer outwards, both for 1997 and 1998 data. A grain population with mean size decreasing with distance from the nucleus could be invoked to explain the observed gradient, although, in the light of opposite results (West, 1991), our conclusion should be taken with care and confronted with new observations.
Our aperture differential photometry, during the night with best time coverage, shows that Chiron’s brightness dimmed by mag in roughly 1 hr without significantly changing its colour. If this dimming is totally due to rotational effects (and not part of a larger, non-asteroidal brightness change that our observations failed to completely sample), the nuclear magnitude can be estimated at ( band), with a bare nucleus light-curve amplitude mag.
Acknowledgements
Use of the CCD and data acquisition system supported under U. S. National Science Foundation grant AST-90-15827 to R. M. Rich is acknowledged. We thank Mario Melita for instructive discussion. We also wish to thank Dr. K. Meech and a second (anonymous) referee for useful comments.
References
- Bowell et al. (1989) Bowell, E., Hapke, B., Domingue, D., Lumme, K., Peltoniemi, J., Harris, A. W., 1989. Applications of photometric models to asteroids. In: Binzel, R. P., Gehrels, T., Matthews, M. S. (Eds.), Asteroids II, The University of Arizona Press, Tucson, Arizona, pp. 524–556.
- Bus et al. (1989) Bus, S. J., Bowell, E., Harris, A. W., Hewitt, A. V., 1989. 2060 Chiron - CCD and electronographic photometry. Icarus 77, 223–238.
- Bus et al. (1996) Bus, S. J., Buie, M. W., Schleicher, D. G., et al., 1996. Stellar occultation by 2060 Chiron. Icarus 123, 478–490.
- Elliot et al. (1995) Elliot, J. L., Olkin, C. B., Dunham, E. W., et al., 1995. Jet-like features near the nucleus of Chiron. Nature 373, 46–49.
- Fanale and Salvail (1997) Fanale, F. P., Salvail, J. R., 1997. The cometary activity of Chiron: A stratigraphic model. Icarus 125, 397–405.
- Foster et al. (1999) Foster, M. J., Green, S. F., McBride, N., Davies, J. K., 1999. NOTE: Detection of water ice on 2060 Chiron. Icarus 141, 408–410.
- Jewitt and Meech (1987) Jewitt, D. C., Meech, K. J., 1987. Surface brightness profiles of 10 comets. Astrophys. J. 317, 992–1001.
- Landolt (1992) Landolt, A. U., 1992. photometric standard stars in the magnitude range around the Celestial Equator. Astron. J. 104, 340–371.
- Lazzaro et al. (1997) Lazzaro, D., Florczak, M. A., Angeli, C. A., et al., 1997. Photometric monitoring of 2060 Chiron’s brightness at perihelion. Planet. Space Sci. 45, 1607–1614
- Lazzaro et al. (1996) Lazzaro, D., Florczak, M. A., Betzler, A., et al., 1996. 2060 Chiron back to a minimum of brightness. Planet. Space Sci. 44, 1547–1550.
- Luu (1993) Luu, J. X., 1993. Cometary activity in distant comets: Chiron. PASP 105, 946–950.
- Luu and Jewitt (1990) Luu, J. X., Jewitt, D. C., 1990. Cometary activity in 2060 Chiron. Astron. J. 100, 913–932.
- Luu et al. (2000) Luu, J. X., Jewitt, D. C., Trujillo, C., 2000. Water ice in 2060 Chiron and its implications for Centaurs and Kuiper belt objects. Astrophys. J. 531, L151–L154.
- Marcialis and Buratti (1993) Marcialis, R. L., Buratti, B. J., 1993. CCD photometry of 2060 Chiron in 1985 and 1991. Icarus 104, 234–243.
- Meech and Belton (1989) Meech, K. J., Belton, M. J. S., 1989. IAU Circ. No. 4770.
- Meech and Belton (1990) Meech, K. J., Belton, M. J. S., 1990. The atmosphere of 2060 Chiron. Astron. J. 100, 1323–1338.
- Meech et al. (1997) Meech, K. J., Buie, M. W., Samarasinha, N. H., Mueller, B. E. A., Belton, M. J. S., 1997. Observations of structures in the inner coma of Chiron with the HST Planetary Camera. Astron. J. 113, 844–862.
- Orellana et al. (1998) Orellana, R. B., Cellone, S. A., Silva, A., 1998. 2060 Chiron. M. P. C. 33165.
- Prialnik et al. (1995) Prialnik, D., Brosch, N., Ianovici, D., 1995. Modelling the activity of 2060 Chiron. MNRAS 276, 1148–1154.
- Stern and Campins (1996) Stern, A., Campins, H., 1996. Chiron and the Centaurs: escapees from the Kuiper belt. Nature 382, 507–510.
- West (1991) West, R. M., 1991. A photometric study of (2060) Chiron and its coma. Astron. Astrophys. 241, 635–645.
Figures


Tables
| Date | UT | |||||||||
|---|---|---|---|---|---|---|---|---|---|---|
| (h:m) | (sec) | (sec) | (mag) | (mag) | (AU) | (AU) | (deg) | (mag) | (mag) | |
| 1996 Dec 22 | 08:34 | 60 | 8.530 | 8.956 | 5.813 | |||||
| 1997 Jun 25 | 03:29 | 60 | 8.645 | 8.212 | 6.257 | |||||
| 03:36 | 60 | 40 | 8.645 | 8.212 | 6.257 | |||||
| 1997 Jun 26 | 02:13 | 20 | 30 | 8.645 | 8.226 | 6.296 | ||||
| 02:20 | 30 | 30 | 8.645 | 8.227 | 6.296 | |||||
| 1997 Jun 27 | 01:45 | 180 | 180 | 8.646 | 8.242 | 6.334 | ||||
| 01:49 | 180 | 180 | 8.646 | 8.242 | 6.335 | |||||
| 1998 Apr 28 | 07:06 | 120 | 100 | 8.938 | 7.941 | 0.974 | ||||
| 07:13 | 120 | 100 | 8.938 | 7.941 | 0.974 | |||||
| 07:20 | 120 | 100 | 8.938 | 7.941 | 0.973 | |||||
| 07:27 | 120 | 100 | 8.938 | 7.941 | 0.972 | |||||
| 07:42 | 120 | 100 | 8.938 | 7.941 | 0.971 | |||||
| 07:55 | 120 | 100 | 8.938 | 7.941 | 0.970 | |||||
| 08:06 | 120 | 100 | 8.938 | 7.941 | 0.969 |