The distance to the Vela pulsar gauged with HST parallax observations.111Based on observations with the NASA/ESA Hubble Space Telescope, obtained at the Space Telescope Science Institute, which is operated by AURA, Inc., under NASA contract NAS 5-26555.
Abstract
The distance to the Vela pulsar (PSR B083345) has been traditionally assumed to be 500 pc. Although affected by a significant uncertainty, this value stuck to both the pulsar and the SNR. In an effort to obtain a model free distance measurement, we have applied high resolution astrometry to the pulsar optical counterpart. Using a set of five HST/WFPC2 observations, we have obtained the first optical measurement of the annual parallax of the Vela pulsar. The parallax turns out to be mas, implying a distance of pc, i.e. a value significantly lower than previously believed. This affects the estimate of the pulsar absolute luminosity and of its emission efficiency at various wavelengths and confirms the exceptionally high value of the towards the Vela pulsar. Finally, the complete parallax data base allows for a better measurement of the Vela pulsar proper motion ( mas yr-1; mas yr-1 after correcting for the peculiar motion of the Sun) which, at the parallax distance, implies a transverse velocity of 65 km sec-1 . Moreover, the proper motion position angle appears specially well aligned with the axis of symmetry of the X-ray nebula as seen by Chandra. Such an alignment allows to assess the space velocity of the Vela pulsar to be 81 km sec-1.
1 Introduction
Assessing distances to Isolated Neutron Stars (INSs) is a
very challenging task which has been pursued using different
techniques in different regions of the electromagnetic
spectrum. Distances to pulsars with no glitching activity can be
obtained through radio timing techniques (Bell, 1998). However,
only millisecond radio pulsars allow for positional accuracies
high enough to be used for parallax measurements.
Toscano et al. (1999) count 6 such cases in their list of 12 pulsars,
the distances to which have been determined through parallax.
For the remaining 6 objects, which are all classical pulsars
with periods of few hundreds msec, a VLBI approach was used,
requiring a suitable nearby calibrator. The difficulties of the
VLBI technique, including the need to account for changing
ionospheric conditions, are apparent from the significant
revisions already published for two of the six parallax values.
The parallax of PSR B0919+06 went from 0.31 0.14 mas
(Fomalont et al., 1999) to 0.83 0.14 mas (Chatterjee et al., 2001), while for
PSR B0950+08 the parallax went from 7.9 0.8 mas
(Gwinn et al., 1986) to 3.6 0.3 mas (Brisken et al., 2000).
Even
if limited to twelve objects, e.g. 1% of the pulsar
family (Camilo et al., 2000), determining model-independent distances
of nearby pulsars is a rewarding exercise. As summarized by
Campbell et al. (1996) and Toscano et al. (1999), this allows to trace the
local interstellar medium. A distance value, coupled with the
pulsar dispersion measure, yields the electron density along the
line of sight, to be compared with the model of the galactic
distribution (Taylor & Cordes, 1993). Such a model is used to
derive the distances to all of the remaining pulsars (99% of
the population). Moreover, a distance value transforms the
pulsar proper motion into a firm transverse velocity, to be
compared with the average pulsar 3-D velocities obtained by
Lyne & Lorimer (1994) and Cordes & Chernoff (1998) on larger samples.
X-ray
astronomy provides hints to the distance of the score of
pulsars detected so far (Becker & Trümper, 1997) through the
measurement of the absorption of their soft X-ray
emission. Unfortunately, distances derived from X-ray
absorption are as uncertain as those derived by the dispersion
measure. In general, the radio distances are greater than the
X-ray ones.
With the detection of pulsars in the optical
(see e.g. Caraveo 2000), distance measurements became possible
using classic optical astrometry techniques, based on parallax
measurements. Measuring tiny parallactic displacements is never
easy, and the task can become really challenging when the
targets are intrinsically faint, like isolated neutron stars. It
requires high angular resolution coupled with high sensitivity,
rendering HST the instrument of choice to measure proper motions
and parallaxes of faint objects. The astrometric capabilities of
HST were used to obtain model free measurements of the distance
to Geminga (Caraveo et al., 1996) and RXJ 18563754 (Walter, 2001), two
radio quiet INSs for which radio astronomy could not provide
any input.
In this paper we address the
Vela pulsar (PSR B083345) which provides a compelling case of
nearby INS with a highly disputed value of the distance and a
relatively bright optical counterpart (). The
value of 500 pc, tentatively obtained after the original
pulsar discovery (e.g. Milne 1968; Prentice & ter Haar
1969), has been assumed as a reference for both the pulsar and
its surrounding SNR. As such, it is still quoted in
radio pulsar catalogues 222see e.g.
http://www.atnf.csiro.au/Research/pulsar/psr/archive/
or http://pulsar.ucolick.org/cog/pulsars/catalog/, in
spite of the doubts raised by several independent
investigations carried out at different wavelengths, targeting
both the pulsar and the SNR. On the basis of their analysis of
the ROSAT data, Page et al. (1996) placed the Vela pulsar at 285
120 pc, while Pavlov et al. (2001a), using Chandra data fitted by a
two component model, obtain a distance of pc.
On the other hand, studying the Vela remnant Cha et al. (1999)
and Bocchino et al. (1999) find a distance of pc and
280 pc, respectively. A different view is
proposed by Gvaramadze (2001) who, on the basis of the pulsar
scintillation velocity and on its very uncertain interpretation,
sees no reasons to revise the canonical 500 pc distance.
We
started our observations aimed at the measurement of the Vela
pulsar parallax in 1997, during HST observing Cycle 6, but we
had to wait until Cycle 8 to complete our program. Meanwhile,
our data have also been used to reassess the proper motion of
the Vela pulsar (De Luca et al., 2000a) and to quantify the overall
reliability of our astrometric approach (De Luca et al., 2000b). In the
following we shall report the analysis of our HST data leading to
the measurement of the Vela pulsar annual parallax and proper
motion. The impact of our result on the current understanding of
the Vela pulsar is also discussed. While HST was collecting
the appropriate set of images, VLBI in the southern hemisphere
came into existence and Vela was one of the targets. The
preliminary radio results (Legge, 2000) will be compared to our
optical ones.
2 The observations
The measurement of the annual parallax of a star through
optical astrometry techniques requires a set of at least three
observations of the field, preferably taken at the epochs of the
maximum parallactic elongation. For the Vela pulsar
(,
), the epochs of
maximum parallactic elongation coincide with days 118 and 303 of
the year for right ascension, and days 20 and 204 for
declination, with relative parallax factors (see e.g. Murray,
1983) at the maximum elongation of and
, respectively (see Figure 1).
Although the relative parallactic factor at maximum elongation
is somewhat larger in right ascension, observations at one of
the corresponding epochs turned out to be difficult to
schedule, due to their very tiny visibility window. For
this reason, the observations of Vela were scheduled close to
the epochs of the maximum parallactic displacements in
declination.
Our program was originally approved for HST
Cycle 6 but, unfortunately, only two observations of the
planned triplet were executed. The whole program had to go
through a new approval cycle and was rescheduled and
successfully completed in Cycle 8. We thus obtained a total of
five observations of the field with the WFPC2 between June 1997
and July 2000. The complete journal of the observations is
summarized in Table 1. At each epoch, two exposures of
the field were acquired with the WFPC2 “V” filter
(Å,Å) and with similar
integration times. In order to maximize the angular
resolution, in all cases the pulsar optical counterpart was
centered on the Planetary Camera chip (PC) of the WFPC2 (pixel
size of 0.045 arcsec).
3 Data reduction and analysis
The data reduction was been performed using the IRAF/STSDAS
package. After the standard pipeline processing of the frames
(debiasing, dark subtraction, flatfielding), which was performed
using the most recent reference files and tables, each couple
of coaligned images was co-added for a first filtering from
cosmic ray hits. Residual hits were later rejected using
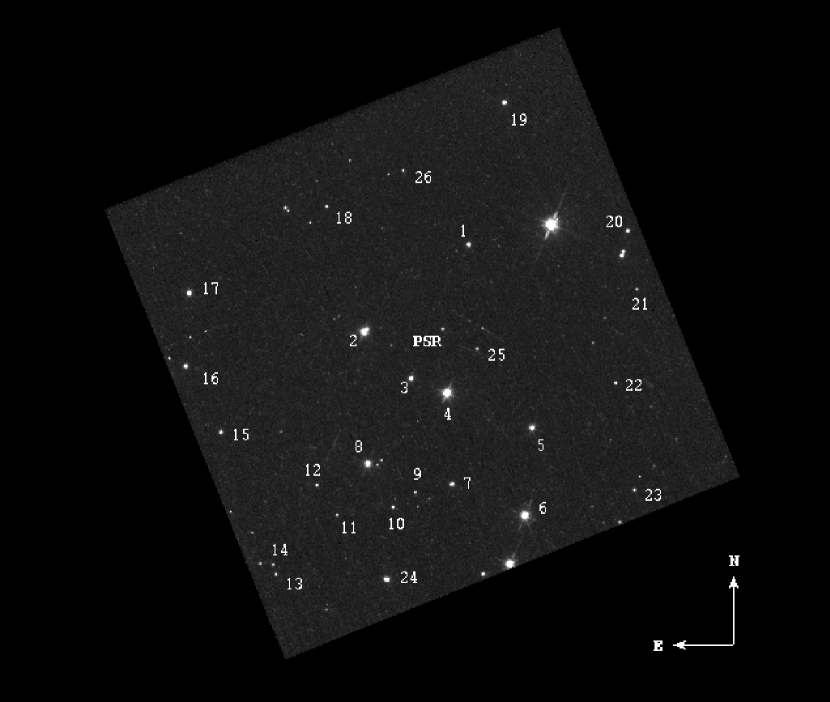
specific cosmic ray subtraction algorithms in IRAF. Figure
2 shows the resulting image for July
2000.
The cleaned images have then been used for the definition
of a relative reference frame to be used as a starting
point for our astrometric procedure. Since all the
observations have been taken with different telescope roll
angles and with small relative offsets, the definition of a
relative reference frame must rely on a very accurate image
superposition. Following the approach applied successfully
in previous astrometric works (e.g. Caraveo et al. 1996;
Caraveo and Mignani 1999; De Luca et al. 2000a; Mignani et
al. 2000a, Mignani et al. 2000b), this is done by computing a
linear coordinate transformation (i.e. accounting for 2
independent translation factors, 2 scale factors and a rotation
angle) between a set of reference objects.
The selection of
the reference grid objects is critical. They must be
point-like, present in all observations (but not too close to
the field edges), bright enough to allow for an accurate
positioning (but not saturated). A set of 26 such objects
(labeled in Figure
2) was selected in the reference frame of the PC.
Since the shape of the PC Point Spread Function (PSF) is known to
be position-dependent (Krist, 1995), we did not use simulated PSFs
for source fitting. On the other hand, the number of good
reference stars was not sufficient to compute a template PSF
directly from the images. Thus, the reference object coordinates
were computed by fitting a 2-D gaussian function to their
intensity profiles, using optimized centering areas. This
yielded positional uncertainties of the order of
pixel, depending on the objects’ brightness and position on the
chip. Special care was devoted to characterizing the
errors involved in the centroid determination. Following
De Luca et al. (2000b), we addressed both statistical errors (i.e.
due to each object’s S/N) and systematic ones (due, e.g., to the
telescope jitter, defocussing of the camera, charge transfer in
the CCD, background fluctuations, etc.). Moreover, we checked
that our results were not biased by the algorithm used for the
fitting. The coordinates were corrected for the “34th
row error” (Anderson & King, 1999) and for the significant, well-known,
instrument geometrical distortion using the most recent mapping
of the PC field of view (Casertano & Wiggs, 2000). The centroids of the
Vela pulsar optical counterpart were obtained in the same
way, yielding errors ranging between 0.02 and 0.04 pixel.
Having secured a reference grid, we registered all the frames
on the June 1999 one, taken as a reference and previously
aligned along right ascension and declination according to the
telescope roll angle. The rms of the residuals on the
reference object coordinates were pixel in right
ascension and pixel in declination. The overall
accuracy of the frame registration, accounting for errors in
the centroid determination as well as in the geometric
distortions mapping, and the accuracy of the fit, has been
discussed in detail by De Luca et al. (2000b).
To ensure that our procedure was not affected by any
displacement of our 26 reference objects (due either to
proper motions or parallaxes), we have repeated the frame
registration 26 times, i.e. each time excluding one of the
objects from the fit. In addition, to exclude any possible bias
due to the arbitrary choice of the reference frame, we have
repeated the whole procedure cycling it over the five epochs. In
all cases, we obtained statistically undistinguishable results.
We are thus confident that our procedure is correct and free
of systematics. Last, we have applied the coordinate
transformations to the positions of the Vela pulsar; the
resulting relative positions are
shown in Figure 3.
If fitted with a simple proper motion, all the points in Figure 3
are seen to deviate from the straight line. Their residuals wrt
the proper motion fit, however, are not randomly distributed.
Rather, they follow the trend expected for an object affected
also by parallactic displacement.
4 Analysis of the pulsar displacements
The geocentric right ascension and declination of the pulsar at a given epoch can be expressed in the form
| (1) |
where are the
barycentric coordinates at a reference time ,
are the right ascension and
declination components of the proper motion, is the
annual parallax and are the
parallactic factors shown in Figure 1. A system of
equations like ( 1) can be written for each of the five
epochs corresponding to our observations.
Setting
=1999, June 30 as the reference epoch, one can obtain five
pairs of equations relating the observed coordinates of the
pulsar to the 5 unknowns , , ,
and . A least squares
fit yields for the parallax and the proper motion the
following values: mas, mas yr-1, mas
yr-1, corresponding to a reduced of 0.11 (5
degrees of freedom).
To evaluate the uncertainties and the confidence levels on the
fitted parameters, we ran a MonteCarlo simulation for a
theoretical source featuring proper motion and parallax values
equal to our best fit ones. Each synthetic data set was
obtained by perturbating a coordinate set representing the
expected source geocentric positions at the epochs of our
observations. The experimental error (per coordinate) for each
data point in each simulated data set was computed from a
normal distribution with a standard deviation equal to the overall
uncertainty (per coordinate) affecting the pulsar positioning
estimated in sect. 3 (i.e. 2 mas per
coordinate in 1999, June 30; mas per
coordinate in the remaining
epochs).
After simulations, we estimate the 1 error
bar, to be attached to the parallax value, at 0.7 mas, while the
uncertainties on the proper motion are 1.1 mas in and 1
mas in . Thus, our best evaluation of the Vela pulsar
displacements is as follows:
mas
mas yr-1
mas yr-1
corresponding to a position angle of
.
The Vela path in the sky, as predicted from
the best fitting proper motion and parallax, is plotted in Figure
4, together with the measured pulsar positions. The
agreement between the expected positions and the measured ones is
remarkably good.
4.1 The proper motion
Our best fit to the pulsar proper motion improves the result of De Luca et al. (2000b) by confirming the overall value but by further reducing its associated errors. Since we measure the Vela proper motion with respect to a set of reference stars in the field, our value is sensitive to the peculiar motion of the Sun in the Local Standard of Rest. This induces an apparent annual displacement of the pulsar in the anti-Apex direction, which should be corrected for in order to evaluate the pulsar motion with respect to the structures located in its immediate surroundings (such as the synchrotron nebula detected in X-rays). A word of caution is required, since the correction depends critically on a reliable definition of the LSR. Following the analysis of Dehnen & Binney (1998), based on Hypparcos data, we assumed a peculiar motion of the Sun of km/s in the direction , . The components of the proper motion of the Vela pulsar with respect to the LSR become mas yr-1, mas yr-1, for a resulting position angle of . We note that a very similar result ( mas yr-1, mas yr-1, P.A.=) is obtained using the correction for the Sun peculiar motion adopted by Bailes et al.(1989).
4.2 The annual parallax
The value of the pulsar annual parallax which best fits our data is mas. The probability of obtaining such a value in absence of any parallactic displacement is of the order . From our parallax value we can derive the distance to the Vela pulsar, which turns out to be:
We can now compare our results on the Vela proper motion and parallax with the preliminary radio ones obtained by Legge (2000), e.g., mas yr-1, mas yr-1 and mas. While his parallax value is similar to ours, his proper motion values are not compatible with those obtained using the HST both for the study of ”pure”, parallax-free, proper motion (De Luca et al., 2000b) and for our parallax fit. However, no details are available on the calibrator used, nor on the ionospheric correction approach, nor on the correction for galactic rotation (on top of the Sun peculiar motion), so that we cannot assess the accuracy of the radio data analysis. Since the optical approach we have used is free from all such systematics, we conclude that our distance determination based, as it is, on direct measurement, with well known error determination procedure, is to be taken as the most reliable estimate to the true distance of this celestial object.
5 Discussions
After Geminga (Caraveo et al., 1996) and RXJ1856-3754 (Walter, 2001),
this is the third measurement of the optical parallax of an
isolated neutron star, to be added to the list of a dozen radio
parallaxes summarized by Toscano et al. (1999). At variance with the
two previous cases, that had no firm distance estimates, the new
value for the distance of the Vela pulsar is significantly
smaller than the traditionally accepted one, confirming the
earlier claims by Page et al. (1996), Bocchino et al. (1999), Cha et al. (1999)
and Pavlov et al. (2001a).
While adding an important piece of
information to the distribution of electrons in the local
environment, a distance of 300 pc has several implications
for the Vela pulsar physics, as well as for its kinematics.
In what follows we shall address each of these points.
5.1 Local Interstellar Medium
Toscano et al. (1999) used the 12 radio pulsars with a measured parallax to map the local interstellar medium and deduce electron densities along their different lines of sight. The Vela pulsar was added to the sample on the basis of the distance of 250 pc, suggested by Cha et al. (1999) for the SNR. Coupling the Vela DM (67 cm-3) with such a distance, Toscano et al. (1999) computed an of 0.270 cm-3, to be compared with the average density of 0.02 cm-3 of the Taylor & Cordes (1993) model for the local region. Indeed, the towards Vela is the maximum in their sample and it is 5 to 10 times higher than the values found for four other pulsars in the 3rd galactic quadrant. These pulsars already show values systematically higher than a comparable number of objects in the first galactic quadrant. Our distance value, while slightly lowering the value to 0.23 cm-3, confirms the extremely high electron density towards Vela, possibly pointing towards the existence of ionised clouds in the Vela region direction, at the edge of the so called CMa tunnel. This problem has been recently addressed by Cha et al. (2000) who, doing the ”astronephography” of the region (3-D mapping of interstellar clouds), found three distinct absorption systems with different velocities, consistent with an enhanced density of ionized material towards PSR B0833-45.
5.2 Multiwavelength emission
For twenty years, up to 1993, the Crab and Vela pulsars were the
only neutron stars detected throughout the entire electromagnetic
spectrum, from radio to optical to high-energy -rays.
Remarkably similar in high energy -rays, the behavior of
the two pulsars is very different at all other
wavelengths (see e.g. Thompson. 2001). Furthermore, our
current understanding of the pulsar emission mechanisms at
wavelengths other than radio has been biased by the
phenomenology of Crab and Vela, since theories have been
shaped to account for the multiwavelength behavior of these two
objects. The significant downsizing of the Vela pulsar
luminosity (by a factor of ) presented here,
implies some revision on the current view of pulsars
multiwavelength behavior. However, lowering the distance to
the Vela pulsar does not have the same impact in the
various spectral domains.
Vela has a very special place in
the high energy -ray sky where it is by far the
brightest source, outshining the Crab by a factor of
4. Its radiation is totally pulsed (Kambach et al., 1994) and
its spectral shape varies throughout the light curve. Of
course, to convert the measured flux into a luminosity one
needs to know the pulsar distance, together with its beaming
factor. While the -ray community never disputed the
traditional 500 pc value for the Vela distance, the beaming
solid angle remains unknown, ranging from the size of a neutron
star polar cap to for isotropic emission (see Thompson
et al. 1999 and references therein). For simplicity, a 1 sr
conical beam is generally assumed, yielding a beaming factor of
. With such a beaming value, the high energy luminosity
of the Vela pulsar is now erg sec-1,
comparable to that of the much older PSR B105552 and 10 times
lower that that of PSR B170644, a pulsar remarkably similar
to Vela in its , and overall energetics. Moreover,
the efficiency with which Vela converts its rotational energy
loss into -rays becomes 0.001, similar to that of the
much younger Crab and 20 times smaller than that of PSR
B170644. Not surprisingly, the Vela pulsar is now well
below any best fitting line correlating the -ray
luminosity to pulsar parameters such as the number of
accelerated particles (Thompson et al., 1999) or the value of the open
field line voltage (Thompson, 2001). This will require a critical
re-examination of the position of Vela in the -ray
emitting pulsar family. Vela may become an
underluminous pulsar, an apparent paradox considering its
brightness in the -ray sky.
In the X-ray domain,
the situation is different. The X-ray emission phenomenology
already prompted a number of authors (Page et al. 1996; Pavlov
et al. 2001a; Helfand et al. 2001) to opt for a distance
smaller than the “canonical” one. Indeed, for a distance of
500 pc, the soft X-ray flux, most probably originated by the hot
surface of the neutron star, pointed towards an emitting area
( km) far too small to be compatible with
the whole neutron star surface (Ögelman et al., 1993). On the other
hand, a very small emitting hot spot is obviously incompatible
with the shallow pulsation seen at these energies. Reducing
the pulsar distance to half its “canonical” value,
Pavlov et al. (2001a) find that for a pure black-body emission, a radius
of the emitting area of just km could explain
the flux observed by Chandra. Introducing a modified black body
with a pure H atmosphere eases the emitting area problem,
allowing for the whole surface of a 13 km radius neutron star
at 210 pc to emit at a temperate significantly smaller than
that obtained in the pure black body case. Our new
independent distance determination now freezes one of the
parameters of the model, allowing for a better determination of
both the neutron star radius and its temperature.
The parallax distance fixes the overall Vela X-ray luminosity
(0.2-8 keV) to be about 5.5 1032 erg/sec, divided between a
thermal component, dominating at low energies, and a non thermal
one, emerging only at higher energies. If compared to the
available rotational energy loss, such an X-ray emission accounts
for 8 10-5 of the pulsar reservoir, significantly less than
the average ratio of 10-3 found for the majority
of the young X-ray emitting pulsars (Becker & Trümper, 1997). Moreover, such
an already low conversion efficiency shrinks to 10-6 if one
considers only the non-thermal component, confirming the severe
underluminosity of PSR 0833-45 in the X-ray domain. The
interpretation of such an underluminosity is, however, complicated
by the composite nature of the Vela emission. It is certainly
dominated by thermal emission for E 1.8 keV, with a
weaker magnetospheric component emerging only at E 1.8
keV Pavlov et al. (2001a). Because of such a composite nature, the Vela
pulsar X-ray emission cannot be readily compared to other
purely magnetospheric cases (e.g the Crab and PSR B054069).
The X-ray data can also be used to further map the local ISM.
The comparison between distance and Hydrogen column density,
, responsible of the X-ray absorption, provides an
assessment of the reliability of this
parameter as a distance indicator for nearby sources.
In the optical domain, the reduction in the pulsar luminosity
has important implications. Here the emission is certainly
magnetospheric - as witnessed by its double-peaked light curve
(Wallace et al., 1977; Manchester et al., 1978; Gouiffes, 1998) and by its flat Å
spectrum (Nasuti et al., 1997; Mignani & Caraveo, 2001). However, the revised value of the
B-to-U optical luminosity 5.5 1028 erg
sec-1 is now quite low with respect to the prediction of
the classical Pacini & Salvati (1983) model, based on synchrotron emission
at the light cylinder. Such an underluminosity could neither be
ascribed to the spectral shape of the optical emission, which is
remarkably similar to the Crab one (Mignani and Caraveo, 2001),
nor to the shape of the light curve (see e.g. Gouiffes, 1998 ),
which covers a broader phase interval than the Crab one,
resulting, if anything, in an increase of the optical output.
The behaviour of the Vela pulsar in the optical domain should be
considered in the light of its “transition” position between the
group of the young energetic pulsars, characterized by pure
magnetospheric emission and the middle-aged ones characterized by
composite spectra and lower emission efficiency (see e.g.
Caraveo, 1998; Mignani and Caraveo, 2001).
In the X-ray domain
Vela behaves as a middle-aged object (see e.g. Pavlov et al,
2001a) while in the optical and gamma-ray energy ranges its
phenomenology is reminiscent of that of the younger pulsars but
with a low emission efficiency. The multiwavelength luminosities
of the Vela pulsar, stemming from the newly determined distance,
will help to discriminate the emission mechanisms at work in the
different energy domains and to assess their evolution throughout
the life of the pulsars.
5.3 Proper motion
The parallax fit yields also, as a by-product, the best proper
motion value obtained so far at optical wavelengths,
corresponding to a transverse velocity of 65 km
sec-1. The space direction of the Vela proper motion has
been correlated with the axis of symmetry of the Chandra X-ray
structure by a number of authors (Mignani et al. 2000b,
Helfand et al. 2001 and Pavlov et al. 2001b). Since the
X-ray nebula axis of symmetry should trace the pulsar
rotational axis, an alignment between such axis of symmetry and
the pulsar proper motion would have important bearings of the
kick mechanism responsible for the neutron star ejection.
Lai et al. (2001), noting that proper motion-axis of symmetry
alignment seems to be present also for the Crab pulsar
(Caraveo & Mignani, 1999), considered different spin-kick alignment
mechanisms. Also in view of the pulsars’ low velocities, they
concluded that both natal kicks, be they hydrodynamic or
neutrino-magnetic, as well as postnatal ones, such as the
Harrison and Tademaru (1975)
electromagnetic kick, could account for the alignments.
Here, we reassess the case for the Vela proper motion X-ray jet
alignment by comparing our ”corrected” proper motion position
angle (p.a.) of with the value of
computed by Pavlov et al. (2001b) for the
axis of symmetry of the structure seen by Chandra. Assuming an
uniform probability distribution for the two vectors in space, we
estimate the chance occurrence probability to be 1.2 ,
thus strengthening the case for an alignment between the Vela
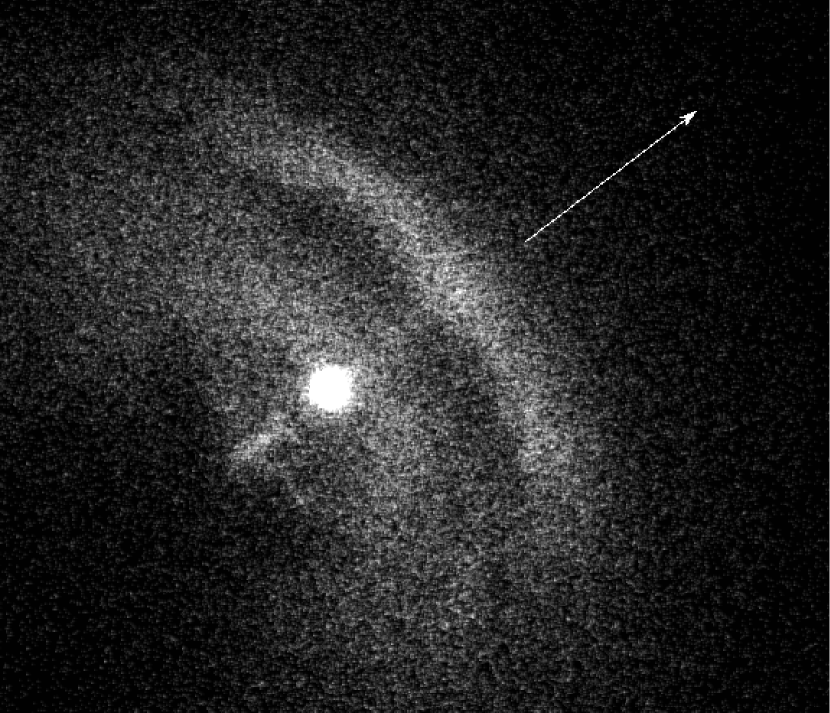
rotation axis and its proper motion. Figure 5 shows an update
of Figure 2 of Mignani et al. (2000b), with our corrected proper motion
vector superimposed to the high resolution Chandra image of the
Vela nebula. Taking advantage of such an alignment we can use the
angle of 53.2∘, computed by Helfand et al (2001) between
the axis of the X-ray torus and the line of sight, to convert our
measured transverse velocity into the pulsar 3-D velocity. Thus,
the space velocity of the Vela pulsar turns out to be 81 km/sec.
While hardly compatible with the Lyne & Lorimer (1994) mean value of 400
km sec-1, our value is also in the low side of the low
velocity component of the bimodal fit by Cordes & Chernoff (1998),
classifying Vela as a rather slow moving pulsar.
6 Conclusions
We have presented the first direct measurement of the distance
to the Vela pulsar at optical wavelengths. Our value is
significantly smaller than the canonical one, implying a
downgrading of the luminosity of the Vela pulsar, positioning
Vela among the underluminous pulsars. High energy -ray
astronomy is the most affected by our result since it pertains
to the brightest, hence most conspicuous, source in the
-ray sky. The optical domain is also seriously
affected by our overall luminosity reduction, while the X-ray
side is only marginally altered. The distance determination also
confirms the anomalously high density of electrons towards
the Vela pulsar, pointing to the presence of ionized clouds in
the local interstellar medium.
As a byproduct of the
parallax fit, we have obtained a very accurate proper motion
value, which appears nicely aligned along the axis of symmetry
of the X-ray nebula, hence the pulsar rotation axis. Moreover,
our proper motion, together with our distance
determination, fixes the transverse velocity of Vela to 65 km
sec-1. Using the inclination of the X-ray torus, as measured
by Helfand et al (2001), we can convert our transverse velocity
into the 3-D one, yielding a value of 81 km sec-1. For a
pulsar, this is certainly a low velocity.
7 Acknowledgements
This work was supported by the Italian Space Agency (ASI).
We
thank the referee, David Chernoff, for his suggestions.
References
- Anderson & King (1999) Anderson, J. & King, I.R. 1999, PASP, 111, 1095
- Bailes et al. (1989) Bailes, M., Reynolds, J.B. & Manchester, R.N. 1989, ApJ, 343, L53
- Becker & Trümper (1997) Becker, W. & Trümper, J. 1997, A&A, 326, 682
- Bell (1998) Bell, J.F. 1998, AdSpR, 21, 137
- Bocchino et al. (1999) Bocchino, F., Maggio, A., & Sciortino, S. 1999, A&A, 342, 839
- Brisken et al. (2000) Brisken, W.F. et al. 2000, ApJ, 541, 959
- Camilo et al. (2000) Camilo, F. et al. 2000, in ASP Conf.Ser. 202, Pulsar Astronomy - 2000 and Beyond, ed. M. Kramer, N. Wex, and N. Wielebinski, (San Francisco: ASP), p.3
- Campbell et al. (1996) Campbell, R.M. et al. 1996, ApJ, 461, L95
- Caraveo et al. (1996) Caraveo, P.A., Bignami, G.F., Mignani, R. & Taff, L.G. 1996, ApJ, 461, L91
- Caraveo (1998) Caraveo, P.A. 1998, Advances in Space Reserch, 21,187
- Caraveo & Mignani (1999) Caraveo, P.A. & Mignani, R.P. 1999, A&A, 344, 367
- Caraveo (2000) Caraveo, P.A. 2000, in ASP Conf.Ser. 202, Pulsar Astronomy - 2000 and Beyond, ed. M. Kramer, N. Wex, and N. Wielebinski, (San Francisco: ASP), p.289.
- Casertano & Wiggs (2000) Casertano, S. & Wiggs, M.S. 2000, see WFPC2 Instrument Handbook v5.0, 2000, ed.STScI
- Cha et al. (1999) Cha, A.N., Sembach, K.R. & Danks, A.C. 1999, ApJ, 515, L25
- Cha et al. (2000) Cha, A.N., Sahu, M.S., Moos, H. & Blaauw, A. 2000, ApJS, 129, 281
- Chatterjee et al. (2001) Chatterjee, S., Cordes, J. M., Lazio, T. J. W., Goss, W. M., Fomalont, E. B. & Benson, J. M. 2001, ApJ, 550, 287
- Cordes & Chernoff (1998) Cordes, J.M. & Chernoff, D.F. 1998, ApJ, 505, 315
- Dehnen & Binney (1998) Dehnen, W. & Binney, J.J. 1998, MNRAS, 298, 387
- De Luca et al. (2000a) De Luca, A., Mignani, R.P. & Caraveo, P.A. 2000a, A&A, 354, 1011
- De Luca et al. (2000b) De Luca, A., Mignani, R.P. & Caraveo, P.A. 2000b, to appear in the proc. of the Symp. A Decade of HST Science, Baltimore, April 11 - 14, 2000, astro-ph/0009034
- Fomalont et al. (1999) Fomalont, E. B., Goss, W. M., Beasley, A. J. & Chatterjee, S. 1999, AJ, 117, 3025
- Gouiffes (1998) Gouiffes, C. 1998, Proc. Neutron Stars and Pulsars: 30 years after the discovery, Eds. N.Shibazaki, N.Kawai, S. Shibata & T. Kifune, p.363, Universal Academic Press
- Gvaramadze (2001) Gvaramadze, V. 2001, A&A, 369, 174
- Gwinn et al. (1986) Gwinn, C. R., Taylor, J. H., Weisberg, J. M. & Rawley, L. A. 1986, AJ, 91, 338
- Harrison & Tademaru (1975) Harrison, E.R., & Tademaru E. 1957,ApJ201,447
- Helfand et al. (2001) Helfand, D.J., Gotthelf, E.V. & Halpern, J.P. 2001, ApJ, in press, astro-ph/0007310
- Kambach et al. (1994) Kambach, G. et al. 1994, A&A, 289, 855
- Krist (1995) Krist, J. E. 1995, in Calibrating Hubble Space Telescope: Post Servicing Mission, eds. A. Koratkar and C. Leitherer, p. 311.
- Lai et al. (2001) Lai, D., Chernoff, D. F. & Cordes, J. M. 2001, ApJ, 549, 111
- Legge (2000) Legge D. 2000, in ASP Conf.Ser. 202, Pulsar Astronomy - 2000 and Beyond, ASP Conference Series, Vol. 202, p. 141, ed. M. Kramer, N. Wex, and N. Wielebinski
- Lyne & Lorimer (1994) Lyne, A.G. & Lorimer, D.R. 1994, Nature, 369, 127
- Manchester et al. (1978) Manchester, R.N., et al. 1978, MNRAS, 184, 159
- Mignani et al. (2000a) Mignani, R.P., De Luca, A. & Caraveo, P.A. 2000a, ApJ, 543, 318
- Mignani et al. (2000b) Mignani, R.P., Caraveo,P.A. & De Luca, A. 2000b, to appear in the proc. of the Symp. A Decade of HST Science, Baltimore, astro-ph/0009033
- Mignani & Caraveo (2001) Mignani, R.P. & Caraveo, P.A. 2001, A&A, in press astro-ph/0107027
- Milne (1968) Milne, D.K. 1968, Australian J. Phys., 21, 201
- Murray (1983) Murray, A.C. 1983, ”Vectorial Astrometry”, Adam Hilger Ltd.,Bristol
- Nasuti et al. (1997) Nasuti F.P., Mignani R.P., Caraveo P.A. & Bignami G.F. 1997, A&A, 323, 839
- Ögelman et al. (1993) Ögelman, H., Finley, J.P. & Zimmerman, H.U. 1993, Nature, 361, 136
- Pacini & Salvati (1983) Pacini, F. & Salvati, M. 1983, ApJ, 274, 369
- Page et al. (1996) Page D., Shibanov Y.A. & Zavlin V.E. 1996, in proc. ‘Roentgenstrahlung from the Universe’, ed. H.U. Zimmermann, J.Trumper, H.Yorke, MPE Report 263, p. 173
- Pavlov et al. (2001a) Pavlov, G.G., Zavlin, V.E., Sanwal, D., Burwitz, V. & Garmire, G. 2001b, ApJ, 552, L129
- Pavlov et al. (2001b) Pavlov, G.G., Kargaltsev, O.Y., Sanwal, D. & Garmire. G.P. 2001b, ApJ, 554, L189
- Prentice & ter Haar (1969) Prentice, A.J.R. & Ter Haar, D. 1969, MNRAS, 146, 423
- Spruit & Phinney (1998) Spruit, H. & Phinney, B.S. 1998, Nature, 393, 139
- Taylor & Cordes (1993) Taylor, J.H. & Cordes, J.M. 1993, ApJ, 411,674
- Toscano et al. (1999) Toscano, M. et al. 1999, ApJ, 523, L171
- Thompson et al. (1999) Thompson, D. J et al. 1999, ApJ, 516, 297
- Thompson (2001) Thompson, D.J. 2001, to appear in the proceedings of the International Symposium on High-Energy Gamma-Ray Astronomy, 2000, Heidelberg, astro-ph/0101039
- Wallace et al. (1977) Wallace, P.T. et al. 1977, Nature, 266, 692
- Walter (2001) Walter, F.M. 2001, ApJ, 549, 433


| Obs. ID | Date | N.of exp. | Exposure(s) | ||
|---|---|---|---|---|---|
| 1 | 1997 June 30 | -0.467 | 0.850 | 2 | 1300 |
| 2 | 1998 January 2 | 0.399 | -0.852 | 2 | 1000 |
| 3 | 1999 June 30 | -0.478 | 0.852 | 2 | 1000 |
| 4 | 2000 January 15 | 0.196 | -0.887 | 2 | 1300 |
| 5 | 2000 July 5 | -0.394 | 0.883 | 2 | 1300 |