Star Formation in a Complete Spectroscopic Survey of Galaxies
Abstract
The 15R-North galaxy redshift survey is a uniform spectroscopic survey (S/N 10) covering the range 3650—7400Å for 3149 galaxies with median redshift 0.05. The sample is 90% complete to . The median slit covering fraction is 24% of the galaxy, apparently sufficient to minimize the effects of aperture bias on the EW(H).
Forty-nine percent of the galaxes in the survey have one or more emission lines detected at . In agreement with previous surveys, the fraction of absorption-line galaxies increases steeply with galaxy luminosity.
We use H, O[III], H, and [N ii] to discriminate between star-forming galaxies and AGNs. At least 20% of the galaxies are star-forming, at least 17% have AGN-like emission, and 12% have unclassifiable emission. The unclassified 12% may include a “hybrid” population of galaxies with both star-formation and AGN activity. The AGN fraction increases steeply with luminosity; the fraction of star-forming galaxies decreases.
We use the EW(H + [N ii]) to estimate the Scalo birthrate parameter, , the ratio of the current star formation rate to the time averaged star formation rate. The median birthrate parameter is inversely correlated with luminosity in agreement with the conclusions based on smaller samples (Kennicutt, Tamblyn, & Congdon, 1994). Because our survey is large, we identify 33 vigorously star-forming galaxies with . We confirm the conclusion of Jansen, Franx, & Fabricant (2001) that EW(O[II]) must be used with caution as a measure of current star formation.
Finally, we examine the way galaxies of different spectroscopic type trace the large-scale galaxy distribution. As expected the absorption line fraction decreases and the star-forming emission-line fraction increases as the galaxy density decreases. The AGN fraction is insensitive to the surrounding galaxy density; the unclassified fraction declines slowly as the density increases. For the star-forming galaxies, the EW(H) increases very slowly as the galaxy number density decreases.
Whether a galaxy forms stars or not is strongly correlated with the surrounding galaxy density averaged over a scale of a few Mpc. This dependence reflects, in large part, the morphology-density relation. However, for galaxies forming stars, the stellar birthrate parameter is remarkably insensitive to the galaxy density. This conclusion suggests that the triggering of star formation occurs on a smaller spatial scale.
keywords:
galaxies: active — galaxies: fundamental parameters (classification, colors) — galaxies: distances and redshifts — galaxies: interactions — galaxies: spectroscopy — galaxies: starburst1 Introduction
Although redshift surveys have come of age, only a few recent surveys have sufficiently uniform, high quality spectra to examine the spectral properties of galaxies in the nearby universe (Tresse et al., 1999; Ho, Filippenko, & Sargent, 1997; Bromley et al., 1998; Folkes et al., 1999; Blanton et al., 2001). The interrelations among spectral properties, morphology, and intrinsic luminosity of galaxies are important for understanding their formation and evolution. The spatial distribution of galaxies as a function of spectral type is also a test of models for galaxy and structure formation.
Some broad general conclusions on these issues are robust from one survey to another. The fraction of emission-line galaxies increases with decreasing intrinsic galaxy luminosity (Tresse et al., 1999; Lin et al., 1996a; Zucca et al., 1997). Over a broad range of luminosities, emission-line galaxies appear less strongly clustered than absorption-line galaxies (Loveday, Tresse, & Maddox, 1999; Iovino et al., 1993; Salzer, 1989; Rosenberg, Salzer, & Moody, 1994; Lin et al., 1996b).
Aperture bias may be important in assessing the relative distributions of star-forming and absorption-line galaxies (Kochanek, Pahre, & Falco, 2001). Apertures which cover only a small fraction of a galaxy, such as in fiber-fed spectroscopy, may bias the classification against emission line objects by missing HII regions in spiral disks or in the outer regions of irregulars. The larger the bulge of the galaxy, the more potentially serious the bias. The well-known morphology density relation along with a small aperture can conspire to produce a stronger dependence of the star-formation rate on density than is actually present.
A detailed understanding of the emission-line population at zero redshift is an important cornerstone for assessing the star formation history of the universe. A number of investigators have concluded that the star formation rate has decreased substantially from z 1.5 to the present. One uncertain aspect of the star fromation rate at zero redshift is the possible large contribution of AGNs to the emission-line population.
The quality of the spectra and the inclusion of the H, [O iii], H, and [N ii] lines are important for discriminating between AGN and star-forming galaxies. Ho, Filippenko, & Sargent (1997) find AGNs in 44% of their sample of 471 high quality (S/N 100) nuclear spectra of nearby galaxies which include these diagnostic lines. Surveys with poorer spectra and/or more limited spectral coverage reveal AGNs at much lower rates (Huchra & Burg, 1992; Bothun et al., 1989; Tresse et al., 1999; Hashimoto, Oemler, Lin, & Tucker, 1998). The Las Campanas Redshift Survey (Hashimoto, Oemler, Lin, & Tucker, 1998) spectra do not include H and [N ii]; the Stromlo-APM (Tresse et al., 1999) spectra do not include [O iii]. If the AGN fraction is truly large, unidentified AGNs can bias the assessment of the star formation rate.
To examine the properties and distribution of star-forming galaxies in the nearby universe, we discuss the 15R survey, a uniform, complete spectroscopic survey of 3149 galaxies with . Our spectra cover the entire wavelength range 3650—7400Å with typical S/N 10 and include H and [N ii]. The median fraction of the integrated galaxy light included in our spectra is 24%.
Section 2 describes the details of the survey. We demonstrate that the equivalent width (EW) of H is insensitive to aperture bias. Section 3 discusses the application of the Veilleux-Osterbrock (1987) classification scheme to discriminate between star-forming galaxies and those dominated by an AGN. We use the EW(H + [N ii]) to estimate the Scalo birthrate parameter, a measure of the current star-formation rate. We identify a set of 33 galaxies which are undergoing an intense burst of star formation. We also explore the use of [O ii] as a indicator of star formation. In section 4 we explore the relationship between local density and the spectral type. We conclude in Section 5.
2 Sample Selection and Preliminary Analysis
2.1 Sample Selection
We draw our galaxy sample from the northern portion of the 15R Redshift Survey. (The data for the entire survey will appear in Geller et al., 2001). The 15R North Survey includes all galaxies with Kron-Cousins (see, e.g., Cousins, 1980; Bessell, 1990, 1995) and within two 2.5∘ strips straddling the Century Survey (Geller et al., 1997, CS hereafter). The two strips cover and and (B1950), a total of steradians. Figure 1 shows the distribution of the 15R North galaxies in the plane of the sky and in redshift space. Henceforth, we use 15R as a shorthand for 15R North, and we use to denote Kron-Cousins magnitude.
2.2 Photometric Calibration
We obtained the initial 15R galaxy catalog from the POSS I E plates, scanned at STScI with 25 pixels; the catalog covers the entire plate including both the CS and 15R strips. Using techniques described by McLean et al. (1998), we reduced the data to instrumental magnitudes and obtained star/galaxy classifications. These initial galaxy catalogs often omit the brightest objects. We recovered missing galaxies from the Zwicky, Herzog, & Wild (1961—1968) catalog.
The CS passes across the central portion of each 15R plate. We therefore calibrated each 15R plate by comparing the instrumental magnitudes with the CS magnitudes (Geller et al., 1997). Geller et al. calibrated the photographic CS magnitudes against the CCD drift scans of Kent, Ramella, & Nonino (1993); Ramella et al. (1995), along with pointed CCD measurements. On each plate there are galaxies with in the CS region. We use CS magnitudes of these galaxies to calibrate the instrumental isophotal 15R magnitudes. We fit each plate separately for both zero point and slope, fitting the medians of the data in 0.5 mag bins.
For one plate, E1393, we used a CCD survey of the Coma cluster (Kashikawa et al., 1995, 1998) to test our photometric calibration. We have 120 galaxies in common with Kashikawa et al. with . The 1 difference between the 15R and Kashikawa et al. measurements is 0.18 mag for galaxies fainter than . For galaxies with , the 15R measurements are systematically too faint by 0.4 mag per mag; these comprise 7% of the survey.
2.3 Spectra and Redshifts
We obtained all of the spectra with the FAST spectrograph on the Tillinghast 1.5m telescope on Mt. Hopkins. We extracted each spectrum from a single exposure of 180 to 600 s. In all cases, the spectrograph slit is 3 arcseconds wide and 3 arcminutes long, aligned E-W. We extract the raw 2D spectra (as described in 2.6) and produce 1D wavelength-calibrated spectra, with 3600—7400 Å spectral coverage, 6 Å FWHM resolution, and typical S/N 10. This spectral range includes H for all but three 15R galaxies at 0.15. Plate 1 is a color plate of all the 15R spectra discussed in this paper, sorted by H equivalent width.
We make a correction for atmospheric water and O2 absorption near 7000Å in the 25% of the cases where the absorption might affect the measurement of H 6563Å or [N ii] 6548,6583Å line strengths. We derived the correction from several exposures of the standard star CygOB2#9, scaled by the effective airmass of each exposure.
We use observations of Massey flux-standard stars (Massey et al., 1988) obtained during each observing run to flux calibrate the galaxy spectra. We derive a separate calibration for each run, typically 1 to 2 weeks long. By comparing the flux calibrated spectra of galaxies observed more than once, we estimate that the RMS error in the flux calibration is 6% over most of the spectral range, increasing to 10% below 4500 Å.
We measured equivalent widths of prominent emission features before flux calibrating the spectra. Table 1 lists the index definitions of the relevant lines. We use the convention that positive equivalent widths denote emission.
2.4 Absolute Magnitudes
Given the apparent Cousins-R magnitude , we apply a -correction, , and Galactic reddening correction, , to compute the absolute Cousins-R magnitude :
| (1) |
where the luminosity distance is
We assume km sec-1 Mpc-1 and .
We use -corrections from Poggianti (1997) and Frei & Gunn (1994). We do not correct for evolutionary effects because they are strongly model-dependent, and are generally negligible at small redshifts. The largest -correction is mag, less than the uncertainty in an individual apparent magnitude. We apply an elliptical -correction for galaxies with absorption-line spectra and an Sc -correction function for galaxies with emission-line spectra ( 3 gives our definitions of absorption-line and emission line spectra). We average the elliptical galaxy -corrections of Poggianti (1997) and Frei & Gunn (1994). For the emission-line galaxies we average the Frei & Gunn (1994) Sbc and Scd and the Poggianti (1997) Sc -corrections. Figure 3 shows the adopted corrections.
For Galactic extinction, we follow Winkler (1997):
Here is the extinction in magnitudes in the filter passband , and the reddening, is . Following Savage & Mathis (1979) we adopt:
We derive the reddening from the relation of Bohlin, Savage, & Drake (1978):
where is the column density of neutral hydrogen in atoms cm-2 (Burstein & Heiles, 1982). For the 15R sample, the median value of is 0.09 magnitudes, with extremes of 0.04 and 0.24 mag.
2.5 Slit Covering Fraction
The emission line equivalent widths we measure may depend on the fraction of the integrated galaxy flux that falls on our slit. Kochanek, Pahre, & Falco (2001) demonstrate that small slit (aperture) covering fractions may introduce a bias in the estimate of emission line equivalent widths. They argue that in fiber surveys the small covering fraction generally leads to an underestimate of the equivalent width and a corresponding overestimate of the fraction of galaxies with absorption-line spectra only. The bias depends on the morphological type of the galaxy; the larger the bulge to disk ratio, the more serious the potential bias under the assumption that the emission lines originate primarily in the disk.
We collect nearly all of the nuclear light, but the fraction of light beyond that depends on the redshift, intrinsic size, position angle, and surface brightness of the galaxy. The slit has a physical size of 2.2 kpc by 132 kpc (maximum) at the survey median redshift .
We use the digitized Palomar (POSS) images of the 15R galaxies to estimate the slit covering fraction for the emission-line galaxies. We measure the ratio of the photographic flux within the slit aperture (centered on the nucleus) to the total photographic flux. We do not correct for the photographic nonlinearity inherent in the POSS images. Figure 5 shows that most of the 15R-north spectra contain 15—25% of the total flux of the galaxy; for the nearest galaxies this fraction can be as small as 2%. The uncertainty in these corrections is 10% of the correction.
For emission-line galaxies (see 3.1 for the quantitative discriminant we use to distinguish emission-line and absorption-line galaxies), Figure 6 shows the EW(H) as a function of slit covering fraction. There is no trend of EW(H) with slit covering fraction for galaxies either brighter than or fainter than L∗.
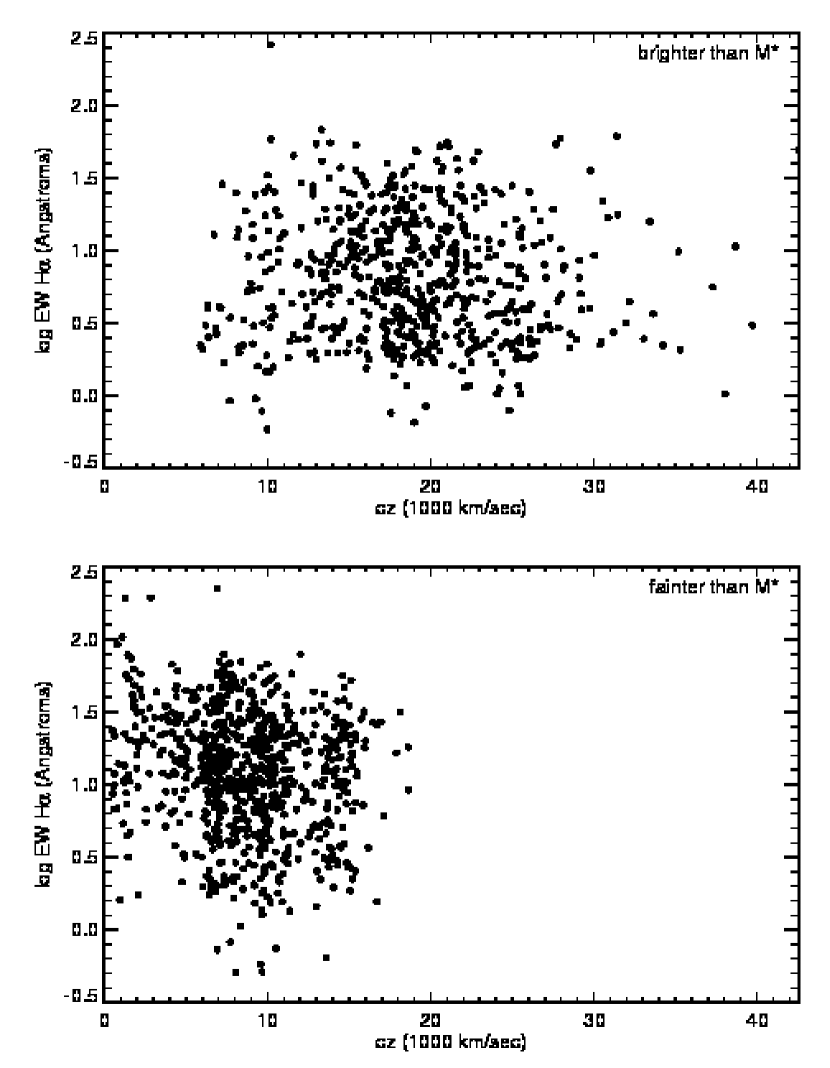
Figure 7 shows the EW(H) as a function of for intrinsically bright and faint galaxies. For galaxies with , there is no trend of EW(H) with ; for galaxies with , there is a decline in EW(H) with . The latter dependence is opposite to the bias discussed by Kochanek, Pahre, & Falco (2001); it occurs because actively star-forming dwarf irregulars are within the survey limiting magnitude only at very low redshift. We conclude that the slit covering fraction does not introduce any substantial bias in our evaluation of emission line equivalent widths.
3 Spectral Classification and Star Formation
To study star formation and to examine the dependence of spectral type on the local environment, we classify the spectral type of the 15R galaxies. We use ratios of strong emission lines (H, [N ii] 6583, [O iii] 5007, and H) to separate star-forming galaxies from galaxies containing a strong AGN. Because the 15R spectra include both H and [O ii] 3727, we can also assess [O ii] as a measure of the star formation rate.
3.1 Spectral Classification
We use emission line indices (see Table 1) to measure the emission line equivalent widths. We first separate the spectra into two broad categories, emission and absorption. Plate 1 shows that roughly half of the spectra have detectable emission lines. We classify a galaxy as an emission-line galaxy if we detect one or more emission lines (Table 1) at . If no single emission line meets this criterion, we still classify the spectrum as an emission-line spectrum if the emission detections add in quadrature to at least . 1538 of the 3149 15R galaxies have emission-line spectra. We classify the remaining spectra as absorption spectra; stellar absorption lines are, in fact, present in all of the spectra (Plate 1).
Figure 8 shows the distribution of the EW(H) for the entire sample. The median uncertainty for an individual equivalent width is 0.5Å. The 49% of 15R galaxies with emission-line spectra is less than the 61% with EW(H) 2Å detected in the selected Stromlo-APM Survey (Tresse et al., 1999). The greater detection rate of emission line galaxies in the Stromlo-APM survey probably results from their rather than selection. Their wider slit, which collects a larger fraction of the disk light, may also contribute somewhat to this difference.
The modest S/N of the 15R spectra complicates the classification of the absorption-line galaxies and we defer that to a later work. We classify the emission-line galaxies according to the line-ratio scheme described by Baldwin, Phillips, & Terlevich (1981) and Veilleux & Osterbrock (1987) (VO hereafter). For this classification, we use line fluxes measured from the flux-calibrated spectra, and we correct for 1.54 Å in equivalent width of stellar Balmer absorption at H, based on high S/N measurements from a smaller but statistically similar sample (R. Jansen 1999, private communication).
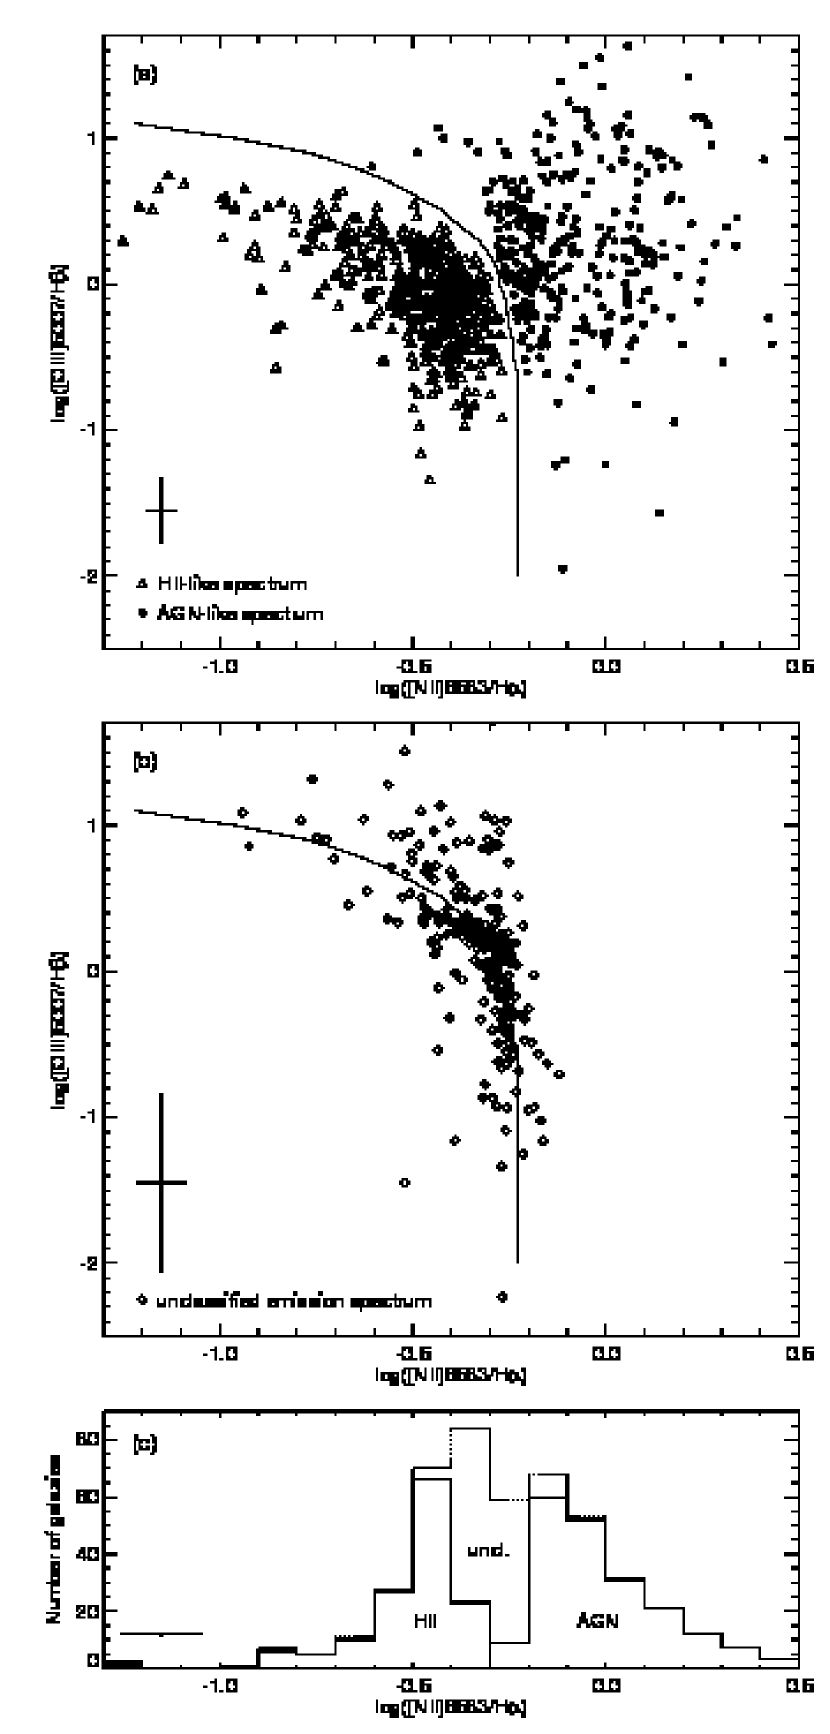
Figure 9 (a & b) plots the line flux ratios of [O iii] 5007Å / H and [N ii] 6583Å / H. The plots also show the empirical relation derived by VO to separate AGNs from normal star-forming galaxies. The 15R galaxies do not divide cleanly into two separate populations. Higher S/N spectra would obviously determine how much our measurement errors contribute to this blur between AGN and star-forming galaxies. The hybrid spectra (Figure 9(b)) may result from both observational and astrophysical sources. On the observational side, our longslit spectra blend nuclear and disk light. Extraction of nuclear spectra, a task beyond the scope of this paper, could clarify this issue. From the broad astrophysical perspective, many groups have examined the AGN-starburst connection (Kewley, et al., 2000; Lei et al., 2000; Coziol, Iovino, & de Carvalho, 2000, e.g.,). Weedman (1983) and Norman & Scoville (1988) suggest that nuclear starbursts may lead to the formation of a massive central black hole, and, conversely, the presence of an AGN in a galaxy may trigger a burst of star formation (Rees, 1989; Daly, 1990). Donzelli & Pastoriza (2000) examine a set of merging galaxy pairs and find that some galaxies host a low-luminosity AGN surrounded by strong star-forming regions. Evaluation of the frequency of a true hybrid AGN-starburst population in the 15R survey requires a more sophisticated analysis of the data than that discussed here.
In some cases, we do not detect the four emission lines required by the VO classification scheme in the 15R spectra. When at least H and [N ii] 6583Å are present, we use the ratio of these two lines for the classification. If ([N ii]6583/H) we classify the galaxy as star forming (H ii-like); otherwise we classify it as an AGN. Figure 9(c) shows histograms of the galaxies classified using only the H and [N ii] 6583Å emission lines.
The error bars for many of the emission line ratios (both those with all 4 lines and those using only [N ii]6583/H) often overlap the VO dividing line. We classify each emission-line galaxy according to the area covered by its error ellipse. We assign the “H ii” designation to each galaxy with less than 10% of its error ellipse on the AGN side, and “AGN” to galaxies with less than 10% on the H ii side. Galaxies overlapping the VO line by 10 to 90% remain unclassified; these constitute 25% of the emission-line galaxies. Synthetic rest-frame colors confirm the classification of H ii-like and AGN-like spectra. As expected, the H ii-like spectra tend to be bluer than the AGN-like spectra. The unclassified spectra tend to be closer in color to the AGN-type spectra. Figures 10 and 11 show examples of absorption-line, AGN, star forming, and unclassified emission-line spectra.
Table 2 lists the numbers of each spectral type in the 15R sample. We classify 17% of the total sample as AGN; given the unclassified emission-line spectra this fraction is a lower limit. Our AGN fraction is much larger than the 1% of galaxies classified as AGNs in the Las Campanas Redshift Survey (LCRS). Because the LCRS spectra do not usually include H, their classifications are based on the equivalent widths of [O ii] 3727Å, [O iii] 5007Å, H 4861Å, and [Ne v] 3425Å (Hashimoto, Oemler, Lin, & Tucker, 1998). The LCRS procedure is less reliable than the VO technique we use. We conclude that a significant number of low-luminosity AGNs are probably classified as star-forming galaxies in the LCRS.
Figure 12 shows the relative fractions of the galaxy spectral types as a function of absolute magnitude. The absorption-line fraction declines steeply with decreasing luminosity, and the emission line fraction increases. AGNs are more abundant among more luminous galaxies. The absorption-line galaxies are significantly more luminous than the star-forming galaxies. The median of the absorption-line, AGN, unclassified emission-line, and star forming galaxies are: -21.1, -21.1, -20.7, and -20.1, respectively.
3.2 The Spatial Distribution of Different Spectral Types
Figures 13 and 14 show the distribution of galaxies of the various spectral types in redshift space. As in other surveys, the absorption-line galaxies are more strongly clustered than the emission-line systems, and are particularly abundant in the Coma cluster. The AGNs and unclassified emission-line galaxies trace the overall large-scale structure. A number of H ii galaxies appear in the infall region around the Coma cluster. However, they are generally absent from the central “fingers” which define the virialized central regions of rich clusters. In Section 4.2 we return to this issue and compute the abundance of each spectral type as a function of local density; overall the relative fraction of H ii galaxies drops substantially in the densest regions.
3.3 H + [N II] and the Stellar Birthrate
Kennicutt, Tamblyn, & Congdon (1994) describe several techniques for estimating the Scalo stellar birthrate parameter , defined as the ratio of the current star formation rate (SFR) to the time averaged SFR:
where is the stellar mass, is the age of the stellar population, and is the fraction of mass in each stellar generation that is not tied up in stars (Tinsley, 1980). The current star formation rate can be determined directly from the H luminosity, and the stellar mass can be estimated from the lumosity and mass-to-light ratio. Kennicutt, Tamblyn, & Congdon (1994) (hereafter KTC94) adopt =0.4, based on stellar evolution models, and take Gyr. For their sample of 210 galaxies, they compare this relatively direct estimate of the birthrate parameter to two others based on the EW(H + [N ii]) or colors predicted by their stellar evolution and spectral synthesis models. The estimated from the EW(H + [N ii]) agrees well with the more direct technique, but the estimate from the color has very large scatter. We therefore use the calibration (exponential + burst model) from Figure 3 of KTC94 to convert our EW(H + [N ii]) measurements to an estimate of . KTC94 derive their estimates of from integrated spectra. The absence of a dependence of EW(H) on the slit covering fraction (Figure 6, Section 2.5) indicates that our long-slit spectra should introduce only small differences in the estimated .
The stellar birthrate in KTC94 is greater on average for later morphological types which have a lower average luminosity. In Figure 15 we plot the EW(H + [N ii]) histograms for the complete sample of 641 star forming galaxies. We also show the histograms for three 100 galaxy subsamples selected by luminosity: the 100 most luminous galaxies, 100 galaxies with luminosities near M∗, and the 100 least luminous galaxies, respectively. In Figure 15, vertical dotted lines mark the approximate stellar birthrates from the KTC94 calibration. In agreement with KTC94, the median birthrate parameter is inversely correlated with luminosity, increasing from 0.7 in the highest luminosity subsample to 1.1 in the lowest luminosity subsample.
The largest birthrates in the KTC94 sample of 210 “normal” galaxies are for 6 galaxies with . Galaxies with are undergoing unusually vigorous star formation. KTC94 probably exclude most of these galaxies from their sample by eliminating peculiar and starburst galaxies. In our complete sample of 641 star-forming galaxies in 15R, 33 (5%) have . Table 3 lists these objects. The samples are small, but the fraction of galaxies with also appears to be inversely correlated with luminosity.
3.4 Using [O II] to Estimate Star Formation
Of the optical emission lines H provides the most direct measure of the star formation rate in a galaxy, but at intermediate redshifts H is outside of the optical bandpass. The strong [O ii] 3727Å doublet is often a substitute measure of star formation. Gallagher, Bushouse, & Hunter (1989) and Kennicutt (1992) show that the line strengths of [O ii] 3727Å and H are correlated. Tresse et al. (1999) recently confirmed the correlation of EW([O ii]) and EW(H); EW([O ii]) 0.7 EW(H). The Tresse et al. (1999) relation fits our data well (Figure 16). We plot log(EW([O ii])) vs. log(EW(H)) for the 244 star forming galaxies where we detect the [O ii] emission line at a confidence .
Recently, Jansen, Franx, & Fabricant (2001) showed that the [O ii]/H ratio correlates with luminosity. This correlation arises from reddening as well as from the metallicity dependent excitation of the interstellar medium. They find a slope of 0.043 dex mag-1 for the relation log(EW [O ii]/H) vs. MB. Our data yield a very similar slope of 0.054 dex mag-1 for the same relation vs. MR. A Spearman rank test shows that the correlation in our sample is highly significant; the null hypothesis (no correlation) has a probability of only 10-8. Figure 17 plots our log(EW [O ii]/H) vs. MR data along with the best fit linear relation. We confirm that the EW([O ii]) should be used with caution as a measure of star formation (Jansen, Franx, & Fabricant, 2001).
4 The Spectral Type – Density Relation
4.1 The Density Estimator
In analogy with the morphology-density relation (Dressler, 1980; Postman & Geller, 1984) we measure the spectral-type density relation. The method outlined here for measuring the density surrounding each galaxy is similar to the one used by Hashimoto, Oemler, Lin, & Tucker (1998) and Postman & Geller (1984). We determine the density from the nearest neighbors of a galaxy in redshift space (including the galaxy in question):
where is the estimated number of galaxies contained in the volume , with . We scale the number of galaxies in the volume by a weighting function which accounts for the galaxies absent from the magnitude-limited survey:
where is the faintest absolute magnitude detectable at object (eq. [1]). Because we calibrate the 15R Survey photometry with the Century Survey (CS), we use the CS luminosity function , with Schechter function parameters Mpc-3, , and (Geller et al., 1997).
For the 15R galaxies, the weighting function is at and at . We impose an upper survey limit of to avoid very large weights and a lower limit of . The median radius of the regions used to calculate densities is 5 Mpc, with a total range of 1—20 Mpc.
We use the Euclidean law of cosines to estimate the distance between two galaxies. Any errors introduced from this simplified relation are small compared with the uncertainty in galaxy positions due to unknown peculiar velocities. Because the virialized central regions of systems of galaxies are extended along the line-of-sight in redshift space, our prescription underestimates the density in these regions. At intermediate densities, our prescription may overestimate the density somewhat because of infall. We estimate , the distance between galaxies and , from the observed angular separation and the luminosity distances to galaxies and :
Typical separations between adjacent neighbors are a few Mpc.
If galaxy is sufficiently far from the survey boundaries, the volume containing its nearest neighbors is simply a sphere centered at with radius , the distance from galaxy to its -th nearest neighbor in the survey. In general, however, the volume is the intersection of this sphere with the volume contained by the boundaries of the 15R Survey. We therefore determine this volume numerically for each galaxy. Again, we simplify the calculations by assuming flat Euclidean space within the volume .
The uncertainty in . Uncertainty in the average number density of galaxies in the local universe contributes some constant offset to the value of ; thus, care must be taken when comparing number density measurements between different surveys. We neglect the overall survey completeness because it is, in effect, another normalization contributing a constant offset to . The small variations in survey completeness in different regions introduce errors less than the uncertainty in .
Our density estimation technique avoids a number of pitfalls. A “smoothed” density estimator requires careful management of the sample boundaries, and imposing an “average” or “grey” density for the region outside the boundaries. Measuring the number of galaxies within a fixed volume around each galaxy would underestimate the density of compact clusters and overestimate the density in a void. Scaling the volume by the local density is effectively equivalent to the technique we adopt.
4.2 Spectral Types and Density
Figure 18 shows that, as expected, star-forming (H ii-like) galaxies dominate at the lowest densities; absorption line galaxies dominate at intermediate and high densities. A test rejects the hypothesis of a fraction independent of density at 99.9991% confidence for star-forming galaxies and 99.9914% confidence for absorption line galaxies. The fractions of unclassified emission-line galaxies and AGNs do not vary dramatically with density. A test shows that the hypothesis of a constant fraction with density is acceptable for AGNs, and can be rejected at 99.6% confidence (2.9) for the unclassified emission line galaxies.
Based on a smaller sample of 106 AGNs with km s-1, Monaco et al. (1994) assessed the large-scale distribution of these objects. The region they explore is dominated by the Local Supercluster making comparison with our larger survey difficult. A qualitatively similar conclusion of their survey and ours is that, unlike star-forming galaxies, AGNs do occur frequently in dense regions of the universe. The physical processes which suppress star formation in these regions are thus ineffective in suppressing AGNs. Our larger, deeper survey enables exploration of the AGN fraction over the full range of galaxy densities.
4.3 Star Formation and Density
We now examine whether the properties of the 641 star forming galaxies depend on environment. Specifically we ask whether the Scalo birthrate parameter, , depends on density. For consistency with other studies, we use EW(H) instead of EW(H + [N ii]); our data show that the two are tightly correlated. Figure 19 shows the distribution of EW(H) as a function of galaxy density for the star forming galaxies. There is only a very weak correlation in this plot: at high densities the EW(H) is smaller. The Spearman rank test shows that the null hypothesis of no correlation can be rejected at only 98.4% confidence (2.4). The scatter, which is significantly larger than the slight trend, is nearly constant at all densities.
The weak correlation and roughly constant scatter of EW(H) with densities averaged over a scale of 5 Mpc may be related to the dependence of EW(H) on spatial and velocity separation in close pairs. Barton, Geller, & Kenyon (2000) argue that the observed dependence is a consequence of tidally-triggered star formation. They show that in a large sample of close pairs objectively selected from a redshift survey, the EW(H) declines with projected separation and with line-of-sight velocity difference. The decline is very steep; the maximum EW(H) drops from more than 150 Å at a projected separation of 5 kpc to 50 Å at 40 kpc. Extrapolation of this result suggests that at the large smoothing scales we explore here, there should be little dependence of the EW(H) on density.
The correlation of EW(H) with density we do observe is in the same sense but much weaker than the correlation of EW([O ii]) with density in the Las Campanas Redshift Survey. Hashimoto, Oemler, Lin, & Tucker (1998) argue that the ratio of the numbers of galaxies with EW([O ii]) 20 Å to those with 5Å EW([O ii]) 20Å declines by a factor of two as the density increases by three orders of magnitude. Three factors may contribute to the different LCRS result: (1) less uniform selection in the LCRS excluding low surface brightness galaxies which often have strong emission lines, (2) the problems of [O ii] as a star formation indicator (3.4), and (3) aperture bias introduced by the 3.5′′ diameter LCRS fiber (Kochanek, Pahre, & Falco, 2001). The aperture bias steepens the correlation between EW(H) and surrounding galaxy density through the morphology density relation. In denser regions, the median bulge-to-disc ratio of galaxies is larger. Thus, with a small aperture, underestimation of the EW(H) is a progressively more serious bias in denser regions. This bias results in an apparently larger change in median EW(H) with density than is actually present.
Loveday, Tresse, & Maddox (1999) use the Stromlo-APM survey to examine the relationship between EW(H) and galaxy density using correlation function techniques. In contrast with the LCRS, the Stromlo-APM data are long-slit spectra. Their typical slit covering fraction is 0.45, about twice our typical coverage. Loveday, Tresse, & Maddox (1999) study the redshift-space autocorrelation functions of galaxies in three bins of EW(H): (1) 2Å, (2) 2—15Å, and (3) 15Å. Galaxies with the smallest EW(H) have a significantly larger correlation length, 8.70.5 Mpc, than the galaxies with stronger emission, which have correlation lengths of 5.50.7 Mpc and 4.60.9 Mpc, respectively. We classify most galaxies with EW(H) 2Å as absorption line galaxies, and we have shown in 4.2 that these dominate at the highest densities. Loveday, Tresse, & Maddox (1999) find no significant difference in the redshift-space autocorrelation length for their two groups of emission line galaxies, in qualitative agreement with our Figure 19. We conclude that for emission-line galaxies, the dependence of EW(H) on local galaxy density in redshift space is weak and the the strong dependence claimed in the LCRS is a probable result of aperture bias.
5 Conclusion
15R-North is a red-selected, magnitude-limited sample of galaxies at low redshift (). With uniform optical spectra for 90% of the 15R-North galaxies, we have a complete spectroscopic census of the local universe: 51% of the galaxies have absorption-line spectra and 49% have emission. At least 20% are H ii-like and 17% have AGN-like spectra. If all of the unclassified emission-line spectra (the remaining 12% of the sample) were AGN spectra, AGNs would make up 28% of the galaxies in our sample, probably consistent with the 43% identified by Ho, Filippenko, & Sargent (1997) in their blue-selected survey. Because Ho, Filippenko, & Sargent (1997) base their conclusions on high S/N nuclear spectra and ours typically cover a much larger fraction of the galaxy (diluting the AGN contribution), Ho, Filippenko, & Sargent (1997) should estimate a larger AGN fraction than we do. The consistently large AGN fraction may complicate evaluation of the star formation rate at zero redshift.
AGN and star-formation activity have a different dependence on the surrounding galaxy number density (averaged over a several Mpc scale). The AGN fraction is independent of local density; the star-forming fraction decreases steeply as the galaxy density increases. The unclassifiable galaxies have a negligible effect on these results; their fraction decreases slowly as the density increases. AGNs are more abundant among the more luminous galaxies in the survey; star-forming galaxies are more abundant in low-luminosity systems. These trends may be useful in unraveling the AGN-starburst connection.
Perhaps the most surprising result of analysis of the 15R data is the very shallow dependence of the EW(H) in star-forming galaxies on the surrounding density in redshift space. This result is actually similar to the conclusions drawn by Loveday, Tresse, & Maddox (1999) from their longslit spectroscopy in the Stromlo-APM survey. We suggest that this shallow dependence implies that processes occurring on much smaller scales (e.g. tidal triggering) determine the EW(H).
Examination of the relative distributions of absorption- and emission-line galaxies recovers the result obtained by others: absorption-line galaxies are more abundant in dense regions and emission-line galaxies are more abundant at low densities. Thus the gross distinction in spectroscopic properties is sensitive to the larger environment. This relation is, at least in part, a consequence of the well-known morphology-density relation. Elliptical and S0 galaxies, which usually have absorption-line spectra, inhabit the densest regions of the universe.
Acknowledgements.
G. Bothun made extensive comments on an early draft of this paper, and we thank him for his suggestions which enormously strengthened the paper. We thank N. Kashikawa for allowing us to use his Coma Cluster photometry in advance of publication. We also thank R. Kron for several valuable suggestions. We are grateful to P. Berlind for making many of the FAST observations and S. Tokarz for the pipeline reductions. B. C. was supported by a Predoctoral Fellowship from the Smithsonian Astrophysical Observatory. The POSS data were based on photographic data of the National Geographic Society—Palomar Geographic Society to the California Institute of Technology. The plates were processed into the present compressed digital form with their permission. The Digitized Sky Survey was produced at the Space Telescope Science Institute under US Government grant NAG W-2166.References
- Baldwin, Phillips, & Terlevich (1981) Baldwin, J. A., Phillips, M. M. & Terlevich, R. 1981, PASP, 93, 5 1991, ApJ, 370L, 65
- Barton, Geller, & Kenyon (2000) Barton, E. J., Geller, M. J., Kenyon, S. J. 2000, ApJ, 530, 660
- Bessell (1990) Bessell, M. S. 1990, PASP, 102, 1181
- Bessell (1995) Bessell, M. S. 1995, PASP, 107, 672
- Blanton et al. (2001) Blanton, M. R. & the SDSS Collaboration 2001, astro-ph 0012085
- Bohlin, Savage, & Drake (1978) Bohlin, R. C., Savage, B. D., & Drake, J. F. 1978, ApJ, 224, 132
- Bothun et al. (1989) Bothun, G., Schmitz, M., Halpern, J., Lonsdale, C., Impey, C. 1989, ApJS, 70, 271
- Bromley et al. (1998) Bromley, B.C., Press, W. H., Lin, H., Kirshner, R. P. 1998, ApJ, 505, 25
- Burstein & Heiles (1982) Burstein, D., & Heiles, C. 1982, AJ, 87, 1165
- Cousins (1980) Cousins, A. W. J. 1980, Monthly Notes of the Astronomical Society of South Africa, 39, 22
- Coziol, Iovino, & de Carvalho (2000) Coziol, R., Iovino, A., & de Carvalho, R. R. 2000, AJ, 120, 47
- Daly (1990) Daly, R. A. 1990, ApJ, 355, 416
- Donzelli & Pastoriza (2000) Donzelli, C. J. & Pastoriza, M. G. 2000, AJ, 120, 189
- Dressler (1980) Dressler, A. 1980, ApJ, 236, 351 Gunn, J. E., Schneider, D. P. 1985, ApJ, 294, 70
- Folkes et al. (1999) Folkes, S. & 2DF Collaboration 1999, MNRAS, 308, 459
- Frei & Gunn (1994) Frei, Z. & Gunn, J. E. 1994, AJ, 108, 1476
- Gallagher, Bushouse, & Hunter (1989) Gallagher, J. S., Bushouse, H., & Hunter, D. A. 1989, AJ, 97, 700
- Geller et al. (1997) Geller, M. J., et al. 1997, AJ, 114, 2205
- Geller et al. (2001) Geller, M. J., et al. 2001, in preparation
- Hashimoto, Oemler, Lin, & Tucker (1998) Hashimoto, Y., Oemler, A., Lin, H., & Tucker, D. L. 1998, ApJ, 499, 589
- Ho, Filippenko, & Sargent (1997) Ho, L. C., Filippenko, A. V., & Sargent, W. L. W. 1997, ApJS, 112, 315
- Huchra & Burg (1992) Huchra, J. & Burg, R. 1992, ApJ, 393, 90
- Iovino et al. (1993) Iovino, A., Giovanelli, R., Haynes, M. P., Chincarini, G., Guzzo, L., 1993, MNRAS, 265, 21
- Jansen, Franx, & Fabricant (2001) Jansen, R., Franx, M., & Fabricant, D. 2001, ApJ, in press.
- Kashikawa et al. (1995) Kashikawa, N., Shimasaku, K., Yagi, M., Yasuda, N., Doi, M., Okamura, S., & Sekiguchi, M. 1995, ApJ, 452L, 99
- Kashikawa et al. (1998) Kashikawa, N., Sekiguchi, M., Doi, M., Komiyama, Y., Okamura, S., Shimasaku, K., Yagi, M., & Yasuda, N. 1998, ApJ, 500, 750
- Kennicutt (1992) Kennicutt, R. C. 1992, ApJ, 388, 310
- Kennicutt, Tamblyn, & Congdon (1994) Kennicutt, R. C., Tamblyn, P., & Congdon, C. 1994, ApJ, 435, 22
- Kent, Ramella, & Nonino (1993) Kent, S. M., Ramella, M., & Nonino, M. 1993, AJ, 105, 393
- Kochanek, Pahre, & Falco (2001) Kochanek, C. S., Pahre, M. A., & Falco, E. E. 2000, astroph/0011458
- Kurtz & Mink (1998) Kurtz, M. J. & Mink, D. J. 1998, PASP, 110, 934
- Kewley, et al. (2000) Kewley, L. J., Heisler, C. A., Dopita, M. A., Sutherland, R., Norris, R. P., Reynolds, J., Lumsden, S. 2000, ApJ, 530, 704
- Lei et al. (2000) Lei, S. J., Huang, J. H., Zheng, W., Ji, L., & Gu, Q. S. 2000, ApJ, 544 L31
- Lin et al. (1996a) Lin, H., Kirshner, R. P., Shectman, S. A., Landy, S. D., Oemler, A., Tucker, D. L. & Schechter, P. L., 1996a, ApJ, 464, 60
- Lin et al. (1996b) Lin, H., Kirshner, R. P., Shectman, S. A., Landy, S. D., Oemler, A., Tucker, D. L. & Schechter, P. L., 1996b, ApJ, 471, 617
- Loveday, Tresse, & Maddox (1999) Loveday, J., Tresse, L., & Maddox, S. 1999, MNRAS, 310, 281
- Massey et al. (1988) Massey, P., Strobel, K., Barnes, J. V., & Anderson, E. 1988, ApJ, 328, 315
- McLean et al. (1998) McLean, B., Hawkins, C., Spagna, A., Lattanzi, M., Lasker, B., Jenkner, H., White, R. 1998, in IAU Symp. 179, New Horizons from Multi-Wavelength Sky Surveys, ed. B. J. McLean, D. A. Golombek, J. J. E. Hayes, & H. E. Payne (New York: Kluwer), 431
- Monaco et al. (1994) Monaco, P., Guiricin, G., Mardirossian, F. & Mezzetti, M. 1994, ApJ, 436, 576
- Norman & Scoville (1988) Norman, C. & Scoville, N. 1988, ApJ, 332, 124
- Poggianti (1997) Poggianti, B. 1997, A&AS, 122, 399
- Postman & Geller (1984) Postman, M. & Geller, M. J. 1984, ApJ, 281, 95
- Ramella et al. (1995) Ramella, M., Nonino, M., Geller, M., & Kent, S. 1995, Mem. Soc. Astron. Ital., 66, 113
- Rees (1989) Rees, M. J. 1989, MNRAS, 239, 1
- Rosenberg, Salzer, & Moody (1994) Rosenberg, J. L., Salzer, J. J., & Moody, J. W., 1994, AJ, 108, 1557
- Salzer (1989) Salzer, J. 1989, ApJ, 347, 152
- Savage & Mathis (1979) Savage, B. D. & Mathis, J. S. 1979, ARA&A, 17, 73
- Tinsley (1980) Tinsley, B. M., 1980, Fund. Cos. Phys., 5, 287
- Tresse et al. (1999) Tresse, L., Maddox, S., Loveday, J., & Singleton, C. 1999, MNRAS, 310, 262
- Veilleux & Osterbrock (1987) Veilleux, S., & Osterbrock, D. E. 1987, ApJS, 63, 295
- Weedman (1983) Weedman, D. W., 1983, ApJ, 266, 479
- Winkler (1997) Winkler, H. 1997, MNRAS, 287, 481
- Zucca et al. (1997) Zucca, E. et al., 1997, A&A, 326, 477
- Zwicky, Herzog, & Wild (1961—1968) Zwicky, F., Herzog, E., & Wild, P. 1961—1968, Catalogue of galaxies and of clusters of galaxies (Pasadena: California Institute of Technology)


| Index | Blue Continuum | Line Region | Red Continuum | |
|---|---|---|---|---|
| (Å) | (Å) | (Å) | ||
| [O ii] | 3727.3Å | 3653.0—3716.3 | 3716.3—3738.3 | 3738.3—3803.0 |
| H | 4861.3Å | 4761.3—4841.3 | 4841.3—4881.3 | 4881.3—4961.3 |
| [O iii] | 5006.8Å | 4891—4945 | 4995—5019 | 5021—5087 |
| [N ii] | 6548.1Å | 6505—6535 | 6538.1—6558.1 | 6597—6627 |
| H | 6562.8Å | 6505—6535 | 6554.5—6574.5 | 6597—6627 |
| [N ii] | 6583.4Å | 6505—6535 | 6573.4—6593.4 | 6597—6627 |
| Number | Type |
|---|---|
| 641 | H ii-type emission |
| 522 | AGN-type emission |
| 375 | unclassified emission |
| 1611 | absorption-line spectra |
| 3149 | total galaxies |
| RA (1950) | Dec (1950) | EW(H) | ||
|---|---|---|---|---|
| (hh:mm:ss) | (deg:mm:ss) | (km/s) | (Å) | |
| 13:28:21.4 | 31:32:27.2 N | 18.8 | 10198 | 262.5 |
| 11:54:54.0 | 31:21:43.6 | 11.2 | 6916 | 223.7 |
| 14:52:07.7 | 30:24:09.4 | 10.1 | 2859 | 196.4 |
| 14:52:04.8 | 30:24:40.3 | 9.6 | 2833 | 193.2 |
| 14:55:28.6 | 26:51:51.8 | 8.7 | 1267 | 193.1 |
| 9:47:26.4 | 31:43:18.1 | 7.4 | 524 | 167.5 |
| 12:35:12.8 | 27:24:13.3 | 6.7 | 4593 | 128.8 |
| 16:33:43.2 | 27:35:17.5 | 5.1 | 14881 | 93.4 |
| 12:42:49.7 | 27:23:54.6 | 4.9 | 1094 | 104.2 |
| 10:43:04.8 | 27:52:58.4 | 4.6 | 13311 | 68.2 |
| 14:22:07.3 | 31:38:24.7 W | 4.5 | 12026 | 79.1 |
| 12:44:28.3 | 26:50:13.6 | 4.4 | 800 | 92.1 |
| 12:13:23.5 | 26:56:23.3 | 4.2 | 7627 | 85.0 |
| 8:59:42.3 | 31:28:18.1 | 4.1 | 4141 | 67.3 |
| 13:24:29.9 | 26:51:01.1 W | 4.1 | 7013 | 70.6 |
| 13:35:57.5 | 28:01:30.7 | 3.7 | 9996 | 67.6 |
| 13:17:27.6 | 31:05:15.4 | 3.7 | 7299 | 79.3 |
| 13:28:21.4 | 31:32:27.2 S | 3.7 | 10187 | 58.6 |
| 16:33:43.2 | 27:35:17.5 E | 3.7 | 14742 | 68.2 |
| 8:32:28.4 | 30:42:27.0 | 3.5 | 7693 | 68.3 |
| 11:45:13.3 | 31:37:21.7 | 3.4 | 8356 | 70.2 |
| 11:20:26.9 | 30:45:11.2 | 3.4 | 1664 | 73.9 |
| 9:39:56.9 | 32:04:34.0 | 3.4 | 1331 | 57.0 |
| 14:35:42.4 | 30:41:42.4 | 3.4 | 10396 | 56.0 |
| 13:13:28.2 | 26:49:10.2 | 3.3 | 11484 | 58.2 |
| 11:06:56.2 | 27:11:31.6 | 3.3 | 21091 | 52.4 |
| 12:17:05.3 | 32:28:40.8 | 3.3 | 31400 | 61.2 |
| 12:56:10.3 | 27:32:03.1 | 3.3 | 7344 | 65.5 |
| 11:02:55.3 | 31:06:09.0 | 3.2 | 10205 | 54.2 |
| 9:02:01.2 | 28:32:48.8 | 3.1 | 14564 | 56.4 |
| 14:46:00.8 | 27:34:41.2 | 3.1 | 15440 | 53.2 |
| 9:47:17.9 | 28:14:49.2 | 3.1 | 1450 | 77.9 |
| 9:27:31.3 | 27:59:44.5 | 3.0 | 12992 | 54.4 |