Probing for Dark Matter within Spiral Galaxy Disks
Abstract
We explore the relative importance of the stellar mass density as compared to the inner dark halo, using the observed gas kinematics throughout the disk of the spiral galaxy NGC 4254 (Messier 99). We perform hydrodynamical simulations of the gas flow for a sequence of gravitational potentials in which we vary the stellar disk contribution to the total potential. This stellar portion of the potential was derived empirically from color corrected K-band photometry reflecting the spiral arms in the stellar mass, while the halo was modelled as an isothermal sphere. The simulated gas density and the gas velocity field are then compared to the observed stellar spiral arm morphology and to the H gas kinematics. We find that this method is a powerful tool to determine the corotation radius of the spiral pattern and that it can be used to place an upper limit on the mass of the stellar disk. For the case of the galaxy NGC 4254 we find , or (K’). We also demonstrate that for a maximal disk the prominent spiral arms of the stellar component over-predict the non-circular gas motions unless an axisymmetric dark halo component contributes significantly () to the total potential inside 2.2 K-band exponential disk scale lengths.
1 INTRODUCTION
In almost all galaxy formation scenarios non-baryonic dark matter plays an important role. Today’s numerical simulations of cosmological structure evolution reproduce fairly well the observed distribution of galaxy properties in the universe (e.g. Kauffmann et al., 1999) and attempts to model the formation of single galaxies have been made as well (Steinmetz and Müller, 1995). In these simulations the baryonic matter cools and settles in the center of dark halos where it forms stars. The distribution of stars and gas in a galaxy depends strongly on the local star formation and merging history. At the same time that the stars are forming the halos evolve and merge as well.
The final relative distribution of luminous and dark matter in the centers of the resulting galaxies is under debate because the mass distribution of the dark matter component is difficult to assess directly. Measuring luminous and dark matter mass profiles separately requires innovative strategies because the halo is poorly constrained and equally good fits to measured rotation curves can be achieved for a wide range of visible mass components (Broeils and Courteau, 1997). In order to define a unique solution to this so called ’disk-halo degeneracy’, the ’maximal disk’ solution was introduced. It assumes the highest possible mass-to-light ratio (M/L) for the stellar disk (van Albada et al., 1985, 1986). A practical definition is given by Sackett (1997) who attributes the term ’maximal’ to a stellar disk if it accounts for 85% 10% of the total rotational support of the galaxy at R = 2.2 Rexp. This approach has proven to be very successful in matching observed H I and H rotation curves (van Albada et al., 1985; Kent, 1986; Broeils and Courteau, 1997; Salucci and Persic, 1999) and also satisfies some dynamical constraints, such as the criteria of forming spirals (Athanassoula et al., 1987) as well as observational constraints on the structure of the Milky Way (Sackett, 1997). However, modern numerical N-body simulations find significant central dark matter density cusps (Fukushige and Makino, 1997; Moore et al., 1999). Even if the prediction of these strong density cusps may not be entirely correct, the simulations find that the dark matter is of comparable importance in the inner parts of galaxies (Blumenthal et al., 1986; Moore, 1994; Navarro et al., 1996, 1997) and it thus has a considerable influence on the kinematics. In this case a stellar disk of a galaxy would turn out to be ’sub-maximal’.
It is important to determine the relative proportion of dark and luminous matter in galaxies for a better understanding of the importance of the baryonic mass in the universe. This proportion also bears information on the dynamics and structure of the dark matter itself. Spiral galaxies are well suited to study dark matter distributions because their distinctly ordered kinematics provide an excellent tracer of the gravitational potential in the disk plane. Since bars in galaxies are very prominent features with distinct dynamic characteristics, they are especially well suited to evaluate the amount of luminous matter. Sophisticated studies of barred galaxies indicate that their stellar disks alone dominate the kinematics of the inner regions – the stellar contribution is ’maximal’ (Debattista and Sellwood, 1998, 2000; Weiner et al., 2001b). However, studies of our own Milky Way, maybe also a barred spiral, still do not give a clear answer as to whether the disk is maximal (Sackett, 1997; Englmaier and Gerhard, 1999) or not (Kuijken, 1995; Dehnen and Binney, 1998). Bottema’s analysis of the stellar velocity dispersion in various galactic disks led to the conclusion that disks cannot comprise most of the mass inside the radial range of a few exponential scale lengths (Bottema, 1997). Aside from the dynamical analysis of single systems, other attempts to tackle this problem have been undertaken. Maller et al. (2000) used the geometry of gravitational lens systems to probe the potential of a lensing galaxy. They concluded that a maximum disk solution is highly unlikely. Courteau and Rix (1999) applied statistical methods to learn about the mass distribution in galaxies. In their analysis they found no dependence of the maximum rotation velocity on a galaxy’s disk size. This is considered to be a strong argument to rule out a maximum disk solution. The conflicting findings of different studies leave the question of the relative proportion of dark and luminous matter in galaxies still open.
In this paper we want to exploit the fact that the stellar mass in disk galaxies is often organized in spiral arms, thus in kinematically cold non-axisymmetric structures. In the canonical CDM cosmology the dark matter is collision-less and dominated by random motions. Although the introduction of weakly self-interacting dark matter was proposed to avoid current shortcomings of the CDM model (Spergel and Steinhardt, 2000) it seems to raise other, comparably severe problems (Miralda-Escude, 2000; Ostriker, 2000). Hence it seems reasonable to assume that CDM is not substantially self-interacting, but dynamically hot and thus not susceptible to spiral and non-axisymmetric structure.
In light of this, the key to measuring the baryonic to dark matter fraction is to make use of the non-axisymmetric structure that we can observe in the stellar light distribution. Using deviations from axisymmetry of stellar disks, several efforts have already been made to constrain the dark matter content of galaxies (eg., Visser 1980; Quillen 1999, and references therein). Some of the most significant conclusions came from studies of massive bars, which are the strongest non-axisymmetric structures in disk galaxies. Spiral arms comprise a less prominent, but still significant mass concentration. Already very early theoretical calculations of gas shocking in the gravitational potential of a spiral galaxy (e.g. Roberts, 1969) told us that we could expect “velocity wiggles” with an amplitude of 10 to while crossing massive spiral arms. For ionized gas, measurements of the velocity to this precision can be achieved with common longslit spectrographs. The imprint of the spiral pattern in the velocity field of real galaxies is indeed not very strong, as apparent in the 2D velocity fields of M100 (Canzian and Allen, 1997), of low surface brightness galaxies (Quillen and Pickering, 1997) or of a sample of spiral galaxies Sakamoto et al. (1999). There are only a few spiral galaxies without bars that show stronger wiggles in the velocity field that are associated with the arms, eg. M81 (Visser, 1980; Adler and Westpfahl, 1996) and M51 (Aalto et al., 1999). In order to still achieve the goal of measuring mass-to-light ratios we need to compare the weak features that we expect in the measured velocity field to detailed kinematic models. Using new high resolution K-band photometry to map the stellar component and employing a modern hydro-code to simulate galactic gas flows we are confident that our models show enough details and we can eventually measure mass-to-light ratios. If the arms are a negligible mass concentration relative to the dark matter distribution in the galaxy, these wiggles should appear only very barely in the velocity field. The main aim of this project is to find out what fraction of the rotation speed comes from a mass component with spiral arms. In order to do this we compare the strength of the wiggles in a galaxy’s observed velocity field to a model of the gas velocity field arising in a potential whose disk-halo fraction is known. As input for our gas dynamical simulations, we derive the stellar potential of the galaxy from color-corrected K-band photometry, while the dark matter component is modelled as an isothermal sphere with a core. Simulations are performed for a variety of potential combinations and values for the pattern speed of the spiral structure. The results from these simulations are then compared to the observed kinematics.
The paper is organized as follows. In the next Sections we present the galaxy sample and the observations (§2) and the general modelling techniques (§3). In Section 4 we present results for the galaxy NGC 4254 (Messier 99) and discuss them in §5. We summarize in §6.
2 THE SAMPLE DATA AND NGC 4254
We aim to perform this study on a sample of about half a dozen galaxies to account for systematic errors in the analysis of single systems. We could not identify a data set in the literature that fulfilled satisfactorily the requirements for this project. Hence we decided to collect data on a sample of galaxies ourselves. The data acquisition procedure was carried out in the following way. First we took NIR photometry of possible sample candidates to check whether their spiral structure shows up reasonably well in the K-band. From that sample we selected the most promising candidates and obtained kinematic data for them on a second observing run.
The requirement for the kinematic measurements was to trace the gas velocity perturbations of the spiral arms, ideally across the whole disk. The two classical methods for obtaining 2D gas velocity fields are H I or CO radio observations and Fabry-Perot interferometry. Alternatively, longslit spectra taken at different position angles can be used to map the disk.
Single dish H I or CO observations are not suited for our project because they suffer from relatively bad angular resolution and poor sensitivity to faint emission between spiral arms and the outer part of the disk. Sakamoto et al. (1999) recently published CO observations of a sample of spiral galaxies. In the velocity maps the signature of the spiral arms is in the majority of cases not or only barely visible. This most likely results from beam smearing of the anyway weak velocity perturbations. 2D Fabry-Perot velocity fields provide the required angular resolution but usually give only a very patchy representation of the disk: Mainly the H II regions show up in the map (e.g., Canzian et al., 1993; Regan et al., 1996; Weiner et al., 2001a). Because the coverage we can achieve by taking eight longslit spectra across a galaxy’s disk is reasonably high, in combination with its good angular resolution and sensitivity to faint H-emission we chose to collect our kinematic information by taking longslit spectra.
This paper deals only with the results of the first galaxy from the sample: NGC 4254.
2.1 Observations and Data Reduction
Since we require photometric as well as kinematic data for this study, there are some constraints which apply for the sample selection. To reasonably resolve the structures of the stellar disk we prefer galaxies with low inclinations with respect to the line-of-sight (LOS). However, the LOS component of the circular motion increases with inclination i. Due to the fact that the projection of the galaxy scales with cos(i) and the LOS fraction of the velocity scales with sin(i), galaxies in the inclination range between 30° and 60° are best suited for yielding all the photometric and spectroscopic information. We also chose the sample to consist mostly of non-barred high luminosity galaxies with strong spiral arms. All data were acquired at the Calar Alto observatory’s 3.5 m telescope.
For all sample galaxies we decided to take near-infrared (NIR) photometry to study the luminous mass distribution and gas emission line (H) spectroscopy to acquire kinematic information for the systems. The NIR images were taken during two observing runs in May 1999 and March 2000 with the Omega Prime camera at the 3.5 m’s prime focus (Bizenberger et al., 1998). It provides a field of view of 676 676 with a resolution of 03961 per pixel. We used the K’ filter which has a central wavelength of 2.12 ¯m. The integration time was 20 minutes on target which allows us to trace disks out to about 4 scale lengths. Our observation sequence included equal amounts of time on the targets and sky frames used for background subtraction. The data reduction was performed using standard procedures of the ESO-Midas data reduction package. In total, we collected NIR photometry data for 20 nearby spiral NGC-galaxies. From their NIR appearance we selected half of the galaxies as a subsample for which kinematic data should be taken.
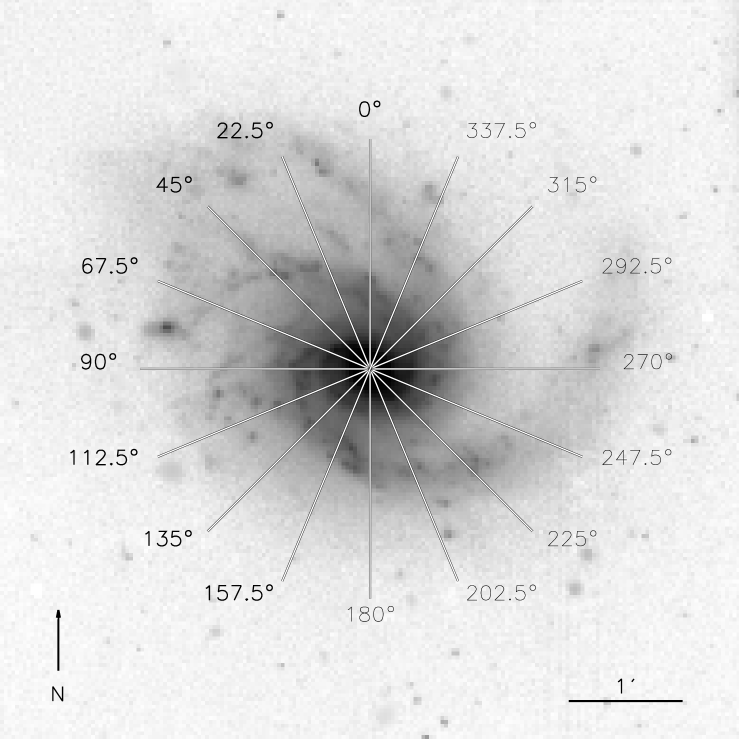
We obtained the gas kinematics from longslit spectroscopy measurements of the H emission. With the setup we used, the TWIN spectrograph achieved a spectral resolution of 0.54 Å per detector pixel, which translates to LOS-velocity resolution per pixel, allowing us to determine LOS-velocities with precision. We sampled the velocity field of the galaxy along 8 slit position angles111All position angles quoted in the text are in degrees eastward from north, all crossing the center of the galaxy (cf. Fig. 1). The slit of the TWIN spectrograph measures 4′ 15 on the sky. The spectra span a region of 6130 – 7170 Å centered on H. The spectra were obtained during three observing runs in June 1999, May and December 2000. The integration time for each single spectrum varied between 600 s and 1800 s due to weather and scheduling constraints. For the data reduction we used the IRAF package and applied standard longslit reduction procedures. We determined the LOS velocity component of the ionized gas as a function of radius from the galactic center from doppler shifts of the H-line. The center of the emission line was determined by fitting separately a single Gaussian profile to it and the brighter N II-line at 6584 Å. The weighted comparison of the two fits provided us with the uncertainty of the line center position. Finally, each of the eight spectra were folded at the center of the galaxy to get the two rotation curves. To do this coherently, we determined an average wavelength distance between a prominent sky line (at ) and H at our best guess for the galactic center from all eight spectra. Then, separately for each slit, the H rest wavelength in the center of the galaxy – where – was assigned to be at . There the two rotation curves should be separated. This provided us finally with 16 rotation curves at different position angles per galaxy, each reaching out to about 2 arc minutes. All the 16 rotation curves are displayed later in Section 4, Fig. 6 together with the results from one simulation.
2.2 Structural Properties of NGC 4254
We selected NGC 4254 (Messier 99) as the first galaxy from our sample to be analyzed, because it shows a clear spiral structure with high arm-inter-arm contrast. NGC 4254 is a bright Sc I galaxy located in the Virgo galaxy cluster with a recession velocity of adopted from NED222The NASA/IPAC Extragalactic Database (NED) is operated by the Jet Propulsion Laboratory, California Institute of Technology, under contract with the National Aeronautics and Space Administration.. We assume a distance of 20 Mpc towards NGC 4254, taken from the literature (Sandage and Tammann, 1976; Pierce and Tully, 1988; Federspiel et al., 1998). It has a total blue magnitude of and a diameter of 5.4 4.7 arcmin on the sky. At 20 Mpc one arc second is 97 parsecs in the galaxy which translates to 38.4 pc per detector pixel. Our H rotation curve for NGC 4254 (the H rotation curve is plotted later in Fig. 4 together with modelled rotation curves) rises steeply out to ″ (3.4 kpc) and then flattens at a rotation velocity of . This agrees well with earlier estimates (Phookun et al., 1993). From the kinematics we know that the south-western part of the galaxy is approaching. If we assume trailing spiral arms then the galaxy rotates clockwise when viewed from our perspective.
In the K-band NGC 4254 shows very prominent two-arm spiral features at most radii. The northern arm bifurcates at R kpc, causing a three arm pattern in the outer disk. Furthermore, the galaxy exhibits considerable lopsidedness. NGC 4254 shows a strong arm-interarm brightness contrast, noted by Schweizer (1976) to be even stronger than the one for NGC 5194 (Messier 51). Even in the K-band the brightness contrast is rather high, approximately a factor of 2 over a wide radial range. González and Graham (1996) argued that, combined with a usual density wave, some external mechanism is needed to invoke such high contrasts. However, NGC 4254 is well separated from any other galaxy in the cluster and there are no obvious signs for recent interaction. Phookun et al. (1993) reported in a recent paper the detection of high velocity H I clouds outside the disk’s H I emission. The authors argue that in-falling H I gas may be responsible for the unusual ’one armed’ outer structure of the spiral. In that case the spiral structure of NGC 4254 may have been recently reorganized, enhancing the southern arm or the arm-interarm mass density distribution. Recent interactions could in principle corrupt the project’s assumption of a steady state spiral pattern. But as we will find from our full analysis, the steady state assumption is seemingly not far off on time scales of a few dynamical periods.
NGC 4254 harbors a small bar-like structure at its center with a major axis position angle of °. From both ends of the bar two major arms emerge with a third arm splitting off the northern arm. By analyzing a color map of NGC 4254 one learns that this third arm is significantly bluer than the other regions of the galaxy and thus consists of a younger stellar population.
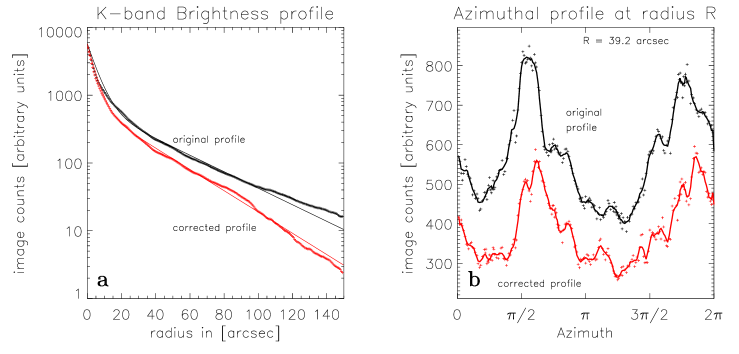
In the K-band the disk of NGC 4254 is well approximated by an exponential with a scale length of R 36″, corresponding to 3.5 kpc if a brightness average of the arm and interarm regions is considered and bright H II regions are removed from the image. Except for the very center, the whole surface brightness profile is well fitted by a double exponential model with an inner ’bulge’ scale length of 0.6 kpc (cf. Fig. 2a)
3 MODELLING
In the forthcoming Sections we describe the modelling needed to connect our photometric and kinematic observations. In this pilot study, we restrict our analysis and description to the spiral galaxy NGC 4254 (Messier 99). The data modelling involves four discrete steps. First we derive a stellar gravitational potential from the K-band images. Second, for each stellar mass-to-light ratio, we find a dark matter halo profile to match the total rotation curve. Third, we perform hydrodynamical simulations of the gas within the combined stellar and dark matter potential. Finally, we compare the predicted gas velocity field to our H-observations.
3.1 The Stellar Potential
3.1.1 K-band Light as Tracer of the Stellar Mass
We would like to derive the stellar potential directly from the deprojected K-band stellar luminosity density of the galaxy. To this end, it is important to understand how well the NIR surface brightness traces the stellar mass density. There are two major concerns which complicate the direct translation: both dust extinction and spatial population differences could introduce K-band mass-to-light ratio variations. Observing at ¯m reduces the effect of the dust extinction significantly. Since we look at most galaxies from a nearly face-on perspective, we expect the optical depths to be in the K-band, leading to local flux attenuations of % (Rix and Rieke, 1993; Rix and Zaritsky, 1995). Significant global M/L-variations may arise from red supergiants; they emit most of their light in the near infrared and are fairly numerous and thus could considerably affect the total light distribution in K-band images. Supergiants evolve very rapidly and therefore are mainly found within the spiral arms where they were born. This would tend to increase the arm-interarm contrast, leading to stronger inferred spiral perturbations in the stellar potential.
We used the approach of Bell and de Jong (2001) to correct for local mass-to-light ratio differences, which may still be present in the K-band images. From spiral galaxy evolution models, assuming a universal IMF, Bell and de Jong (2001) find that stellar mass-to-light ratios correlate tightly with galaxy colors. They provide color dependent correction factors, which we can use to adjust our K-band image to constant mass-to-light ratio. For NGC 4254 we used a -filter image taken from Z. Frei’s galaxy catalog (Frei et al., 1996). The -filter (Thuan and Gunn, 1976) has a passband that is very similar to the Johnson -filter, so we can use the color correction given for while using colors. The mass-to-light ratio is given by
| (1) |
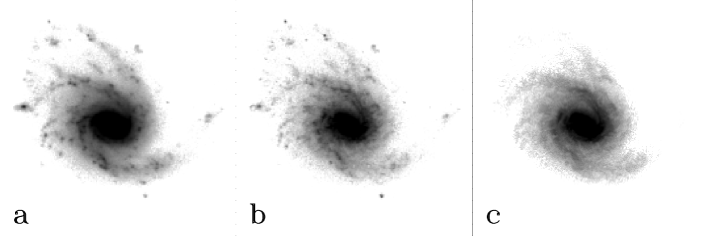
This relative correction was performed on a pixel by pixel basis by scaling each flux by the corresponding (cf. Fig. 3b). NGC 4254 has V-K of 2.61 which results, according to (1), in a K-band maximal-disk stellar M/L, , of 0.54. If we estimate a maximal-disk stellar M/L from the disk potential we use for the simulations, we find . These values are in good agreement, considering the uncertainties that contribute to the estimation of . In our approach even small changes in NGC 4254’s distance or inclination result in errors of . The galaxy becomes significantly bluer from the center to the outer disk regions, with the bluest regions being the spiral arms themselves. As a result the mass density profile of the corrected disk gets steeper: the disk scale length (after deprojection) changes from 3.5 kpc to 2.7 kpc (cf. Fig. 2a). In general the correction for constant mass-to-light ratio does not particularly change the arm-interarm contrast of NGC 4254 and thus does not reduce the non-axisymmetric component of the stellar potential. In the force field of the galaxy, the relative strength of the tangential component makes up % of the radial force component before and after the correction. Nevertheless, the correction modifies the non-axisymmetric force component on average by % (cf. Fig. 2b). This has an evident effect on the data and the models, which we think is favorable. The correction seems to work fine for most of the disk. However, there are some thin dust lanes at the inner edges of the spiral arms in the green image of NGC 4254 that are optically thick. Because of the quite poor resolution of the green image, the dust lanes are not distinctly visible in the image. For these the correction leads to some overcorrection because virtually all the green light is absorbed by the dust lane. But since these optically thick dust lanes are narrow and still at the location of the NIR spiral arms, we assume that their influence on the total potential is negligible.
To reduce the influence of star forming H II-regions and OB-associations, which are distinctly visible in the K-band data, we filtered the image by means of a Fourier decomposition. From the azimuthal decomposition we discarded the Fourier terms higher than N=8 and subtracted the residual from the K-band image of NGC 4254. This correction does not depend significantly on the number of Fourier terms included in the fit. This procedure cleaned the image of the patchy small scale structure and left us with the smooth global spiral pattern (cf. Fig. 3c).
3.1.2 Deprojection

To deproject the K-band images to face on, we need to derive the disk inclination, i, and the major axis position angle, PA from the observed gas kinematics. We perform a global -fit of an axisymmetric rotation curve model to the 16 observed rotation curves. The model is based on a combination of stellar and dark halo rotation curves which were scaled to an average rotation curve from the six slit positions closest to the major axis (cf. Fig. 4). Deriving i and PA is an iterative process. The final values get determined only after the first full hydrodynamical simulations, when actual non-axisymmetric model rotation curves can be fitted to the observed kinematics. As it turns out, in the case of NGC 4254 the difference in the resulting inclination can be considerable. An axisymmetric model yields a disk inclination of 8 while the simulations suggest an inclination of 2. We use the latter as the inclination of the galaxy. However, spatial deprojection effects are not particularly large in the inclination range of 30° – 40°. The major axis position angle is not sensitive to the details of the rotation curve; we adopt PA = 675.
3.1.3 Calculation of the Gravitational Potential
The smoothed image is then used to calculate the maximal disk stellar potential by numerical summation over the whole mass distribution of the galaxy, which is defined by the surface mass density we get from the K-band images.
| (2) |
with:
| (3) |
The indices i and j denote different radius vectors, specifying here the pixels of the image array. Beyond the size of the detector array, the surface mass density is assumed to be zero. The stellar mass-to-light ratio is assumed to be constant, after the corrections described in §3.1.1. The factor in Equation (3) accounts for the finite thickness of galactic disks following (Gnedin et al., 1995). This softening factor was chosen to be compatible with a vertical exponential density scale height of pc, independent of radius. This assumption most probably holds for NGC 4254, which is a late type spiral and its central spheroid, which appears barred and extends only to about a disk scale length. Additionally, small bulges may not be spherical and thus might be well described by the constant scale height of 400 pc assumed for most of the simulations. Moreover, our derived potential does not depend significantly on the choice of . Varying by 10% leads to relative changes of the resulting forces by on average. Only for the most massive stellar disk models we performed an explicit disk-bulge decomposition and substantially increased the softening factor for the bulge to 760 pc. This is helps to achieve a better fit at the very inner part of the observed rotation curve.
We also calculate a potential from an equivalent axisymmetric density distribution fitted to the measured K-band luminosity profile. The rotation curve is evaluated from the stellar potential by
| (4) |
The maximal stellar mass-to-light ratio in equation (2) is determined by fitting the rotation curve emerging from the axisymmetric potential to the inner part of the observed rotation curve with the highest possible . Later, when combining stellar and dark halo potentials, we take fractions of this stellar ’maximum disk’ fit, to explore various luminous-to-dark matter ratios.
3.1.4 The Dark Halo Potential
For the present analysis we use the radial density profile of a pseudo-isothermal sphere as the dark matter component in our model. Its radial density profile, characterized by a core of radius and a central density , is given by:
| (5) |
The corresponding rotation curve is
| (6) |
(Kent, 1986) and the potential is
| (7) |
The asymptotic circular velocity in this (infinite mass) halo is related to the two other free parameters and by
| (8) |
Thus, and uniquely specify all properties of the halo. For any fraction of the maximal stellar mass we can obtain the halo parameters from the best fit of the combined stellar and halo rotation curve to the observed kinematics.
In the final potential the two components are combined in the following way:
| (9) |
with ranging from 0 to 1, and denoting the stellar potential with maximal . The contributions to the circular velocity add quadratically:
| (10) |
For every we are able to find a dark matter profile, which complements the luminous matter rotation curve. -fits to the observed data are similar (cf. Table 1), necessitating this study.
| (kpc) | |||
|---|---|---|---|
| 0.2 | 1.08 | 155 | 2.45 |
| 0.4444 | 2.00 | 150 | 3.42 |
| 0.6 | 3.03 | 150 | 3.30 |
| 0.85 | 5.68 | 155 | 2.00 |
| 1.0 | 7.30 | 155 | 1.84 |
Note. — Dark halo parameters used to generate the potentials used for simulations. The -values refer to an axisymmetric model.
3.1.5 The Pattern Speed and Corotation
The spiral structure in galaxies is tightly related to the density wave theory that is used to describe the formation of these structures in spiral disks (for a review cf., Athanassoula, 1984). If the spiral pattern evolves more slowly than the orbital time scale, resonances occur at certain radii in the galactic disk. We assume that the spiral pattern remains constant in a particular corotating inertial frame, specified by the pattern speed . At the corotation radius ( where V is the circular rotation speed) everything corotates with the spiral pattern. In addition to this corotation resonance there are more radii, at which the radial oscillation frequency and the circular frequency are commensurate. In linear density wave and modal theories, these so called inner and outer Lindblad resonances should inclose the radial range for which a spiral pattern may develop and persist over a longer period of time (Lin and Shu, 1964). On the other hand, non-linear orbital models for open galaxies indicate that the symmetric, strong part of the stellar spiral might end at the inner 4:1 resonance (Patsis et al., 1991). Finding the radial locations of these resonances in real galaxies is a delicate endeavor and there are no widely agreed upon ways to determine them.
For our analysis the pattern speed or its corresponding corotation radius, is crucial since it modifies the forces acting in a non-rotating inertial frame
| (11) |
Therefore we need to perform a set of hydrodynamical simulations at different , to find the best matching value and thereby to also determine the corotation radius. As it turns out, the simulations are well suited to find these values reliably. However, to reproduce all the gravitationally induced features found in the observed kinematics, we suspect that the assumption of a constant pattern speed for the whole disk is only a crude approximation of the dynamical processes occurring in the disk of NGC 4254. The pattern rotation speed most probably depends slightly on the radius. A radius dependent pattern speed would eventually drive evolution of the spiral pattern. Although spiral structure is most likely a transient feature in the galactic disk, it persists for several dynamical time scales (Donner and Thomasson, 1994; Patsis and Kaufmann, 1999) 333In light of our project it is interesting to note that in both N-body simulations referenced here, sub-maximal disks were adopted in the initial conditions. But, since for now we have no means to reliably determine the radial dependence of the pattern rotation speed, we choose to ignore the time evolution of the spiral pattern and assume a constant pattern speed for the simulations.
3.2 Hydrodynamical Simulations
The next step is to calculate the expected kinematics for a cold gas orbiting in with a certain . We model the gas flow with the BGK hydro-code (Prendergast and Xu, 1993; Slyz and Prendergast, 1999). This is an Eulerian, grid-based hydrodynamics code which is derived from gas kinetic theory. The simulations are challenging because cold gas in galactic disks rotates with such high Mach numbers that if the flow is diverted from a circular orbit by non-axisymmetric forces, the consequence is etched in the gas in patterns of shocks and rarefied regions. BGK is well suited for these simulations because as verified by extensive tests on standard 1D and 2D test cases of discontinuous non-equilibrium flow (for a review, see Xu, 1998), at shocks and contact discontinuities BGK behaves as well as the best high resolution codes and it gives better results at rarefaction waves because it naturally satisfies the entropy condition.
To model the two-dimensional gas surface densities and velocity fields for NGC 4254 we carried out a set of simulations on a 201 by 201 evenly spaced Cartesian grid. Our data for NGC 4254 extend out to a radius of about 11.6 kpc, hence on a 201 by 201 grid this gives a resolution of about 116 pc per side of a grid cell, which is considerably higher than the effective force smoothing of 400 pc.
Given that the gas surface mass density of the modelled galaxies is much lower than the density of the stellar disk and halo, we neglect the self-gravity of the gas, and compute its response to a fixed non-axisymmetric gravitational potential derived from the corrected NIR image of the galaxy with a 3-fold reduced resolution (cf. Sect. 3.1). We approximate the ISM as a monatomic gas.
The gas temperature profile is taken to be uniform and by imposing an isothermal equation of state throughout the simulation we assume that the gas instantaneously cools to its initial temperature during each updating timestep. The initial density profile of the gas is exponential with a scale length equal to a third of the disk radius, namely 3.86 kpc. We begin each simulation with the gas initially in inviscid centrifugal equilibrium in the axisymmetric potential given by and (see Sect. 3.1). Following the initialization of the gas in centrifugal balance in an axisymmetric potential, we slowly turn on the non-axisymmetric potential at a linear rate computed by interpolating between the final non-axisymmetric potential and the initial axisymmetric potential so that the potential is fully turned on by the time 40 sound crossing times of the code have passed. Here the sound crossing time is defined as the time it takes to traverse the length of the diagonal of a grid cell at sound speed. For an isothermal simulation with a sound speed of the sound crossing time of a cell in our simulation is about 16 Myr, so that by 40 sound crossing times, the gas has evolved for 640 Myr which is about 1.4 times the dynamical time of the galaxy measured at a radius of 11.6 kpc. After the non-axisymmetric part of the gravitational potential has been fully turned on, we continue to run the simulation for about another dynamical time. A thorough description of the technical details of the simulations is given in a companion paper (Slyz et al. (2001), in prep.).
We ran a large set of simulations both to understand the power and limitation of our modelling in general and to match the observations. Simulations were performed for a total of five different fractions of the stellar disk: disk only, i.e. , and 0.85, 0.6, 0.4444 and 0.2, or accordingly is given in % from 20% to 100%. In all the cases the core radius and the asymptotic velocity of the pseudo-isothermal halo were adjusted to best match the averaged rotation curve, as summarized in Table 1. The variations in between the low mass disks and the massive ones are mainly caused by the attempt to keep and at physically reasonable values. The bump at 20″ to 40″ (Fig. 4) is fitted better for the high mass disks, which reduces the overall compared to the low mass disks.
We have no secure prior knowledge of the spiral pattern speed . We determine it by assuming different values for and then comparing a simulation to the data. For every simulation with a different stellar/dark halo combination, we get slightly different values for the best matching or equivalently for the corotation radius . We covered the complete range of reasonable , i.e. from about a disk scale length to well outside the disk. We even made simulations for the case of no spiral pattern rotation, .
To test how the amplitude of the velocity perturbations depends on the responsiveness of the gas, we ran simulations at a variety of temperatures corresponding to sound speeds , of . In the following Sections we discuss some of the results from the simulations.
4 RESULTS FOR NGC 4254
4.1 Simulated Gas Density
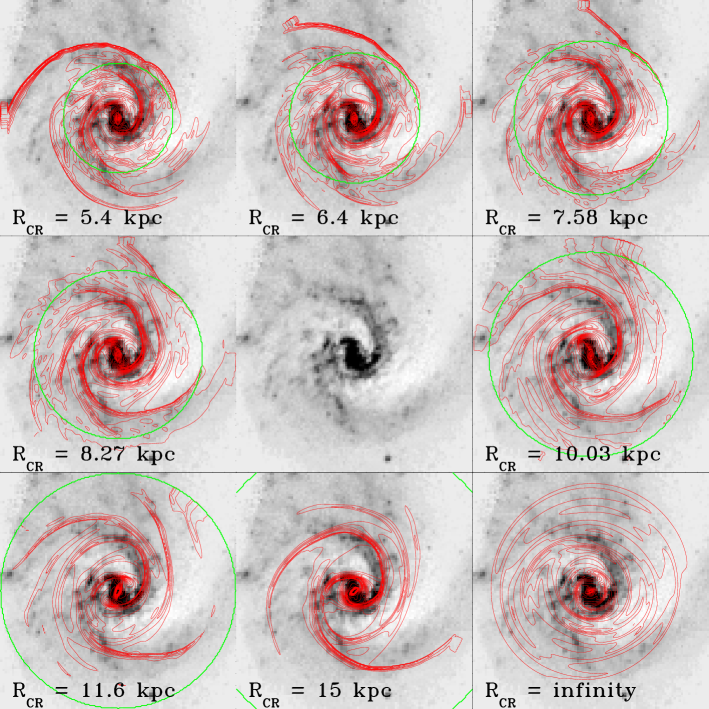
Figure 5 shows eight views of the simulated gas density for different pattern speeds over-plotted as contours over the unsmoothed, deprojected, color corrected K-band image of NGC 4254. The simulated gas density follows an overall exponential profile with a scale length of kpc, comparable to the one of the disk itself. The contours in the Figure are chosen to highlight the density enhancements and locations of the gas shocks caused by the spiral arms. For almost all simulated cases the strong part of the galaxy’s spiral structure lies well inside corotation, where the circular velocity is larger than the spiral pattern speed. The gas will thus enter the spiral arms from their inward facing side, producing the strongest shocks there. For a well matching simulation, we expect the shocks to be near the OB associations that trace the spiral arms.
It is remarkable how well the overall morphology of NGC 4254 can be matched by the gas density simulations. Not only are the two major spiral arms clearly identifiable in most simulations but the less prominent northern arm and the locations where the arms bifurcate are reproduced in some cases well. For fast pattern speeds ( in Fig. 5) we find a strong shock in the northern part of the galaxy that cannot be correlated with any mass feature. We believe it develops because the potential close to the upper boundaries of the computational grid is quite non-axisymmetric, and this leads to a spurious enhancement of a shock. The shock does not propagate into regions inside the corotation radius, and therefore we refrain from smoothing the potential.
It is important to note that the simulations lead to a very stable gas density distribution that does not change much after the non-axisymmetric potential is fully turned on. When the contribution of the disk is increased in the combined potential, all spiral features get enhanced in the gas density but the galaxy morphology is essentially unchanged. For a more detailed discussion of these issues, please refer to the accompanying paper by Slyz et al., which is in preparation. With increasing pattern rotation (smaller corotation radii in Fig. 5) we find that the predicted spiral arms become more and more tightly wound. For a comparison to the stellar spiral morphology we need to define some criteria to pick the right model. If the situation in NGC 4254 is similar to NGC 4321, whose gas and dust distributions and their connection to star forming regions have been discussed in detail by Knapen and Beckman (1996), then a good matching gas morphology is one where for radii smaller than the corotation radius, the shocks in the gas density lie on the inside of the stellar spirals. Shortly downstream from there, many star forming H II regions, triggered by gas compressions, should show up as patches in the arms. According to these criteria, the best matching morphology
can be unambiguously identified to be produced by a simulation with (Fig. 5 upper right panel), corresponding to a pattern speed of . and enclose the range of possible values. This corresponds to an uncertainty of % in the value of .
Our results were compared to values of for NGC 4254 from the literature, which were determined by different means. The results kpc (Elmegreen et al., 1992) and kpc (González and Graham, 1996), scaled to our distance assumptions, provide larger estimates than our findings. However, given the picture of non-linear orbital models, where one expects the strong part of the stellar spiral to end inside the inner 4:1 resonance (Patsis et al., 1991) we find that our result of is consistent with the galaxy’s morphology. In short, these simulated gas densities provide us with an excellent tool to determine the pattern rotation speed of the galaxy. Apart from requiring a constant global pattern rotation our approach is independent of an underlying spiral density wave model. The overall very good representation of the whole spiral structure by the simulated gas density makes us rather confident that the simulations render realistic processes affecting the gas.
4.2 Simulated Gas Velocity Fields
As another output of our simulations we get the two-dimensional velocity field of the gas. As is evident from a comparison to the gas density distribution, the velocity jumps are – as expected – at the locations where the density map shows the shocks. They show up as areas of lower local circular velocity compared to the elsewhere rather smoothly varying gas velocity field. The velocity wiggles, as well as the density shocks themselves, have very tight profiles and thus are even more narrow than the physical extent of the stellar arms. They have to be compared to the observed kinematics.
4.2.1 The observed kinematics
The rotation curves at the 16 slit positions from the observations are shown in Fig. 6 as data points. It is apparent that the longslit spectra allow a good velocity coverage along the slits. Almost all rotation curves show contiguous data points out to a radius of 5. The spectra show a lot of wiggles on a small spatial scale. Jumps of on a scale of ″ are common. The very prominent jumps that we observed in slit positions 225 and 225° clearly exceed the average wiggle sizes. Inside of about 03 the small bar influences the velocity field. The most prominent trace of the bar occurs at its minor axis at the slit positions of 135°/1575 and 315°/3375.
The trace of kinematic features in the outer disk is not conspicuous in subsequent slits. The eastern part of the disk (slit positions 45° – 135°) displays a quite smooth velocity field, while the western part shows some large scale variations. Aside from the inter-arm region between the inner disk and the southern arm where a 5 wide depression is moving outward in subsequent slits (positions 5) no significant features are apparent in the outer disk. Unfortunately in this inter-arm region the is not so good. Does that mean we do not see the trace of the arms in the velocity field, or is the single slit representation of the 2D velocity field misleading and does not allow us to identify coherent features in adjacent slits? Clearly, the wiggles associated with spiral arms in NGC 4254 are not nearly as strong as in M81 (Visser, 1980), thus their identification is harder. A CO map of NGC 4254’s center (Sakamoto et al., 1999) shows also no coherent wiggles across spiral arms and we doubt that it would be much different on a Fabry-Perot image. Rather than being confused by the one dimensional nature of our rotation curve slices we believe that the spiral features in the velocity field are intrinsically weak.
4.2.2 Projection and Alignment
To compare the simulated gas velocities to the observed data, we need to project the modelled velocity field according to the real orientation of the galaxy so that we can obtain the line-of-sight velocity along locations corresponding to the slit positions taken with the spectrograph. For this procedure we take the velocity components and transform them into velocity components parallel and orthogonal to NGC 4254’s major axis. Since the simulations yield truly 2D velocity fields, the component parallel to the major axis does not contribute to the line-of-sight velocity as it reflects only tangential motion. The orthogonal component is multiplied by the sine of the inclination of the disk, to account for the line-of-sight fraction of the velocities.
We read the velocities along slits which correspond to the slit positions along which we took measurements with the spectrograph. The angular width of the grid cells of the simulation (119) is comparable to the slit width of the spectrograph we used (15), which was also the average seeing conditions.
The angles between the spectrograph slit orientations must be translated to angles in the plane of the galaxy to actually compare the same parts of the velocity fields. This translation makes use of the following relationship:
| (12) |
where is the apparent angle of the spectrograph slit across the galaxy on the sky and is the corresponding intrinsic angle within the plane of the galaxy. PA is the position angle of the galaxy’s major axis on the sky. All angles are in degrees measured eastward from north. Solving for gives:
| (13) |
The foreshortening of the radial proportions due to projection in the direction of the minor axis is determined by
| (14) |
Finally the detector pixel sizes of the TWIN, where the observed velocities come from, and Omega Prime camera, whose pixel scale is the reference grid for the simulations, must be adjusted to perfectly align with each other.
4.2.3 Overall Fit Quality

Figure 6 shows the 16 separate rotation curves with a corresponding simulated velocity field over-plotted. The simulation used here for comparison is the one for which the gas density distribution best-fit the K-band image (displayed in Fig. 5). It has a corotation radius of kpc – corresponding to a pattern speed of – and a stellar disk mass fraction of 60%. A gas sound speed of was assumed here.
An overall fit quality gets determined by a global -comparison of the simulated velocity field to the actual observed velocity field along the 16 measured slit positions. Since with the errors from the observations we find a we added an overall to provide an average fit with . The -fitting excludes the very central region hosting the small bar because the modelling is not intended to fit the central bar, which might have a different pattern speed. The total number of data points included in the -fitting is 1077.
The general fit quality is governed by the effect that the projection of the simulated velocity field introduces. The good overall match indicates that we quite reliably found the right position angle and inclination for the galaxy. The simulated velocities align very well with the measured data points. In addition to the good overall match, the general rising or falling shape of the separate curves is also excellently reproduced by the simulations. The lopsidedness of the galaxy is reflected in the shape of the rotation curves on the receding and approaching side of the disk. At the receding side (675) the rotation curve rises steeply and continues to rise out to 2′, while the approaching side (2475) rises less steeply but flattens out or even drops beyond 07. These characteristics are closely reproduced by the models.
A close inspection of the two profiles shows however that the overlap in the match of the simulated velocities with the measurements is not always satisfactory. The agreement of local features in the simulations and the measured data is sometimes very good and even occurs in subsequent slit positions. However, there are also many locations, where the match is poor. This is particularly the case in the inner region of the galaxy, where the small bar dominates the kinematics. Both profiles show strong wiggles where the slit crosses the bar, especially close to the minor axis of NGC 4254’s velocity field, which is also close to the minor axis of the bar itself. While the simulations show a rather symmetric imprint, the measurements exhibit a signature different from that, leading to a significant mismatch at several slit positions, e.g. 2925 and 3375. This might be caused by the bar, having a slightly different pattern speed. In the outer parts of the rotation curve we also find several wiggles in the observed data that have no correspondence to the wiggles in the simulations and vice versa.

It is important to note that we do not expect to reproduce all the wiggles in the galaxy’s rotation curves, since we are only modelling those created by the non-axisymmetric gravitational potential. The wiggles originating for another reason – like expanding SN gas shells – are not considered by the simulations and thus do not show up in the resulting velocity field.
One very interesting thing to mention is the fact that even for moderate differences in the fit quality of the axisymmetric disk model (cf. Table 1), the fit quality of the non-axisymmetric simulated velocity field is rather independent of the initial axisymmetric model. And, moreover, the formally preferred axisymmetric maximum-disk decomposition (cf. Table 1) turns out to be the most unfavored model, once the simulations were performed. This implies that even if an axisymmetric model profile provides a better fit to a measured rotation curve, it does not necessarily mean, that this combination provides the best fit when one considers the 2D non-axisymmetric gas evolution.
4.2.4 Varying the Stellar to Dark Matter Ratio
As already mentioned in Section 3.2, we performed simulations for five stellar disk and dark halo combinations, as listed in Table 1. Since the non-axisymmetric perturbations are induced in the potential by the stellar contribution, we expect the amplitude of the wiggles in the modelled rotation curves to depend significantly on the non-axisymmetric contribution of the stellar potential whereas we expect the radial distribution of the wiggles to be rather independent of the stellar mass fraction. As expected, in the simulations with the lightest disk, the wiggles look like modulations on the axisymmetric rotation curve. In the case of the maximum disk, the rotation curves are strongly non-axisymmetric (cf. Fig. 7). To describe this characteristic more quantitatively, we learn from Fig. 8 that the amplitude of the deviations from axisymmetry increases linearly with the mass fraction of the stellar disk, which proves the general validity of the concept with which we try to approach this problem.

The strongest velocity wiggles arising in the modelled velocity fields are the ones connected to the central bar-like feature. However, since here we are not interested in modelling the dynamics of the bar, we exclude this inner part from the analysis.

If we do a formal comparison of the models with the observed data we find that for most of the sub-maximal disks the fit is considerably better than for heavy stellar disks. By formal, we mean that we use all data points for the -fit, regardless of whether a certain part matches well or not with two exceptions: we exclude the very central part with the bar and we correct for the outer strong shock appearing in the fast rotating models (cf. Fig. 5).
The result from this -fit is presented in Fig. 9. In all cases, % gives the worst fit to the observed rotation curves. For the lower mass disks it is very hard to decide, whether a particular disk mass is preferred. For kpc we find about the same for all non-maximal disk models. Since we can not reject data on a physical basis, we can state only a trend at this point. Thus our conclusion from this part of the analysis is that the disk is most likely less than 85% maximal.
4.2.5 Varying the Gas Temperature
This kind of analysis may be very sensitive to the temperature of the gas which is assumed for the modelling. Higher gas temperature corresponds to a higher cloud velocity dispersion and thus to a reduction in the response of the gas to any feature in the gravitational potential. Within the Milky Way Galaxy varies from in the solar neighborhood to in the Galactic center (Englmaier and Gerhard, 1999). For simulations of a galactic disk with an isothermal equation of state, the most commonly used values for are 8 – , corresponding to K in gas temperature (Englmaier and Gerhard, 1999; Weiner et al., 2001b). In these simulations the authors make the statement that within the reasonable limits of the modelled gas flows across the primary shocks is not considerably affected. Only when modelling strong bars in galaxies the simulations might be dependent on the choice of the gas sound speed (Englmaier and Gerhard, 1997). For the main set of simulations presented in this paper, we chose , corresponding to a gas temperature of 7250 K. To probe the effect of the gas temperature, we performed simulations for four different gas sound speeds, , of 15, 20, 30 and 40 . With a simulation performed at higher sound speed, we tested if our results at lower sound speeds were caused by too cold gas being too strongly affected by the non-axisymmetric part of the potential. Increasing the sound speed slightly broadened and shifted the shock fronts in our simulations, but not enough to change the conclusions of this paper. A more detailed technical discussion on the simulated gas dynamics in NGC 4254 will be presented in a forthcoming paper by Slyz et al.
5 DISCUSSION
To learn about the relative role of stellar and dark matter in the inner parts of spiral galaxies, we have extended the hydrodynamical simulations of galactic features from bars (Weiner et al., 2001b) to the regime of spiral arms. In this paper we have used color corrected K-band images to derive the stellar portion of the potential of NGC 4254 for the analysis.
From the simulation of the gas density we find a very good morphological match of the gas shocks to the spiral arms in the galaxy; this aspect of the simulations determines the pattern speed of the galaxy to about 15% precision.
A comparison of the observed and simulated kinematics has turned out to be challenging. Although the overall shapes of the different rotation curves were very well reproduced by the simulations, some small scale structure remains unmatched. The formal comparison of the gas velocity field to the observed H kinematics favors simulations with small disk mass fractions (cf. Fig. 9) and correspondingly small values for the stellar mass-to-light ratio. With the K-band mass-to-light ratio discussed in Section 3.1.1 our results yield an overall stellar M/L of . We can estimate the relative mass fractions from their contributions to the total rotation velocity. At a radius of 2.2 uncorrected K’-band exponential disk scale lengths ″ or 7.7 kpc), the individual rotational support of the stellar and dark halo components for % are and . If a total mass is estimated via
| (15) |
we find that at , or accordingly of the total mass inside is dark. Since our confidence limits are not very tight, we cannot use them to test other authors’ findings in detail. Projects yielding results in favor of a sub-maximal stellar disk usually find a disk mass fraction less than our upper limit estimate. Bottema (1997) as well as Courteau and Rix (1999) conclude that the contribution of the stellar disk to the total rotation is which translates to . At the current state of the project we cannot exclude or confirm these findings. This issue is going to be discussed more thoroughly as soon as we have a few more examples analyzed.
In the following Sections we will discuss the details that could cause deviations from a perfect match between the simulations and the measurements.
5.1 Is the Concept Reasonable?
If the self-gravity of the stellar mass in the disks of spiral galaxies plays an important role then undoubtedly the potential becomes non-axisymmetric. The trajectory of any kinematic tracer in the galaxy, such as the gas, should be affected by these potential modulations. But is the H II component of the gas the best choice for tracing the galaxy’s potential? Analytic calculations of gas shocks in the gravitational potential of a spiral galaxy (e.g. Roberts, 1969) tell us that we should expect velocity wiggles with an amplitude of 10 to 30 while crossing massive spiral arms. However, kinematic feedback to the gas from regions of massive star formation, from expanding gas shells produced by supernova explosions and from other sources of turbulence, introduces small-scale random noise in the velocity fields. These fluctuations typically lie in the range of 10 to 15 (Beauvais and Bothun, 1999) and seem even higher in the case of NGC 4254. The kinematic small-scale noise could be increased if the dynamics of the brightest H II regions is kinematically decoupled from the global ionized gas distribution. To check this we over-plotted the H-intensity on the rotation curves to see if the star formation regions coincide with the strongest wiggles in the rotation curves. There is, however, no discernible relation between the amplitude of a wiggle and the intensity of the H II region, indicating that the deviations are not confined to compact H II regions.
As an alternative to observing the ionized phase of the hydrogen gas, one could consider using H I radio observations. However, available H I data are limited by the larger size of the radio beam that smears out kinematic small-scale structures in the gas. In principle, stellar absorption spectra could also provide relevant kinematic information, but this approach has two disadvantages compared to an approach using gas kinematics. First, the acquisition of stellar absorption spectra with sufficient S/N would take a prohibitively large amount of telescope time. Second, stellar kinematics cannot be uniquely mapped to a given potential; there are different sets of orbits resulting in the same observed surface mass distribution and kinematics. Thus, despite its apparent shortcomings H II measurements seem to be the most promising method with which to approach the problem.
Could the discrepancies between modelled and observed kinematics be related to taking the NIR K-band image of a galaxy as the basis to calculate its stellar potential? As already discussed in Section 3.1 there are several factors which throw into question whether the K-band image is a good constant mass-to-light ratio map of the stellar mass distribution despite the color correction we applied. However, the two major factors – dust extinction and the population of red super giant stars – tend to affect the arm-interarm contrast, rather than the location of the K-light spiral arms. Dust lanes lie preferentially inside the component of a galaxy’s spiral (Grosbøl et al., 2000) absorbing interarm light, while the red super giants may actually have their highest density in the spiral arms directly, where they emerged from the fastest evolving OB stars. This effect should become apparent in the simulations as slightly wrong amplitudes of the gas wiggles, leaving their radial position mostly unchanged. So even if the K-band images might actually include unaccounted mass-to-light ratio variations, they most probably introduce only small errors, which should not result in an overall mismatch of the models with the data. The color-corrected K-band images should therefore reflect the stellar mass accurately enough for our analysis. Certainly, there appears to be no better practical mass estimate that we could use for our analysis.
5.2 Are there Systematic Errors in the Modelling?
The most critical part of this study are the several modelling steps required to predict the gas velocity field for the comparison with the data. We apply a spatial filter to the K-band image before calculating the disk potential to reduce the significance of the clumpy H II regions (as described in Sect. 3.1). The residual map of the discarded component shows all the bright H II regions in the disk, giving us confidence that we have excluded much of the structures that reflect small-scale M/L variations. This correction removes roughly 3.5 % of the total K-band light and does not depend strongly on the number of Fourier components used for the fit. For two extreme decompositions employing 6 and 16 Fourier components, the mean resulting relative discrepancy in the derived potentials is only . One remaining concern in calculating the potential might be that the mass density map cuts at the border of the image. However, the galaxy completely fits in the frame, fading into noise before the image border. Moreover, we do not perform the simulations for the complete galaxy, but only for the inner 11.6 kpc in radius. So the edge cutoff effect is very small and affects the part of the potential we are looking at even less.
For the dark matter component we chose an isothermal halo with a core because of its flexibility in fitting rotation curves. The functional form of the dark halo profile has only a second order effect on the results of the simulations compared to the variations due to its two basic parameters and . We decided not to distinguish between different dark halo profiles for the present analysis.
The most complex step surely is the hydrodynamical simulation of the gas flow in the galaxy’s potential. Beyond the tests of the code discussed in Section 3.2, it is the excellent morphological agreement between the simulated gas density profiles and the observed spiral arms that gives credence to the results of the code. The choice of the grid size was mainly motivated by the desire to achieve reasonable computing times, and not to exceed the seeing resolution. To check the grid cell size’s effect on the results, for selected cases we also ran simulations on grids with two times higher resolution as well as on grids with two times lower resolution. These simulations showed some minor differences. Some gas shocks had a slightly larger amplitude in the density distribution but their locations were essentially unchanged. The morphology and the velocity field of the central bar was most susceptible to the grid cell size. It results in small changes in the bar position angle. However, we anyway exclude the central region containing the bar from our analysis. The final fit deviation between simulations with different grid cells ranges at about 6% and does not change the conclusions of this paper. Accordingly we consider it safe to perform the simulations on the medium resolution grid we used.
In a real galaxy the assumption of a global constant pattern rotation speed may not be fulfilled. In particular, we should expect the central bar to have a different pattern speed. Also, the pattern might be winding slowly, rather than being fixed in a corotating frame. Furthermore, the gas may not have a uniform temperature. If these simplifications were relaxed, the location of the spiral arms in the hydro-simulations would change, and eventually lead to a different overall fit quality. Lacking any solid basis to constrain these parameters, we are unable to implement these effects into the modelling procedure. Finally, the code does not include gas self-gravity. The effect of gas self-gravity is difficult to quantify without actually performing simulations, but from the literature we know that it tends to amplify the gas response. Gas self-gravity also suppresses the tendency of the gas to shock (Lubow et al., 1986). Since we are interested in the strength of the gas response to the gravitational potential and we already find that for high disk M/L the response is too strong, we assume that our upper limit holds also if gas self-gravity was included. Given the good morphological match, we may confidently assume that all our approximations are not far off.
This leaves non-gravitationally induced gas motions as the main contamination in the comparison of the models to the observed kinematics. The influence of non-gravitational gas motion is in our case increased by the circumstance that we observe NGC 4254 from a perspective which is not far from face-on, so any motion along the z-direction is expected to appear clearly in the spectra. Eliminating these wiggles from the rotation curve is not possible since we have no means to reliably identify them. Any method we apply for excluding parts of the data will be affected by some kind of bias.
5.3 Is the Galaxy Suited for this Analysis?
Finally we must consider the possibility that the galaxy we picked for our analysis might not be as suited as it appeared to be. NGC 4254 is not the prototype of a classical grand design spiral galaxy in optical wavelengths. However, as it can be seen in the central frame of Fig. 5, the galaxy exhibits in the M/L corrected K’-band image mainly an spiral pattern with a strong symmetric part, that ends at kpc and fainter outer extensions. With its large angular size and moderate inclination, NGC 4254 seems to be one of the most promising candidates for this kind of study in our sample. However, as discussed earlier in Section 2.2, there are indications that this galaxy might not be as isolated and undisturbed as one might expect. In fact, the morphology itself implies some perturbative event in its recent evolution history: NGC 4254 shows a clear mode and a lopsided disk. In this respect it was argued earlier that in-falling H I gas clumps, which are visible in radio data and do not emit in H, might be responsible for triggering deviations from pure grand design structure (Phookun et al., 1993). So have we reason to believe that NGC 4254 is far from equilibrium? This is hard to tell, because on the other hand we find plenty of arguments that a stable propagating density wave in NGC 4254 is responsible for its morphology. This galaxy shows many similarities to the spiral galaxy NGC 5247 whose morphological and dynamical properties were discussed by Patsis et al. (1997), based on SPH simulations. We note that in our best model, the strong bisymmetric part of the K’ spiral, ends well inside the corotation radius, although fainter extensions reach out to it. This picture is in agreement with the 4:1 SPH models of Patsis et al. (1997). Assuming corotation close to the characteristic bifurcation of the arms at kpc on the other hand, we do not obtain satisfactory results (upper left frame in Fig. 5). Based on this is seems appropriate to conclude that NGC 4254 is at least close to an equilibrium state and suited for a case study.
6 CONCLUSIONS
We performed hydrodynamical simulations to predict the gas velocity field in a variety of potentials for the spiral galaxy NGC 4254 and compared them to observations. These potentials consisted of different combinations of luminous (non-axisymmetric spiral) and dark matter (axisymmetric) components. The resulting gas spiral morphology reflects very accurately the morphology of the galaxy and allows us to specify the corotation radius or the pattern speed of the spiral structure quite precisely. It is noteworthy that within the error range given, the best matching pattern speed does not depend on the mass fraction of the stellar disk relative to the dark halo. For NGC 4254 we find that the corotation lies at kpc, or at about 2.1 exponential K’-band disk scale lengths. From the kinematics of the gas simulations we could rule out a maximal disk solution for NGC 4254. Within the half-light radius the dark matter halo still has a non-negligible influence on the dynamics of NGC 4254: specifically, our fraction f implies that of the total mass within 2.2 K-band disk scale lengths is dark. However, the comparison of the simulated gas velocity field to the observed rotation curves turned out to be a delicate matter. The observed rotation curves show a significant number of bumps and wiggles, presumably resulting from non-gravitational gas effects, that complicate the identification of wiggles induced by the massive spiral arms. Therefore, beyond concluding that the disk is less than 85% of maximal, we were unable to specify a particular value for the disk mass or to test the results from Bottema (1997) or Courteau and Rix (1999). But already with this statement we differ from the conclusions of Debattista and Sellwood (2000) and Weiner et al. (2001b), who argue that their conclusions for maximal disks of barred galaxies also hold for non-barred spirals. Since we only analyzed one galaxy so far it is inappropriate to state here that the centers of unbarred spirals, what we still consider NGC 4254 to be despite its small bar-like structure in the very center, are generally governed by dark matter.
In the near future we will extend this analysis to more galaxies from our sample. This will put us into the position to decide, whether single galaxies differ very much in their dark matter content, or if the bulk of the spirals show similar characteristics.
References
- Aalto et al. (1999) Aalto, S., Hüttemeister, S., Scoville, N. Z., Thaddeus, P. 1999, ApJ, 522, 165
- Adler and Westpfahl (1996) Adler, D. S.; Westpfahl, D. J. 1996, AJ, 111, 735
- for a review cf., Athanassoula (1984) Athanassoula, E. 1984, in Physics Reports (Review Section of Physics Letters) 114, Nos. 5 & 6, (Amsterdam: North-Holland Phys. Publ.), 319
- Athanassoula et al. (1987) Athanassoula, E., Bosma, A., & Papaioannou, S. 1987, A&A, 179, 23
- Beauvais and Bothun (1999) Beauvais, C., & Bothun, G. 1999, ApJS, 125, 99
- Bell and de Jong (2001) Bell, E. F., & de Jong, R. S. 2001, ApJ, 550, 212
- Bizenberger et al. (1998) Bizenberger, P., McCaughrean, M., Birk, C., Thompson, D., & Storz, C. 1998, SPIE, 3354, 825
- Blumenthal et al. (1986) Blumenthal, G. R., Faber, S. M., Flores, R., & Primack, J. R. 1986, ApJ, 301, 27
- Bottema (1997) Bottema, R. 1997, A&A, 328, 517
- Broeils and Courteau (1997) Broeils, A. H., & Courteau, S. 1997, in ASP Conf. Ser. 117, Dark and Visible Matter in Galaxies and Cosmological Implications, ed. M. Persic, & P. Salucci, (San Francisco: ASP), 74
- e.g., Canzian et al. (1993) Canzian, B., Allen, R. J., & Tilanus, R. P. J. 1993, ApJ, 406, 457
- Canzian and Allen (1997) Canzian, B., & Allen, R. J. 1997, ApJ, 479, 723
- Courteau and Rix (1999) Courteau S., & Rix H.-W. 1999, ApJ, 513, 561
- Debattista and Sellwood (1998) Debattista V. P., & Sellwood J. A. 1998, ApJ, 493, L5
- Debattista and Sellwood (2000) Debattista V. P., & Sellwood J. A. 2000, ApJ, 543, 704
- Dehnen and Binney (1998) Dehnen, W., & Binney, J. 1998, MNRAS, 294, 429
- Donner and Thomasson (1994) Donner, K. J., & Thomasson, M. 1994, A&A, 290, 785
- Elmegreen et al. (1992) Elmegreen, B. G., Elmegreen, D. M., & Montenegro, L. 1992, ApJS, 79, 37
- Englmaier and Gerhard (1997) Englmaier, P., & Gerhard, O. 1997, MNRAS, 287, 57
- Englmaier and Gerhard (1999) Englmaier, P., & Gerhard, O. 1999, MNRAS, 304, 512
- Federspiel et al. (1998) Federspiel, M., Tammann, G. A., & Sandage, A. 1998, ApJ, 495, 115
- Frei et al. (1996) Frei, Z., Guhathakurta, P., Gunn, J. E., & Tyson, J. A. 1996, AJ, 111, 174
- Fukushige and Makino (1997) Fukushige, T., & Makino, J. 1997, ApJ, 477, L9
- González and Graham (1996) González, R. A., & Graham, J. R. 1996, ApJ, 460, 651
- Gnedin et al. (1995) Gnedin, O. Y., Goodman, J., & Frei Z. 1995, AJ, 110, 1105
- Grosbøl et al. (2000) Grosbøl, P. J., Block, D. L., & Patsis, P. A. 2000, in ASP Conf. Ser. 197, Dynamics of Galaxies, ed. F. Combes, G. A. Mamon, & V. Charmandaris, (San Francisco: ASP), 191
- e.g. Kauffmann et al. (1999) Kauffmann G., Colberg J., Diaferio A., & White S. D. M. 1999, MNRAS, 303, 188
- Kent (1986) Kent, S. M. 1986, AJ, 91, 1301
- Knapen and Beckman (1996) Knapen, J. H., & Beckman, J. E. 1996, MNRAS, 283, 251
- Kuijken (1995) Kuijken, K. 1995, in IAU Symp. Proc. 164, Stellar Populations, ed. P. C. van der Kruit, & G. Gilmore, (Dordrecht: Kluwer), 195
- Lin and Shu (1964) Lin, C. C., & Shu, F. H. 1964, ApJ, 140, 646
- Lubow et al. (1986) Lubow, S. H., Balbus, S. A., & Cowie, L. L. 1986, ApJ, 309, 496
- Maller et al. (2000) Maller, A., Simard, L., Guhathakurta, P., et al. 2000, ApJ, 533, 194
- Miralda-Escude (2000) Miralda-Escude, J. 2000, ApJ, submitted, (astro-ph/0002050)
- Moore (1994) Moore, B. 1994, Nature, 370, 629
- Moore et al. (1999) Moore, B., Ghigna, S., Governato, F., et al. 1999, ApJ, 524, L19
- Navarro et al. (1996) Navarro J., Frenk C., & White S. D. 1996, ApJ, 462, 563
- Navarro et al. (1997) Navarro J., Frenk C., & White S. D. 1997, ApJ, 490, 493
- Ostriker (2000) Ostriker, J. P. 2000, Phys. Rev. Lett., 84, 5258
- Patsis et al. (1991) Patsis, P. A., Contopoulos, G., & Grosbøl, P. J. 1991, A&A, 243, 373
- Patsis et al. (1997) Patsis, P. A., Grosbøl, P. J., & Hiotelis, N. 1997, A&A, 323, 762
- Patsis and Kaufmann (1999) Patsis, P. A., & Kaufmann, D. E. 1999, A&A, 352, 469
- Phookun et al. (1993) Phookun, B., Vogel, S. N., & Mundy, L. G. 1993, ApJ, 418. 113
- Pierce and Tully (1988) Pierce, M. J., & Tully, R. B. 1988, ApJ, 330, 579
- Prendergast and Xu (1993) Prendergast, K. H., & Xu, K. 1993, J. Comput. Phys., 109, 53
- Quillen and Pickering (1997) Quillen, A. C., & Pickering, T. E. 1997, AJ, 113, 2075
- Quillen (1999) Quillen, A. C. 1999, in ASP Conf. Ser. 182, Galaxy Dynamics, ed. by D. Merritt, M. Valluri, & J. Sellwood, (San Francisco: ASP), 251
- Regan et al. (1996) Regan, M. W., Teuben, P. J., Vogel, S. N., & van der Hulst, T. 1996, AJ, 112, 2549
- Rix and Rieke (1993) Rix, H.-W., & Rieke, M. 1993, ApJ, 418, 123
- Rix and Zaritsky (1995) Rix, H.-W., & Zaritsky, D. 1995, ApJ, 447
- e.g. Roberts (1969) Roberts, W. W. 1969, ApJ, 158, 123
- Sackett (1997) Sackett, P. 1997, ApJ, 483, 103
- Sakamoto et al. (1999) Sakamoto, K., Okumura, S. K., Ishizuki, S., & Scoville, N. Z. 1999, ApJS, 124, 403
- Salucci and Persic (1999) Salucci, P., & Persic, M. 1999, A&A, 351, 442
- Schweizer (1976) Schweizer, F. 1976, ApJS, 31, 313
- Slyz and Prendergast (1999) Slyz, A., & Prendergast, K. H. 1999, A&AS, 139, 199
- Sandage and Tammann (1976) Sandage A., & Tammann, G. A. 1976, ApJ, 210, 7
- Spergel and Steinhardt (2000) Spergel, D. N., & Steinhardt, P. J. 2000, Phys. Rev. Lett., 84, 3760
- Steinmetz and Müller (1995) Steinmetz, M., & Müller, E. 1995, MNRAS, 276, 549
- Thuan and Gunn (1976) Thuan, T. X., & Gunn, J. E. 1976, PASP, 88, 543
- van Albada et al. (1985) van Albada, T. S., Bahcall, J. N., Begeman, K., & Sancisi, R. 1985, ApJ, 295, 305
- van Albada et al. (1986) van Albada, T. S., & Sancisi, R. 1986, Phil. Trans. of the Roy. Soc. (London), Ser. A 320, no. 1556, 447
- Visser (1980) Visser, H. C. D. 1980, A&A, 88, 159
- Weiner et al. (2001a) Weiner, B. J., Williams, T. B., van Gorkom, J. H., & Sellwood, J. A. 2001, ApJ, 546, 916
- Weiner et al. (2001b) Weiner, B. J., Sellwood, J. A., & Williams, T. B. 2001, ApJ, 546, 931
- for a review, see Xu (1998) Xu, K. 1998, Gas-Kinetic Schemes for Unsteady Compressible Flow Simulations, VKI report 1998-03 von Karmann Institute Lecture Series