Ram pressure stripping and galaxy orbits:
The case of the Virgo cluster
Abstract
We investigate the role of ram pressure stripping in the Virgo cluster using N-body simulations. Radial orbits within the Virgo cluster’s gravitational potential are modeled and analyzed with respect to ram pressure stripping. The N-body model consists of 10 000 gas cloud complexes which can have inelastic collisions. Ram pressure is modeled as an additional acceleration on the clouds located at the surface of the gas distribution in the direction of the galaxy’s motion within the cluster. We made several simulations changing the orbital parameters in order to recover different stripping scenarios using realistic temporal ram pressure profiles. We investigate systematically the influence of the inclination angle between the disk and the orbital plane of the galaxy on the gas dynamics. We show that ram pressure can lead to a temporary increase of the central gas surface density. In some cases a considerable part of the total atomic gas mass (several M⊙) can fall back onto the galactic disk after the stripping event. A quantitative relation between the orbit parameters and the resulting Hi deficiency is derived containing explicitly the inclination angle between the disk and the orbital plane. The comparison between existing Hi observations and the results of our simulations shows that the Hi deficiency depends strongly on galaxy orbits. It is concluded that the scenario where ram pressure stripping is responsible for the observed Hi deficiency is consistent with all Hi 21cm observations in the Virgo cluster.
1 Introduction
Since Gunn & Gott (1972) have introduced the concept of ram pressure stripping, which can affect galaxies moving inside the Intracluster Medium (ICM) of a galaxy cluster, this mechanism has been invoked to explain different observational phenomena as the HI deficiency of spiral galaxies in clusters (Chamaraux et al. 1980 , Bothun et al. 1982, Giovanelli & Haynes 1985) or the lower star formation activity of cluster spiral galaxies (e.g. Dressler et al. 1999, Poggianti et al. 1999).
Some other mechanisms have been proposed affecting spiral galaxies in clusters, among which:
-
•
galaxy–galaxy interactions (galaxy “harassment”; Moore et al. 1996, 1998)
-
•
galaxy–cluster gravitational interaction (Byrd & Valtonen 1990, Valluri 1993)
All these kinds of interaction have in common that they can in principle remove the neutral gas from a galaxy inducing a decrease of its star formation activity.
The strength of these interactions depends crucially on galaxy orbits. Radial orbits allow galaxies to go deeper into the cluster potential where their velocity increases considerably and where the galaxy density and the density of the ICM is substantially higher. Dressler (1986) analyzed Giovanelli & Haynes (1985) data showing that Hi deficient spiral galaxies are on radial orbits. Numerical simulations (Ghigna et al. 1998) showed that galaxy halos evolving within the cluster settle on isotropic orbits with a median ratio of pericentric to apocentric radii of 1:6.
The recent analysis of a spectroscopic catalog of galaxies in ten distant clusters (Dressler et al. 1999, Poggianti et al. 1999) has shown that the galaxy populations of these clusters are characterized by the presence of a large number of post starburst galaxies. Poggianti et al. (1999) concluded that the most evident effect due to the cluster environment is the quenching of star formation rather than its enhancement. They found two different galaxy evolution timescales in clusters. (i) A rapid removal of the gas ( 1 Gyr). (ii) A slow transformation of morphology (several Gyr). They stated that the mechanism responsible for the fast gas removal without changing the galaxy’s morphology is very probably ram pressure stripping. Furthermore, Couch et al. (1998), using HST data, claimed that there are fewer disturbed galaxies than predicted by the galaxy harassment model. They suggested that ram pressure stripping by the hot ICM truncates star formation.
In the local universe, the existence of a large number of post starburst galaxies in the Coma cluster seems to indicate a triggering of the star formation activity by effects which are related to the cluster environment (Bothun & Dressler 1986, Caldwell et al. 1993). Caldwell & Rose (1997) observed an enhanced number of post starburst galaxies within cluster environments. On the contrary, Zabludoff et al. (1996) found that interactions with the cluster environment, in the form of the intracluster medium or cluster potential, are not essential for ”E+A” formation. HST images of the Coma starburst and post starburst galaxies (Caldwell, Rose, & Dendy 1999) revealed that star formation takes mainly place in the inner disk of these galaxies and is suppressed in the outer disk. If the starburst is related to the cluster environment, ram pressure stripping can naturally account for these characteristics.
The best place to study the gas removal due to ram pressure is the Virgo cluster as it is the closest cluster which can be observed in great detail. Most of the spiral galaxies seem to have entered the cluster only recently (within several Gyr, Tully & Shaya 1984). About half of them became Hi deficient (Giovanelli & Haynes 1985). Their Hi disk sizes are considerably reduced (van Gorkom & Kotanyi 1985, Warmels 1988, Cayatte et al. 1990, 1994). Concerning the stellar content, their intrinsic color indices are not significantly different from field galaxies of the same morphological type (Gavazzi et al. 1991, Gavazzi et al. 1998). But despite the Hi deficiency, cluster galaxies do not show a reduced CO content (Kenney & Young 1989, Boselli et al. 1997) neither a reduced infrared luminosity (Bicay & Giovanelli 1987). This means that the neutral gas was removed without affecting the molecular component and without changing colors very much. The only interaction cited above producing this signature is ram pressure stripping.
Very few simulations have been done to quantify ram pressure stripping using Eulerian hydrodynamic (Takeda, Nulsen, & Fabian 1984, Gaetz, Salpeter & Shaviv 1987; Balsara, Livio, & O’Dea 1994) or SPH codes (Tosa 1994; Abadi, Moore, & Bower 1999). We use a sticky particles model in which each particle represents a cloud complex with a given mass dependent radius. The viscosity of the clumpy ISM is due to inelastic collisions between the particles. The effect of ram pressure is modeled as an additional acceleration on the particles located in the direction of the galaxy’s motion.
This article is devoted to the question if ram pressure stripping can account for the observed Hi deficiency, Hi distributions, and velocity fields of spiral galaxies in the Virgo cluster. Furthermore we investigate possible star formation mechanisms related to a ram pressure stripping event. We first discuss radial galactic orbits within the cluster gravitational potential (Section 2). The model simulating the neutral gas content of an infalling galaxy is described in Section 3, followed by the detailed description of the simulations (Section 4). The evolution of the stripped gas in the intracluster medium is investigated in Section 5. In Section 6 we give the results of these simulations and discuss them in Section 7. We confront observations of various quantities of spiral galaxies with the knowledge acquired with the help of the simulations (Section 8) and give possible explanations for their dynamical and physical state (Section 9 and 10). The summary and conclusions are given in Section 11.
We adopt a velocity of 1150 km s-1 for the Virgo cluster (Huchra 1988) and a distance of 17 Mpc.
2 Galaxy orbits
The hot intracluster medium (ICM) of density exerts a ram pressure: on a galaxy, which moves with a velocity through it. With decreasing distance to the cluster center the galaxy’s velocity, the ICM density, and thus ram pressure increase. Therefore, the efficiency of ram pressure stripping depends strongly on the shape of the galaxy orbit within the cluster. Radial orbits lead a galaxy deeper into the cluster core where ram pressure stripping is the most important. We investigate in this section the influence of the shape of radial orbits on the efficiency of ram pressure stripping.
The gas in the galactic disk is removed if the ram pressure of the ISM is greater than the restoring gravitational force per unit area provided by the galaxy’s disk (Gunn & Gott 1972). The stripping radius can be estimated using the equation established by Gunn & Gott (1972) with (Binney & Tremaine 1987):
| (1) |
where is the stellar/gas surface density, is the ICM density, is the rotation velocity, and is the galaxy’s velocity within the cluster. We assume cm-2 and km s-1. The minimum ram pressure to affect the atomic gas disk can be determined by setting kpc. For our model galaxy this leads to cm-3 (km s-1)2. Fig. 1 shows the galaxy velocity as a function of the ICM density for constant values of the ram pressure . The area below the solid line corresponds to the part of the parameter space where 500 cm-3 (km s-1)2, i.e. where ram pressure is not effective. The curves correspond to a values of =1000, 2000, 5000, 10000 cm-3 (km s-1)2 that we used in our simulations. For the simulations we varied the inclination angle between the disk and the orbital plane: =0o, 20o, 45o, 90o. With this definition of the inclination angle, =0o means edge-on stripping and =90o face-on stripping. For our model, this represents the physically most meaningful definition and has the advantage that it leads to simple fitting functions of our numerical results.
We took a -model (Cavaliere & Fusco-Femiano 1976) to describe the total mass density and the ICM density:
| (2) |
where is the core radius, is the slope parameter, and is the central density. The values for the ICM are: =0.5, =13.4 kpc, and cm-3. For the total mass profile we used =1, =0.32 Mpc, and M⊙pc-3. This gives a total mass of M⊙ at a radius of 1 Mpc (Schindler, Bingelli, & Böhringer 1999). We have calculated orbits of test particles within the gravitational potential given by this mass distribution.
The giant elliptical galaxy M86 has a total mass of about one tenth of the whole cluster mass (Schindler et al. 1999). The perturbation of the total gravitational field due to M86 is thus not negligible. We have added the gravitational potential corresponding to M86 (=0.5, =74.2 kpc, and M⊙pc-3). First, we have made test runs where we have put M86 on an elliptical orbit around M87. The results for the orbiting perturber (M86) are that (i) M87 begins also to move and (ii) the additional mass distribution perturbs the trajectories of the test galaxy producing a wide variety of radial orbits with different impact parameters. Without the perturbing gravitational potential the orbits would lie in one single plane and the impact parameter, i.e. the closest approach to the cluster center, would stay constant. Second, we have fixed M86 in space. In this case the galaxy orbits are perturbed in the same way as in the previous case. We can thus conclude that in both cases the presence of M86 near M87 changes significantly the trajectories of galaxies on radial orbits. For simplicity we have chosen to fix M86 in space.
Fig. 2 shows the orbits calculated with the fixed gravitational potential of M87 and M86. The asymmetric gravitational potential leads to a variation of the impact parameter and the maximum velocity for each orbit. The initial conditions were fixed such that the resulting maximum ram pressure varies between 1000 and 5000 cm-3 (km s-1)2. If a spiral galaxy is gravitationally bound to the cluster, these high eccentricities are needed in order to obtain the highest ram pressure maxima. However, for values of the maximum ram pressure smaller than 3000 cm-3 (km s-1)2 slightly less eccentric orbits are also possible. The smallest impact parameter, i.e. the closest approach to the cluster center, is 90 kpc with a maximum velocity of 2200 km s-1. A small change of the initial conditions, resulting in an impact parameter of 70 kpc, leads to a maximum ram pressure of 10000 cm-3 (km s-1)2. Given the uncertainties of the determination of the enclosed mass and the ICM density profile, we think that this extreme orbit is still realistic for the Virgo cluster. The largest impact parameter is 200 kpc. The timescale between two passages through the cluster core is about 1010 yr. A galaxy will therefore have at most a few passages during its lifetime within the cluster. Thus the simulation does not trace the trajectory of one single galaxy but creates a variety of orbits corresponding to different initial conditions. Nevertheless, it is not excluded that a galaxy can have two passages through the cluster core.
We define the normalized ram pressure as
| (3) |
where =10-4 cm-3 and =1000 km s-1 are representative averaged values. The resulting normalized ram pressure of the orbits shown in Fig. 2 can be seen in Fig. 3. This graph illustrates that the perturbation of the galaxy orbits by M86 can result in a change of the ram pressure strength up to 50% because of the small core radius of the ICM distribution. A small change of the impact parameter leads to a considerable change of the ICM density, whereas for values of the impact parameters between 100 and 200 kpc the change of the maximum galaxy velocities is only of the order of 10%. For these radial orbits ram pressure dominates the thermal pressure of the ICM ( K) for distances less than one Abell radius ( Mpc) as can be seen in Fig. 4.
In order to compare these orbits directly with observations, we plot in Fig. 5 the line-of-sight (LOS) velocity with respect to the cluster mean velocity as a function of the projected distance to the cluster center (M87). The number of orbits is sufficient to be representative for radial orbits over the whole volume of the Virgo cluster. The region above the envelope of these curves corresponds to more circular orbits. This diagram will be used later on to compare the model orbits directly with observations.
We can now address the question if we can constrain the orbital shape of Hi deficient galaxies. As stated above, a minimum ram pressure of cm-3 (km s-1)2 is necessary in order to affect the atomic gas disk. In the case of circular orbits the galaxy velocity has the Keplerian value , where is the gravitational potential of the cluster. This means that in the Virgo cluster a galaxy with a rotation velocity of km s-1, which is on a circular orbit, must be closer than 250 kpc (50′) to the cluster center in order to be affected significantly by ram pressure. If spiral galaxies have been accreted only recently, it is not probable that they are on circular orbits with a such small distance to the cluster center. On the observational side, Hoffman, Helou, & Salpeter (1988) found a few Hi rich dwarf galaxies within a radius of 5o around M87. These galaxies are much more vulnerable to ram pressure stripping, because of their lower gravitational potential. At least some of these dwarfs must evolve on circular orbits with radii smaller than 1 Mpc, where they have never been stripped by ram pressure.
In the case of highly eccentric orbits, the maximum orbital velocity is given by the escape velocity . The impact parameter must be smaller than 400 kpc (1.3o) in order to obtain cm-3 (km s-1)2. For more massive galaxies ( km s-1) the maximum impact parameter is still smaller. The minimum impact parameter of 90 kpc excludes a gravitational interaction of the galaxy with M87.
The impact parameters of the orbits shown in Fig. 2 are in the range between 90 and 200 kpc giving rise to maximum ram pressure 1000–5000 cm-3 (km s-1)2. We will show that galaxies on these orbits will have an Hi deficiency after a passage through the cluster center.
3 The model
There are different ways to model the interstellar gas numerically: (i) hydrodynamical, (ii) SPH, and (iii) sticky particle models. Each class has its advantages and limits. Since the ISM is neither a continuous medium (hydrodynamics, SPH) nor exclusively made of clouds (sticky particles), one has to chose the class which is well adapted for the investigated astrophysical problem. In the following we will motivate the choice of our model.
The interstellar Hi gas is a clumpy medium (see e.g. Kim et al. 1998 for the LMC). In the Galaxy roughly half of the interstellar Hi is in the warm phase ( K) with a volume filling factor of 0.5. The other half is in the form of cold (80 K) and dense clouds with a filling factor of 0.01 (Kulkarni & Heiles 1988). If they are in pressure equilibrium with the rest of the ISM at K cm-3, they have a density of 40 cm-3. The largest clouds have column densities of cm-2. On the largest scale, three dimensional structures of the atomic gas phase are major Hi concentrations around dark clouds and newly formed stars. They have column densities of cm-3 and masses of M⊙ (Kulkarni & Heiles 1988). Thus, the cold atomic phase of the ISM is well represented by discrete particles. Concerning the warm neutral phase, Murakami & Babul (1999) have shown in their hydrodynamical simulations of the effects of ram pressure on an elliptical galaxy that the continuous ISM tends to be stripped in the form of distinct clouds if they included the external ICM pressure. These clouds have densities cm-3 and radii pc, resulting in a column density of cm-3. We therefore think that the warm neutral phase, which is subjected to an external pressure due to the surrounding ICM and to ram pressure forces, can also be modeled by distinct particles.
These considerations motivate our approach to model the entire atomic phase of the ISM as sticky particles where each particle represents a gas cloud complex. We assume that the clouds have a constant column density. The relevant physical property of the ISM with respect to ram pressure is the column density of the gas/clouds. It is adapted to observed values.
The effect of ram pressure is simulated as an additional acceleration applied on the clouds which are exposed to the ICM in the direction of the galaxy’s motion within the cluster.
3.1 The model galaxy
Since we do not want to include gravitational interactions, we let the gas clouds evolve in a given analytical gravitational potential. It consists of two spherical components and a disk (Allen & Santillán 1991):
-
•
the dark matter halo potential which is given by
(4) (5) where
(6) R is the distance to the galaxy center, M⊙, and =12 kpc.
-
•
The bulge potential which is given by
(7) where M⊙ and =387 pc.
-
•
The disk potential which is given by
(8) where , =2.6 M⊙, =2.7 kpc, and =250 pc.
We fix the optical diameter of the disk at 20 kpc (7.5 disk scale lengths). We have included selfgravity between the cloud complexes. Fig. 6 shows the resulting rotation curves after a disk evolution of 109 yr for the different components as well as the decomposition and the total model rotation curve. The latter is used as initial conditions for our simulations. We thus obtained a constant rotation curve of 140 km s-1. This rotation velocity corresponds to a medium mass spiral galaxy. Fig. 7 shows the Hi cloud distribution in direction after 109 yr. We end up with a realistic height of the Hi layer of 1000 pc at a radius of 10 kpc. The initial Hi diameter is =30 kpc.
The cloud mass distribution is (Knude 1981). The initial total gas mass of the galaxy is M⊙, the total number of clouds is 10 000. We adopt a constant Hi column density for all clouds (Sanders, Scoville & Solomon 1985) which is fixed at cm-2. This value is consistent with the measurements made by Rots et al. (1990) on nearby galaxies. Assuming the surface density to be constant has the advantage that the acceleration due to ram pressure is the same for all clouds disregarding their masses. This leads to the following mass-radius relation which is relevant for the collision rate:
| (9) |
where is the gas surface density of one cloud. In reality the number of Hi clouds is much larger than the number of particles in our model. To compensate this effect we have chosen the factor in the way that the mean free path of one cloud is the same for 10 000 clouds as for a realistic cloud number.
In addition, in the interior of the galaxy gas clouds become denser building molecular cores. This results in smaller cloud sizes and higher surface densities. As the atomic gas represents the outer layer of these clouds, they can be hardly pushed by the ram pressure. We take this effect into account by adding a factor in the equation for the acceleration due to ram pressure:
| (10) |
where =2 kpc for the Virgo cluster). This profile is consistent with the CO(1–0) observations of Virgo cluster spirals (Kenney & Young 1988).
When orbiting around the galaxy center, the clouds can have inelastic collisions. During these collisions they can exchange mass and larger clouds can grow through coalescence. The outcome of a collision can be one (coalescence), two (mass exchange), or three fragments (fragmentation). Let the radius of the first cloud be , that of the second cloud . Let the impact parameter be , the velocity of the fragment , and the escape velocity . We follow the prescriptions of Wiegel (1994):
-
•
for :
fragmentation -
•
for and :
mass exchange -
•
for and :
coalescence
This description is similar to that of Combes & Gérin (1985)
or Klarić (1995). The search for the next neighbors is done with
the help of a treecode (Barnes & Hut 1986).
The integration of the ordinary differential equation is done with the
Burlisch-Stoer method (Stoer & Burlisch 1980) using a Richardson
extrapolation and Stoermer’s rule.
This method advances a vector of dependent variables from a point
to a point by a sequence of substeps.
Thus, the initial timestep is divided subsequently into
=2, 3, 4, etc. substeps. At the end the solution
of is extrapolated and an error can be estimated.
The size of the timestep is adaptive and linked to the estimated
error of the extrapolation. This error is normalized by the
values of the distance covered during the last timestep and the velocity
of each particle. The error level for acceptance of the extrapolated
solution is a free parameter and has to be adapted to the
physical problem treated. For a relative error level
the Courant criterion is fulfilled for each timestep.
The collisions are evaluated at each timestep and only those
which appear for all sequences are taken into account.
We adopt the strategy to chose the error level in a way to have timesteps
of the order of several 104 yr.
Ram pressure is included as an additional acceleration of those clouds which are exposed to the ICM in the direction of the galaxy motion. Fig. 8 illustrates this effect: clouds located inside the disk are protected by clouds on the surface due to their finite size (this depends of course strongly on the inclination angle of the galaxy with respect to the orbital plane). As it can be seen in Fig. 2 the galaxy trajectories near the cluster center are quasi linear. This means that we do not have to change the wind direction during the simulation.
4 The simulations
Fig. 9 shows the profile of two ram pressure stripping events of Fig. 3 as a dashed line. In our simulations we approximated this ram pressure profile with a Lorentzian profile (Fig. 9 solid line):
| (11) |
where is the maximum ram pressure at the smallest distance to the cluster center and is the duration of the event. The simulations were started at =-500 Myr. For a fixed , is chosen in order to obtain a constant ram pressure at =-500 Myr: . This procedure reproduces best the ram pressure profiles of the model orbits (Fig. 3).
These values together with the wind direction and the resulting final parameters for each run can be seen in Table 1. The columns are the following: Col. (1): RUN. Col. (2): Maximum ram pressure in units of . Col. (3): Inclination angle with respect to the orbital plane in degrees. We want to recall here that =0o means edge-on stripping and =90o face-on stripping. Col. (4): Time between the beginning of the stripping (defined by the moment when the total gas mass within 25 kpc M⊙) and the galaxy’s closest passage to the cluster center. Col. (5): Radial distance corresponding to Col. (4) assuming a constant velocity of the galaxy with respect to the cluster center of =1700 km s-1. Col. (6): Final Hi diameter in kpc. Col. (7): Final central surface density in M⊙ pc-2. Col(8): Final Hi deficiency (see Sect. 6.1). Col.(9): Re-accreted gas mass in M⊙. Col.(10): Re-accreted gas mass divided by the stripped gas mass. The final Hi diameter is defined by a limiting column density of cm-2. Following Cayatte et al. (1994), the radial profile was determined by averaging the model distribution in rings of integrated column density. The central surface density is defined as the mean density over the inner part of the disk out to a quarter of the optical radius. For the calculation of the stripped and the re-accreted gas mass we used the enclosed mass within a radius of 20 kpc and a height of 1 kpc. For RUN A(10,0) M⊙ of atomic gas are pushed to radii greater than 20 kpc and then fall back within 400 Myr. Thus, the ratio between stripped and re-accreted gas is greater than one.
We have made 16 runs using different disk inclinations with respect to the orbital plane and different values for the maximum ram pressure. We only use values for the maximum ram pressure which are high enough to show a visible deformation of the Hi distribution. In Fig. 10 we show the final Hi radius of our simulations as a function of the linearized estimated radius using the formula of Gunn & Gott (1972): kpc, where cm-2 and km s-1. The additional length is due to the length scale of the molecular gas distribution (). The solid line corresponds to . As expected, the estimated stripping radius using Gunn & Gott’s formula is well reproduced for an inclination angle (face-on stripping) .
In order to generalize Gunn & Gott’s formula for inclination angles , we searched for a simple correlation between the stripping radius and (, ). Since we did not succeed, we conclude that it can be dangerous to derive the stripping parameters only on the basis of the final Hi diameter. In particular, taking the velocity component perpendicular to the disk plane does not reproduce the final Hi radii of our simulations. We will show in Section 7.4 that the Hi deficiency is much better suited.
In order to give an idea of how ram pressure acts in detail, Fig. 11 shows an example for an edge-on stripping process (RUN C(50,0)). The ram pressure maximum occurs at t=0 yr. The wind direction is indicated by the arrows whose length is proportional to ram pressure. At Myr, a density enhancement begins to grow in the directions of the galaxy’s motion. At 70 Myr, the gas whose rotation velocity is parallel to the wind direction is accelerated and driven out of the galaxy leading to an arm-like structure parallel to the wind direction. At the opposite side where the gas clouds are decelerated by the wind, a second much less pronounced arm forms. At =150 Myr ram pressure has completely ceased and the dynamics are determined by rotation and re-accretion. The main arm moves to the north-west of the galaxy due to its initial angular momentum. At the same time, the gas begins to fall back to the galaxy in the north and south-west. This infalling gas is forming a second arm in the south-west. At 300 Myr a density enhancement in the east is observed which is due to the infalling material from the north. It is interesting to notice that the gas within the disk of the galaxy forms a leading m=1 spiral structure.
We show snapshots of RUN J(20,45) in Fig. 12 as an example of an out of plane stripping beginning at with time differences of Myr. The galaxy is seen edge-on and is moving in the south-east direction, i.e. the wind is coming from the south-east. This wind direction is indicated by the arrows whose length is proportional to ram pressure. The ram pressure maximum occurs at =0 yr. At -90 Myr the disk is already slightly deformed in -direction. When ram pressure is at maximum the outer parts of the gas disk are pushed in the wind direction. Ram pressure exceeds the threshold of early (-300 Myr) for the given Lorentzian profile. An important distortion of the gas distribution can be observed at 0 yr. The gas is driven out of the galaxy in the direction of the wind and rotates at the same time. This creates the western arm which develops between =-10 Myr and =100 Myr. Since the duration of the ram pressure event () is a considerable fraction of the rotation period, the out of plane gas in the region where its motion due to rotation and the motion of the ICM are opposite is compressed. This compressed region corresponds to the arm which develops in the north of the galaxy. For 200 Myr the wind has completely ceased and the evolution of the gas distribution is due to rotation and re-accretion of the stripped gas. At the end of the simulation (=500 Myr) a considerable part of the stripped ISM is located within a radius of 15 kpc outside the disk. Even at 500 Myr after the galaxy’s closest passage to the cluster center the column density of the gas located outside the galactic disk is of the order of 1020 cm-2.
5 The fate of the stripped gas
We now address the question if such a large structure can be observed and in which phase the stripped gas is re-accreted. Murakami & Babul (1999) found that, if the thermal gas pressure of the ICM is taken into account, massive (105-106 M⊙) neutral gas clouds are stripped. They speculate that they might be able to survive in the hot ICM. Can an Hi blob survive long enough (i.e. during several 108 yr) in a hostile environment like the ICM? In order to estimate the evaporation time of a stripped gas cloud, we follow Cowie & McKee (1977). The classical approximation for the evaporation rate breaks down when the electron mean free path becomes comparable or larger than the temperature scale height. In this case the classical heat flux exceeds the saturated heat flux and
| (12) |
where is the temperature of the ICM, is the ICM density, and is the cloud radius. Assuming =10 pc, =107 K, and =10-4 cm-3 leads to =422. The saturated evaporation time is given by
| (13) |
For a given cloud column density this gives yr. With an initial column density of cm-2, a stripped cloud evaporates within 108 yr. In the case of a magnetic field configuration which inhibits heat flux (e.g. a tangled magnetic field), this evaporation time can increase significantly (Cowie, McKee, & Ostriker 1981) and might attain several 108 yr.
On the other hand, if a stripped cloud leaves the galaxy, its main heating source, the stellar FUV radiation field, disappears. The thermal equilibrium gas temperature is then determined by heating due to the soft X-ray emission of the ICM and cooling due to the infrared line emission of Cii and Oi. Thus, when the cloud is stripped, cooling dominates heating, the gas cools down, becomes denser and begins to form H2 within a timescale of yr (Hollenbach & Tielens 1997). The only atomic hydrogen resides in the outer part of the clouds where the X-ray flux dissociates the molecular hydrogen. We will now estimate the column density of this Hi layer.
Maloney, Hollenbach, & Tielens (1996) have modeled the physical and chemical state of dense neutral gas exposed to an external X-ray source. We will extrapolate their results, which they have obtained for higher gas densities and X-ray fluxes. These authors assumed a power low X-ray spectrum, whereas in our calculations the radiation field is made of thermal bremsstrahlung. Despite this difference we can use their results, because for hot gas temperatures of order 107 K, the normalization constant for a given X-ray flux is not very different from that for a spectral index adopted by Maloney et al. (1996). In order to apply their calculations we have to make sure that photons with energies less than 100 eV do not contribute to the ionization of the molecular cloud. This translates to the condition that the ionized column density due to photons of eV must be much smaller than the total column density.
The ionizing photon flux is given by the integral of d over the range from 13.6 eV to 100 eV:
| (14) |
where is the X-ray flux in the ROSAT band. In equilibrium this gives rise to an ionized column density
| (15) |
where cm3s-1 is the recombination coefficient and is the electron density. Using erg cm-2s-1 (see below), K, and cm-3 gives cm-2. This is much smaller than the total cloud density of cm-2.
Maloney et al. (1996) showed that the transition between atomic and molecular hydrogen occurs if ergs cm3 s-1, where is the energy deposition rate per particle and is the local cloud density. This deposition rate is approximately
| (16) |
where is the hydrogen column density. In order to estimate the X-ray flux, we take the X-ray surface density profile given by Schindler et al. (1999)
| (17) |
with a core radius =13.35 kpc. is determined by , where =1.5 Mpc is the outer radius and ergs s-1 is the total X-ray luminosity (Böhringer et al. 1994). This gives ergs cm-2 s-1. At a distance of =0.15 Mpc from the cluster center the X-ray flux is ergs cm-2 s-1. With a hydrogen density of cm-3 the H/H2 transition thus occurs at a hydrogen column density of cm-2. If the neutral gas is in pressure equilibrium with the ICM ( K, cm-3 at =0.15 Mpc), it has a temperature of K.
The critical mass of an isothermal sphere (see e.g. Spitzer 1978) with an external pressure at the boundary of cm-3K is M⊙. If the magnetic field is of the order of a G, the critical mass might be as large as M⊙. If the temperature of the neutral gas is =200 K this critical mass becomes M⊙.
Such a cloud has a size of pc and a total column density of cm-2. Thus, only 10% of the total column density of these clouds is in atomic form visible in the Hi 21 cm line. The total column density of the stripped gas in Fig. 12 observed with a 20′′ beam (VLA C+D array configuration at 21 cm) is cm-2. Without evaporation the observed Hi column density would thus be cm-1. High sensitivity Hi 21cm observations of Virgo spiral galaxies with a distorted atomic gas distribution (see e.g. Phookun & Mundy 1995) have shown that low surface brightness structures appear when the sensitivity reaches several 1019 cm-2. This could be also the case for mildly Hi deficient galaxies , where re-accretion is important (see Table 1).
We suggest that most of the stripped gas, which can be found beyond the galactic disk, is thus very likely either hot ( K), ionized, and has a low density (), or molecular, cold ( K) and has a high density ( cm-3). In the second case, only 10% of the total gas column density is in atomic form due to X-ray dissociation.
Combined Hi, CO, H, and X-ray observations will give informations about the different phases of the ISM. High resolution interferometric observations of single cluster galaxies are necessary because they can be directly compared with our model snapshots. The detailed comparison between simulations and observations will be a crucial test for our model. It will allow to draw conclusions about the possible phase transitions (see above) of the ISM during the ICM–ISM interaction. We want to stress here that it is very important to compare both, the gas distribution and the velocity field in order to have as much constraints as possible. First results were already obtained with this technique: For the Virgo cluster spiral galaxy NGC 4522 Vollmer et al. (2000) succeeded in explaining extra planar H emission with a ram pressure scenario using one of the simulation snapshots. Vollmer et al. (2001) compared multi wavelength observations of the Coma cluster galaxy NGC 4848 with a simulation snapshot. They showed that all observations are consistent with the ram pressure scenario. Studies of other cluster galaxies are in progress. The observations of single cluster galaxies will show the way how to model the properties of the ISM (e.g. phase transitions, ionization, temperature) and their evolution during an ISM–ICM interaction.
6 Results
For the analysis of the simulation we concentrate on two time dependent parameters which are of particular relevance for the evolution of the galaxy:
-
•
the total gas mass within the galaxy’s radius =20 kpc and a constant height =1 kpc,
-
•
and the central Hi surface density of the galaxy with a spatial resolution of 2 kpc. This is a slightly different definition than that of Cayatte et al. (1994) (Table 1), which loses its meaning if .
The time dependence of these quantities is plotted in Fig. 13. For clarity, only the curves corresponding to are shown. The other curves are located between them. The different inclinations angle between the disk and the orbital plane are plotted with different linestyles. The maximum ram pressure strength of 100 corresponds to the lower thick graphs, the strength of 10 corresponds to the upper graphs in the same panel. We recall here that in these simulations the maximum ram pressure (i.e. the galaxy’s closest approach to the cluster center) occurs at yr, indicated by the vertical line in Fig. 13.
6.1 The total gas mass
Observationally this is the most important parameter because it gives directly the Hi deficiency, which is defined as
| (18) |
(Giovanelli & Haynes 1985), where is the observed quantity of the cluster galaxy and is averaged over a sample of field galaxies of morphological type and optical diameter . can be the Hi mass, the Hi mass divided by the luminosity, or the Hi mass divided by the square of the optical linear diameter. In each case is proportional to the Hi mass of a galaxy. Since in our model the galaxy’s diameter and luminosity do not change during the simulations, we define the model Hi deficiency as follows:
| (19) |
where and are the total Hi masses at the beginning and the end of the simulation, i.e. after =500 Myr. We want to point out three important issues:
(i) In the model, ram pressure stripping acts very rapidly. For a cloud at rest, the timescale to be accelerated to the escape velocity is given by Murakami & Babul (1999):
| (20) |
where is the cloud mass, is the cloud radius, and is the ram pressure of the hot ICM. Assuming 200 km s-1, 10 pc, M⊙, and gives yr. This has also been pointed out by Abadi et al. (1999). However, for a Lorentzian temporal profile ram pressure acts over a long period (up to several yr). Especially in the case of face-on stripping (), where the restoring forces due to the galaxy’s gravitational potential are minimum, stripping begins Myr before the closest passage to the cluster center. For decreasing this offset decreases.
(ii) The consequences of ram pressure stripping on the total gas Hi content can be observed earlier for higher maximum ram pressure values and higher inclination angles (Fig. 13 and Table 1). For a maximum ram pressure of 100 stripping begins Myr before ram pressure reaches its maximum, whereas for a maximum ram pressure of 20 and an inclination angle of stripping begins 50 Myr after ram pressure reaches its maximum. The effects of ram pressure stripping on non Hi deficient galaxies can thus be observed in some cases before the galaxy’s closest passage to the cluster center. In the case of nearly edge-on stripping the gas in the outer disk is mainly pushed to the inner part of the galactic disk in the beginning of the stripping (this corresponds to the wings of the Lorentzian profile). In this stage of the ISM–ICM interaction the gas distribution in the galactic disk can be very asymmetric.
The earliest moment when an Hi deficient galaxy () with a distorted gas distribution can be observed is Myr (for face-on stripping). If one assumes a constant mean velocity of km s-1 with respect to the ICM this corresponds to a minimum projected distance of from the cluster center. For where there is a pronounced asymmetric gas distribution within the galactic disk Myr which translated to a minimum projected distance of .
Fig. 14 resumes the situation. The critical distance at which the total enclosed mass within 20 kpc drops below M⊙ (solid lines) and M⊙ (dashed lines) is plotted as a function of the normalized ram pressure maximum for each simulation. Negative values indicate that the galaxy falls into the cluster center. The different symbols correspond to the different inclination angles (triangles: , diamonds: , stars: , crosses: ). The missing points or lines in the upper part of the graph are due to the fact that the enclosed mass never drops below the given limit, i.e. ram pressure is not strong enough. The maximum projected distance at which a distortion of the gas distribution of a non Hi deficient galaxy can be observed when it falls into the cluster core is (only in the case of face-on stripping). The maximum distance for inclination angles or Hi deficient galaxies is .
(iii) For low ram pressure maxima and low inclination angles a considerable amount of gas accretes back during 200–300 Myr (Fig. 13, Table 1). This accretion sets in at 100–200 Myr after the closest approach to the cluster center. In the case of edge-on stripping the accreted gas mass can attain values up to M⊙. This corresponds to a maximum mass accretion rate of 1 M⊙ yr-1. The fraction of the stripped gas which falls back to the galaxy depends primarily on the inclination angle between the disk and the orbital plane. For one given this fraction increases with decreasing maximum ram pressure. In the case of edge-on stripping more than 50% of the stripped gas can fall back to the galaxy, whereas in the case of face-on stripping only a few percent of the stripped gas re-accretes. The absolute value of the gas which falls back onto the galaxy as a function of the maximum ram pressure and the inclination angel can be approximated crudely:
| (21) |
Thus, the re-accreted mass is approximately proportional to , where is the component of the galaxy’s velocity within the cluster perpendicular to the disk plane.
6.2 The central surface density
If one assumes a Schmidt law (Schmidt 1959, Kennicutt 1983) for the global star formation rate of a galaxy, the central surface density is directly linked to the star formation activity in the central part of the galactic disk. Due to the discreteness of the model and the missing resolution in the galaxy center this parameter has a large scatter. For all simulations stays constant at the initial value until Myr. In the case of face-on stripping () begins to decrease at Myr. It drops within Myr to its minimum value and then stays constant. The final central surface density decreases with increasing maximum ram pressure. For the highest ram pressure maximum () it drops to about one third of its initial value.
For begins to rise at Myr, because a part of the gas is pushed to smaller galactic radii in the beginning of the stripping. The maximum which is about 1.2 times the initial value is reached at – Myr. For the lowest ram pressure maximum () there is a second increase and a second maximum (1.4 times the initial value) at Myr. For higher ram pressure maxima decreases for Myr.
For begins to rise later but more rapidly than for (at Myr) when the gas is pushed to smaller galactic radii. The maximum is about 1.4 times the initial value. Only for the highest ram pressure maximum () drops below its initial value for Myr. In the simulations with lower ram pressure maxima has a secondary maximum at Myr which has the same value than the first one.
In the case of edge-on stripping () begins to rise rapidly at Myr and reaches its maximum shortly after Myr. The time when it reaches the maximum increases with decreasing ram pressure maximum. The maximum of increases with increasing ram pressure maximum . For it reaches 1.6 times its initial value. As for there is a secondary maximum at Myr except for . The offset between the two maxima is constant Myr, i.e. the secondary maximum appears later for decreasing .
In order to summarize our findings, we conclude that the central surface density decreases after the galaxy’s passage near the cluster center in the case of high inclination angles (nearly face-on stripping). For small inclination angles (nearly edge-on stripping) rises and reaches a maximum when the galaxy passes the cluster center. In addition, there can be a secondary maximum after Myr.
7 Discussion
7.1 Comparison with Hi observations
The results of our simulations can be directly compared with the Hi 21 cm observations of Virgo cluster spirals made by Cayatte et al. (1994). We calculated the Hi diameter in the same way as these authors: it is defined by a limiting Hi column density of 1020 cm-2. This parameter is plotted in Fig. 15. It shows the normalized Hi to the optical diameter of our model together with the observed values as a function of the Hi deficiency. The model values are taken from the final states of our simulations. We assumed an optical diameter of 20 kpc (which corresponds to 7.5 disk scale lengths) for our model galaxy. The initial Hi diameter is =30 kpc.
There is an excellent agreement between the model values and the observational data for the normalized Hi to optical diameter. We are able to reproduce the slope and the scatter of the observed data.
Now, if we assume that the Hi surface density has the same value before and after the stripping event, the final Hi mass is given by , where is the final Hi radius at the end of a simulation. Thus the Hi deficiency depends on the final Hi diameter in the following way: . This curve is represented by the solid line in Fig. 15. If we assume that the Hi surface density is proportional to and does not change during the stripping event, we obtain . This curve is represented by the dashed line in Fig. 15. Thus, the modeled and observed Hi diameters as functions of the Hi deficiency are consistent with a constant radial Hi surface density, which has, in a first approximation, the same value before and after the stripping event. However, Fig. 13 shows that the final surface density can be decreased by up to a factor of 3 with respect to the initial surface density.
Cayatte et al. (1994) divided the observed spiral galaxies into four groups:
Group I: galaxies with , where and are the Hi and optical diameters respectively. These are cases of rather unperturbed Hi disks.
Group II: galaxies with 0.75. The surface density falls off faster beyond the optical half radius.
Group III: galaxies with . The disks are strongly truncated.
Group IV: anemic galaxies with a central Hi hole.
Since the model is in principle not able to reproduce a central hole
which might be due to mechanisms other than ram pressure stripping,
we will not discuss group IV. Anemic galaxies will be discussed
in Section 8.2.
The model surface densities were fitted with a fourth order
polynomial to obtain smooth curves. This procedure can give
overestimated values of the central surface density which are
therefore not comparable to the value determined in
Section 6.2. However, the overall behavior of the
profile (especially the cut off) is well reproduced.
We divided the final model surface density profiles by the initial one.
These graphs are shown in Fig. 16.
These normalized profiles can be directly compared with those of
Fig. 6 in Cayatte et al. (1994).
We can now assign each model density profile to one of the three groups.
This gives:
Group I: RUN A(10,0), B(20,0), C(50,0), D(100,0), E(10,20), F(20,20)
Group II: RUN G(50,20), H(100,20), I(10,45), J(20,45), K(50,45), M(10,90)
Group III: RUN L(100,45), N(20,90), O(50,90), P(100,90)
The membership of a simulation to a group depends on the form of the orbit, i.e. on the maximum ram pressure and on the inclination angle between the galaxy’s plane and the orbital plane. The comparison with the observed data shows that we can reproduce the scatter of the data over the whole range of deficiencies. The absolute values of the surface density profiles for the group I and III galaxies can be reproduced, whereas the values for the group II (intermediate deficiency) galaxies are higher than the observed values. Only one simulation (H(100,20)) of a group II galaxy shows a significantly decreased final surface density ( cm-2). Thus, our data does not show a systematic decrease of the central Hi surface density after the stripping process for group II galaxy as observed by Cayatte et al. (1994). We suggest that this decrease is related to the physical environment in the inner stellar and gaseous disk as the UV radiation field, the supernova rate, or the metalicity of the gas which influence the extent of the photodissociation regions and the gas heating and cooling rates leading to different Hi to H2 ratios.
7.2 Comparison with SPH simulations
Abadi et al. (1999) made ram pressure stripping simulations using an SPH code. They modeled a spiral galaxy moving with a constant velocity within an ICM of constant density. This corresponds to a circular galaxy orbit within the cluster. Therefore they do not have re-accretion of material which is mainly due to the decrease of ram pressure when the galaxy leaves the cluster core. Their timescale for ram pressure stripping is between 1 and 5 yr, thus comparable to our simulations. In difference to our model they have used a decreasing gas surface density profile that corresponds to the total gas surface density (atomic and molecular). They therefore underestimated the final Hi deficiency. This becomes clear if one estimates the Hi deficiency using their Hi to optical radius fraction and Fig. 15. For example, for their run D and E. According to Fig. 15 the resulting Hi deficiency is compared to the given value of .
7.3 Interpretation of the Hi data
We conclude that our simulations can reproduce the observational data of Cayatte et al. (1994) in its behavior, absolute values, and scatter. Therefore, we suggest that ram pressure stripping is the main cause of their Hi deficiency.
It is worth noting that we can reproduce the Hi observations using only one passage of the galaxy near the cluster center. As a typical orbital period of an Hi deficient spiral galaxy is of the order of several Gyr, it is possible that it has already passed through the cluster center more than once. The galaxy trajectory model has shown that the existence of a perturbing gravitational potential (M86) in the cluster center has two effects: (i) It can make the central mass concentration (M87) move. As the intracluster gas will follow the variable gravitational potential, the location of highest gas density within the cluster can also change. (ii) The galaxy orbits will change leading to a ram pressure profile changing with time for each passage in the cluster center.
Our simulations indicate (Fig. 15) that the lower Hi surface densities of galaxies with is due to internal parameters of the galaxy (Section 7.1) which lower the Hi to H2 ratio within the optical disk, whereas the total gas surface density stays the same. Furthermore, the simulations of Valluri (1993) indicate that the gravitational potential of the galaxy does not change significantly when the galaxy passes near the cluster center. For the estimation of the final Hi deficiency after a stripping event, the stellar and gas surface densities can thus be regarded as constant in a first approximation. A galaxy with an already truncated Hi radius with an unchanged total gas surface density will only lose more gas in a further stripping event if the maximum ram pressure and/or its inclination angle with respect to the orbital plane is higher than before. If a galaxy has already accomplished several orbits within the cluster, the orbit leading to the closest approach to the cluster center and/or having the highest inclination angle is decisive for its Hi deficiency. On the other hand, if the final surface density is decreased, a further passage through the cluster core will result in a higher Hi deficiency. The observed population of deficient galaxies represents galaxies which have passed through the cluster center at least once.
The different groups of Cayatte et al. (1994) represent galaxies on different orbits in the cluster. The fact that we can assign galaxies in the final state after the interaction to these groups confirms the conclusion that all Hi deficient galaxies have already passed through the cluster center.
The effects of ram pressure can be observed before the closest passage of the galaxy to the cluster center only in the case of inclination angles . The observed asymmetries of the gas distribution of Hi deficient () in the Virgo cluster which are located more than 1o from the cluster center are due to a former ISM–ICM interaction. This interaction has already ceased but its consequences are still observable. This is also the case for non Hi deficient galaxies which are located more than 2o from the cluster center. Thus, these galaxies showing important distortions in their Hi distribution have already passed through the cluster center. They are not infalling galaxies.
7.4 The amount of stripping
The knowledge of the dependence of the Hi deficiency on the maximum ram pressure and the inclination angle together with the galaxy’s radial velocity can constrain the galaxy orbits necessary to obtain a given Hi deficiency. We therefore attempt to give a simple analytical formula. Fig. 17 shows the fraction between the final and initial total Hi mass as a function of the quantities (ram pressure strength) and (inclination angle). The solid line represents a linear fit. The least square fit for the fraction between the initial and final total Hi mass is
| (22) |
7.5 Galaxies with different properties
The present simulations were made using a galaxy model with a constant rotation curve of =140 km s-1, a total atomic gas mass of M⊙, and an initial Hi diameter of =30 kpc. For a galaxy with different , , and the resulting Hi deficiency changes in the following way:
The final radius of the Hi gas distribution at the end of a simulation is given by
| (23) |
where and is the total gas surface density. The fraction between the initial and final Hi mass is given by
| (24) |
where is the initial/final Hi radius. The total gas surface density can be regarded as constant (Section 7.1) . With one obtains
| (25) |
For a maximum ram pressure , the fraction between the initial and final Hi mass for a galaxy with given , , and is
| (26) |
where is the mass fraction for =140 km s-1, M⊙, and =30 kpc. In order to recover the deficiencies, one simply has to apply its definition Eq. 19. We made two simulations with =250 km s-1, M⊙, and =54 kpc: (i) and , (ii) and . In order to verify Eq. 26, we calculated using Eq. 26 for these two simulations. The two resulting values can be seen as open triangles in Fig. 17. They are in good agreement with the mass fractions of the simulations of Table 1.
7.6 Possible local star formation mechanisms
The most important consequence of ram pressure stripping on cluster spiral galaxies is the removal of a large fraction of their gas reservoir. Without the supply of fresh gas, the star formation activity of a stripped galaxy will decrease on the timescale of a cluster crossing time. Nevertheless, the interaction of the galaxy’s gas with the ICM can lead to a short enhancement of its star formation activity. In this section we investigate possible star formation mechanisms triggered by a ram pressure stripping event. We first resume the relevant results of our simulations before discussing their consequences on star formation activity.
-
•
A considerable fraction of the initial galaxy’s gas mass can be accreted back on the galaxy in the case of low ram pressure maxima and low inclination angles (up to 10%).
-
•
There is a strong enhancement of the central surface density for a high and intermediate maximum ram pressure and small inclination angles .
-
•
In case of edge-on stripping and high maximum ram pressure, the central surface density increases by a factor 1.5 during the galaxy’s passage in the cluster center.
If we relate the enhancement of the gas surface density to a local star formation rate via the Schmidt law (Schmidt 1959, Kennicutt 1983) and via star formation due to colliding flows (see e.g. Hunter et al. 1986), these results lead to two possibilities of an enhancement of star formation:
(i) An instantaneous burst in the inner galactic disk which happens before ( yr) or while the galaxy passes through the cluster center. For the Virgo cluster this happens within a radius of around the cluster center. The enhancement of the star formation activity is strongest if the galaxy passes very close to the cluster center (100 kpc) and if the stripping is edge-on. Using a Schmidt-law, we estimate that the star formation rate within a radius can increase up to a factor 2.
(ii) The re-accretion of gas leads to star formation when the infalling gas clouds collide with the clouds in the disk. This can lead to a star formation event within the whole galactic disk which begins yr and ends up to yr after the galaxy’s closest passage to the cluster center. In the case of maximum re-accretion (small , low maximum ram pressure) of the total gas content falls back to the galaxy within yr. If 10% of this gas is turned into stars, the resulting star formation rate is M⊙ yr-1.
We conclude that ram pressure stripping can induce two types of star formation activity: a short burst during its passage in the cluster center or a longer lived more continuous star formation activity due to the re-accretion of the stripped gas. The strength of the star formation activity is governed by the galactic orbits in the cluster. This confirms the suggestion of Bothun & Dressler (1986) that ram pressure causes the Hi deficiency and can induce star formation. Several individual cases will be discussed in forthcoming papers.
8 The influence of orbits on galaxy properties
With the acquired knowledge of the previous section we can now study the link between the properties of Virgo cluster spiral galaxies and their orbits. Our model leads to the following scenario: galaxies on radial orbits will be Hi deficient regardless of their morphology. These galaxies have already passed through the cluster center at least once. For most of the group I and II galaxies, which have entered the cluster a few crossing times ago, the passage with the smallest impact parameter was decisive for their Hi deficiency.
Dressler (1986) and more recently Solanes et al. (2000) showed that the velocity dispersion of Hi deficient cluster galaxies decreases with increasing distance to the cluster center, indicating that these galaxies are on highly eccentric orbits. In addition, they found indications for a segregation among the orbits of infalling spirals according to their Hi deficiency regardless of galaxy morphology. Interestingly, Solanes et al. (2000) pointed out that the velocity dispersion of Hi deficient galaxies in the Virgo cluster does not decrease with radius. They interpreted this result as indicative for a gravitational field, which is strongly perturbed by ongoing mergers of major subclumps.
In order to investigate the link between Hi deficiency and galaxy orbits, we use position–velocity plots of different galaxy populations in the Virgo cluster together with our model orbits.
8.1 Hi deficient galaxies
We show the Hi deficiency data collected by Guiderdoni & Rocca-Volmerange (1986) in a radial velocity–projected distance plot (Fig. 18). The curves of the model orbits (Section 2) are plotted as dotted lines, the Keplerian and escape velocity for the gravitational potential of M87 as solid and dashed lines. The model orbits cover about half of the total area in the radial velocity–projected distance plane. The size of the crosses is proportional to the Hi deficiency. We only plot galaxies with . 9 out of 41 Hi deficient galaxies (%) lie beyond the model orbits marked by the dotted lines for a maximum projected distance of 12o (NGC 4193, NGC 4212, NGC 4216, NGC 4235, NGC 4260, NGC 4419, NGC 4450, NGC 4522, NGC 4826). The range of the projected distance of these galaxies is between 2o and 7o. Solanes et al. (2000) did not find a decrease of the velocity dispersion for distances smaller than 5o because of these high velocity Hi deficient galaxies. Their velocities are even higher than the Keplerian velocity due to the M87 gravitational potential but still below the escape velocity. Thus it is likely that they evolve on bound orbits. We will discuss this issue in Section 9. For larger radii we find a trend that Hi deficient galaxies evolve on radial orbits as already pointed out by Dressler (1986) and Giraud (1986).
8.2 Anemic galaxies
Anemic galaxies are a special class of galaxies with a very low arm inter-arm contrast (van den Bergh 1976). They are most similar to the passive spirals observed in high redshift clusters (see e.g. Poggianti et al. 1999) and are believed to represent the oldest spiral galaxy population which has entered the cluster several Gyr ago. We suggest the following evolutionary scenario for these galaxies: after a major stripping event the galaxy has lost its gas in the outer disk. The ongoing star formation activity exhausted its remaining gas reservoir in its entire disk. Without the possibility of a supply of fresh gas from the outer disk, star formation activity in the spiral arm decreased which led to a decreasing arm inter-arm contrast, i.e. the galaxy became anemic. Thus, an anemic galaxy has entered the cluster more than one crossing time ago on a radial orbit. In order to investigate if anemic galaxies are still on radial orbits or if tidal interactions have lead to more circular orbits, we show the distribution of this population in the radial velocity–projected distance plot in Fig. 19. We include here also the group IV galaxies of Cayatte et al. (1994), because we assume that the reduced Hi diameter regardless of a central hole is due to the major stripping event.
The small number of orbits prevents us from a quantitative tracing of the dispersion velocity as a function of the projected distance. Nevertheless, we observe that 12 out of 15 anemic galaxies lie on radial orbits except (NGC 4192, NGC 4450, and NGC 4419). NGC 4192 is seen nearly edge-on. Therefore, it is difficult to estimate its arm inter-arm contrast. The low Hi deficiency of NGC 4192 indicates that this galaxy might be misclassified as an anemic galaxy. If we exclude this galaxy, there is an indication that the velocity dispersion decreases with increasing distance. This is consistent with anemic galaxies being preferentially on radial orbits. As they represent a spiral population which entered the cluster more than several Gyr ago, there is an indication that their orbits were not perturbed by the changing gravitational field due to the merging of subclumps. If this tendency turns out to be real, this would mean that only the infalling galaxies are scattered with high velocities to large distances from the cluster center during the merging of a major subclump (e.g. M86) and not the old spiral population. Interestingly, Solanes et al. (2000) showed that the velocity dispersion of early type spiral galaxies does not decrease. Anemic galaxies might thus form a special class of galaxies whose orbits are of different shape than those of early type spirals.
9 Infall
We will now try to explain the existence of the group of high velocity Hi deficient galaxies which can be found at projected distances of (NGC 4193, NGC 4212, NGC 4216, NGC 4235, NGC 4260, NGC 4419, NGC 4450, NGC 4522). One of its members (NGC 4522) has been observed in H by Kenney & Koopmann (1999). They claim that there are extraplanar ionized filaments and identify it as one of the best candidates for ram pressure stripping. As we have shown before, spiral galaxies on radial orbits which lead to a strong stripping event do not permit these positions in the radial velocity - projected distance plot. Thus, there must be another explanation.
The basic idea comes from the presence of M86 in the vicinity of M87. Since it has a high radial velocity with respect to M87, it is probable that M86 is falling into the cluster from behind. In addition, the central dwarf population shows already a spatial distortion in the direction of M86 (Schindler et al. 1999). We interpret this as the consequence of the passage of M86 near the cluster center, i.e. M87. If the subclump of M86 has entered the Virgo cluster with its own spiral galaxy population, these could have been captured by the Virgo cluster. The outcoming orbits of this infalling spiral population can be very different from those which are already settled.
We have tested this hypothesis with the help of our orbit simulations. M87 has been placed at rest in the center. M86 is located at (0.5 Mpc, 0 Mpc, 5 Mpc) and with an initial velocity vector (0 km s-1, 1 km s-1, 0 km s-1). For the test galaxy we adopted: = (0.5 Mpc, 1 Mpc, 5 Mpc) and (258 km s-1, 1 km s-1, 258 km s-1), i.e. the test galaxy is orbiting at a distance of 1 Mpc around M86 which is falling radially (along the LOS) into the gravitational potential of M87. We have included the full symmetric gravitational potential of both galaxies. The effects of an internal perturbation of M86 due to the tidal interaction with M87 is neglected. The assumption is justified, because the difference between their radial velocities km s-1 is much larger than the dispersion velocity of M86.
The resulting trajectories can be seen in Fig. 20. When the M86 clump approaches M87 the latter also begins to move. The test galaxy is orbiting in the joint gravitational potential of M87 and M86 following M86 in the -direction. When passing near M87 it can even be ejected from the cluster as it happens at the end of our simulation. The corresponding radial velocity - projected distance plot can be seen in Fig. 21. The positions and velocities are plotted with respect to the positions and velocities of M87, the center of the Virgo cluster. Clearly there is the possibility to obtain high radial velocities at large projected distances especially when the galaxy is ejected from the cluster. There is also the effect that M87 begins to move, changing the position of the cluster center.
We suggest that the existence of the special galaxy population with high radial velocities at large projected distances is linked to the trajectory of M86 perturbing the gravitational potential. In this scenario these galaxies pass the cluster center with high velocities. The increased velocity leads to an enhanced ram pressure (). Solanes et al. (2000) also suggested that gravitational perturbations due to major subclumps (as M86) are responsible for the high velocities Hi deficient galaxies. If these galaxies are bound, they will evolve on extremely eccentric orbits with very long periods. After the merging of the subclump, they will be most probably found at very large distances from the cluster center and the velocity dispersion of the remaining Hi deficient galaxies will again decrease.
Since there are indications that galaxies are accreted in subclumps, the accretion rate is expected to be highly irregular showing strong peaks when a subclump as M86 is falling into the cluster adding new spiral galaxies to the existing population.
10 Galaxy evolution within the cluster
Accreted spiral galaxies are preferentially on radial orbits which lead them near the cluster center where ram pressure is most efficient. Very recently accreted galaxies (1 Gyr) can have an enhanced star formation rate in the outer disk due to the re-accretion of stripped gas. During the ram pressure stripping event, the atomic gas is stripped from the outer disk leaving the molecular gas unaffected. Consequently the star formation activity in the outer disk region of highly stripped galaxies decreases, whereas the star formation rate in the inner disk stays roughly constant after a possible short increase (see Section 7.6). This leads to a decrease of the overall star formation rate. Koopmann & Kenney (1998) noticed that the morphological classification of the spiral galaxies in the Virgo cluster taking only into account the overall star formation rate is often ambiguous. Galaxies classified in this way as early type spirals become late types if one takes into account their disk to bulge ratios in the R band. These galaxies show a reduced overall star formation rate, which is mainly due to a strongly reduced star formation rate in the outer disk. We suggest that this special type of galaxies has undergone a ram pressure stripping event.
We will now estimate the influence of ram pressure stripping on the global star formation rate. We assume a gas surface density distribution for the molecular phase and for the atomic phase within an optical radius. Furthermore, the star formation rate is given by a Schmidt law (Kennicutt 1998)
| (27) |
where . It is assumed that star formation takes only place within the optical radius. After a major stripping event, the Hi is . We consider two different cases:
(i) M⊙pc-2, kpc, =5 M⊙pc-2. For the total molecular gas mass and the total atomic gas mass within the optical radius are comparable . The star formation drops by a factor 2 due to ram pressure stripping (from 3.6 to 1.7 M⊙ yr-1).
(ii) M⊙pc-2, kpc, =5 M⊙pc-2. In this case . The star formation drops almost by a factor 3 due to ram pressure stripping (from 2.2 to 0.8 M⊙ yr-1).
For this high maximum ram pressure star formation induced by re-accretion is negligible. In the case of a central starburst triggered by ram pressure, we assume an increase of the local star formation rate within by a factor 4 during yr (Fig. 13. This leads to a mild increase of the global star formation rate (up to a factor 2)). The consumed molecular gas masses for both cases are (i) M⊙ and (ii) M⊙. This corresponds to roughly 10% of the total molecular gas content in both cases. Thus, the occurrence of a central star burst can additionally lower the global star formation rate by 10% after a strong stripping event.
If the gas content within an optical radius of a non deficient galaxy is dominated by the atomic phase, ram pressure stripping can account for the quenching of star formation at a timescale of 1 Gyr described by Poggianti et al. (1999). In the case of a strong edge-on stripping event, the global star formation will increase by a factor 1.5 within yr and drop then by a factor 2–3 three with respect to its initial value. On the contrary, ram pressure cannot account for the morphological transformation, which has a larger timescale (several Gyr). This transformation might be due to the combined effect of high speed encounters with massive galaxies and the interaction with the gravitational potential of the cluster (“galaxy harassment”; Moore et al. 1996, 1998).
We will now attempt to determine the galaxies’ location in the direction with respect to the cluster center (M87) using the following results from this article:
-
•
If an Hi deficient galaxy shows enhanced star formation in the disk due to re-accretion of the stripped material, it has been accreted recently (less than 1 Gyr) by the cluster. We observe the galaxy when it has already passed the cluster center. It is in the phase of re-accretion of the stripped material which collides with the galaxy’s ISM leading to an enhancement of its star formation activity.
-
•
If an Hi deficient galaxy shows a perturbed Hi velocity field or a distorted Hi distribution, it has passed the cluster center recently and is now coming out of the cluster center.
-
•
If a non Hi deficient galaxy shows a perturbed Hi velocity field or a distorted Hi distribution and is located more than 2o away from the cluster center, it has passed the cluster center recently and is now coming out of the cluster center.
These galaxies have in common that they are coming from the cluster core with the closest approach to the cluster center less than 1 Gyr ago. The sign of their radial velocity gives us the clue to place them with respect to M87. If the galaxy’s radial velocity is positive it is located behind the cluster center, if it is negative it is located in front.
11 Summary and conclusions
In this work we have made N-body simulations in order to simulate the neutral gas content of spiral galaxies entering a cluster. We are interested in the effect of the ram pressure exerted by the hot intracluster medium on the ISM of the fast moving galaxy. At the same time we simulated the gas dynamics of a spiral galaxy on a radial orbits within the gravitational potential of the Virgo cluster. We investigated different orbits varying systematically the inclination angle between the disk and the orbital plane. The main results are:
-
1.
The amount of the stripping and thus the Hi deficiency depends on the galaxy orbit (minimum distance to the cluster center, maximum velocity, and inclination of the disk with respect to the orbital plane). We generalize the formula of Gunn & Gott (1972) including explicitly the inclination angle. We give an approximation of the relation between the Hi deficiency on the one hand and the maximum ram pressure and inclination angle on the other hand.
-
2.
We have used a realistic temporal ram pressure profile, i.e. ram pressure decreases after the closest passage to the cluster center. For maximum ram pressure of cm-3 (km s-1)2 and low inclination angles we observe a phase of re-accretion where the gas, which has not been accelerated to the escape velocity, falls back to the galaxy. The fraction of the re-accreted mass can attain up to 10% of the total atomic gas mass.
-
3.
For maximum ram pressure of cm-3 (km s-1)2 and small inclination angles the central gas surface density can increase up to a factor 1.5 within a few 107yr. Assuming a Schmidt law for the star formation rate leads to an increase of the local star formation rate up to a factor 2.
-
4.
Deformations of the neutral gas content are mainly observable after the closest approach to the Virgo cluster center. Thus, the majority of galaxies with a peculiar Hi distribution are coming out of the cluster core.
-
5.
The observationally established correlation between the Hi to optical diameter and the Hi deficiency is well reproduced by our simulations.
We conclude that the scenario where the Hi deficiency is due to ram pressure stripping is consistent with all available Hi 21 cm observations of the Virgo spiral galaxy population.
References
- (1) Abadi, M.G., Moore, B., & Bower, R.G. 1999, MNRAS, 308, 947
- (2) Allen, C., & Santillán, A. 1991, RMAA, 22, 255
- (3) Balsara, D., Livio, M., & O’Dea, C.P. 1994, ApJ, 437, 83
- (4) Barnes, J.E., & Hut, P. 1986, Nature, 324, 446
- (5) Bicay, M.D., & Giovanelli, R. 1987, ApJ, 321, 645
- (6) Binney, J., & Tremaine, S. 1987, Galactic Dynamics (Princeton: Princeton University Press), p. 77
- (7) Böhringer, H., Briel, U.G., Schwarz, R.A., Voges, W., Hartner, G., & Trümper, J., 1994, Nature, 368, 828
- (8) Boselli, A., Gavazzi, G., Lequeux, J., Buat, V., Casoli, F., Dickey, J., & Donas, J. 1997, A&A, 327, 522
- (9) Bothun, G., & Dressler A., 1986, ApJ, 301, 57
- (10) Bothun, G., Schommer, R.A., & Sullivan W.T.III 1982, AJ, 87, 731
- (11) Byrd, G., Valtonen, M. 1990, ApJ, 350, 89
- (12) Caldwell, N., Rose, J.A., Sharples, R.M., Ellis, R.S., & Bower, R.G. 1993, AJ, 106, 473
- (13) Caldwell, N., & Rose, J.A. 1997, AJ, 113, 492
- (14) Caldwell, N., Rose, J.A., & Dendy, K., 1999, ApJ, 117, 140
- (15) Cavaliere, A., & Fusco-Femiano, R., 1976, A&A, 49, 137
- (16) Cayatte, V., van Gorkom, J.H., Balkowski, C., & Kotanyi C. 1990, AJ, 100, 604
- (17) Cayatte, V., Kotanyi, C., Balkowski, C., & van Gorkom, J.H. 1994, AJ, 107, 1003
- (18) Chamaraux, P., Balkowski, C., & Gérard, E. 1980, A&A, 83, 38
- (19) Combes, F., & Gérin, M. 1985, A&A, 150, 32
- (20) Couch, W.J., Barger, A.J., Smail, I., Ellis, R.S., & Sharples, R.M. 1998, ApJ, 497, 188
- (21) Cowie, L.L., & McKee, C.F., 1977, ApJ, 211, 135
- (22) Cowie, L.L., McKee, C.F., & Ostriker J.P., 1981, ApJ, 247, 908
- (23) Dressler, A. 1986, ApJ, 301, 35
- (24) Dressler, A., Smail, I., Poggianti, B.M., Butcher, H., Couch, W.J., Ellis, R.S., & Oemler A.Jr. 1999, ApJS, 122, 51
- (25) Gaetz, T.J., Salpeter, E.E., & Shaviv G. 1987, ApJ, 316, 530
- (26) Gavazzi, G., Boselli, A., & Kennicutt, R. 1991, AJ, 101, 1207
- (27) Gavazzi, G., Catinella, B., Carrasco, L., Boselli, A., & Contursi, A. 1998, AJ, 115, 1745
- (28) Ghigna, S., Moore, B., Governato, F., Lake, G., Quinn, T., & Stadel, J. 1998, MNRAS, 300, 146
- (29) Giovanelli, R., & Haynes, M.P. 1985, ApJ, 292, 404
- (30) Giraud, E. 1986, A&A, 167, 25
- (31) Guiderdoni, B., & Rocca-Volmerange, B. 1985, A&A, 151, 108
- (32) Gunn, J.E., & Gott, J.R. 1972, ApJ, 176, 1
- (33) Hoffman, G.L., Helou, G., Salpeter, E.E., 1988, ApJ, 324, 75
- (34) Hollenbach, D.J., Tielens A.G.G.M., 1997, AARA, 35, 179
- (35) Huchra, J.P. 1988, in The extragalactic distance scale, ed. S. van den Bergh & C.J. Prichet, ASP Conference Series, Vol. 4 (Salt Lake City: ASP), p. 257
- (36) Hunter, J.H.Jr. ,Sandford, M.T.II, Whitaker, R.W., Klein, R.I., 1986, ApJ, 305, 309
- (37) Kenney, J.D., & Koopmann, R.A. 1999, AJ, 117, 181
- (38) Kenney, J.D., & Young, J.S. 1988, ApJS, 66, 261
- (39) Kenney, J.D., & Young, J.S. 1989, ApJ, 344, 171
- (40) Kennicutt, R.C.Jr. 1983, AJ, 88, 483
- (41) Kennicutt, R.C.Jr. 1998, ARAA, 36, 189
- (42) Kim, S., Staveley-Smith, L., Dopita, M.A., Freeman, K.C., Sault, R.J., Kesteven, M.J., & McConnell D. 1998, ApJ, 503, 674
- (43) Klarić, M. 1995, AJ, 109, 2522
- (44) Knude, J. 1981, A&A, 98, 74
- (45) Koopmann, R.A., & Kenney, J.D. 1998, ApJ, 497, 75
- (46) Kulkarni, S.R., & Heiles, C., 1988, in Galactic and Extragalactic Radio Astronomy, ed. G.L. Verschuur & K.I. Kellermann (New York: Springer Verlag), 95
- (47) Maloney, P.R., Hollenbach, D.J., & Tielens, A.G.G.M., 1996, ApJ, 466, 561
- (48) Moore, B., Katz, N., Lake, G., Dressler, A., & Oemler A. 1996, Nature, 379, 613
- (49) Moore, B., Lake, G., & Katz, N. 1998, ApJ, 495, 139
- (50) Murakami, I., & Babul, A. 1999, MNRAS, 309, 161
- (51) Phookun, B., & Mundy, L.G., 1995, ApJ, 453, 154
- (52) Poggianti, B.M., Smail, I., Dressler, A., Couch, W.J., Barger, A.J., Butcher, H., Ellis, R.S., & Oemler A.Jr. 1999, ApJ, 518, 576
- (53) Rots, A.H., Crane, P.C., Bosma, A., Athanassoula, E., & van der Hulst J.M. 1990, AJ, 100, 387
- (54) Sanders, D.B., Scoville, N.Z., & Solomon, P.M. 1985, ApJ, 289, 373
- (55) Schindler, S., Binggeli, B., & Böhringer, H. 1999, A&A, 343, 420
- (56) Schmidt, M., 1959, ApJ, 129, 243
- (57) Solanes, J.M., Manrique, A., García-Gómez, C., González-Casado, G., Giovanelli, R., & Haynes, M., 2000, ApJ, in press
- (58) Spitzer L., 1978, Physical Processes in the Interstellar Medium
- (59) Stoer, J., & Burlisch, R. 1980, Introduction to Numerical Analysis (New York: Springer-Verlag), chapter 7
- (60) Takeda, H., Nulsen, P.E.J., & Fabian, A.C. 1984, MNRAS, 208, 261
- (61) Tosa, M. 1994, ApJ, 426, L81
- (62) Tully, R.B., & Shaya, E.J. 1984, ApJ, 281, 31
- (63) Valluri, M. 1993 ApJ, 408, 57
- (64) van den Bergh, S. 1976, ApJ, 206, 883
- (65) van Gorkom, J.H., & Kotanyi, C.G. 1985, in Proceedings of the Workshop on the Virgo Cluster, edited by O.G. Richter and B. Bingelli (ESO Garching), p. 61
- (66) Vollmer B., Marcelin M., Amram P., Balkowski C., Cayatte V., Garrido O. 2000, A&A, 364, 532
- (67) Vollmer B., Braine J., Balkowski C., Cayatte V., Duschl W.J. 2001, A&A, accepted for publication
- (68) Warmels, R.H. 1988, A&AS, 72, 19
- (69) Wiegel, W. 1994, Diploma thesis, University of Heidelberg
- (70) Zabludoff, A.I., Zaritsky, D., Lin, H., Tucker, D., Hashimoto, Y., Shectman, S.A., Oemler, A., Kirshner, R.P., 1996, ApJ, 466, 104


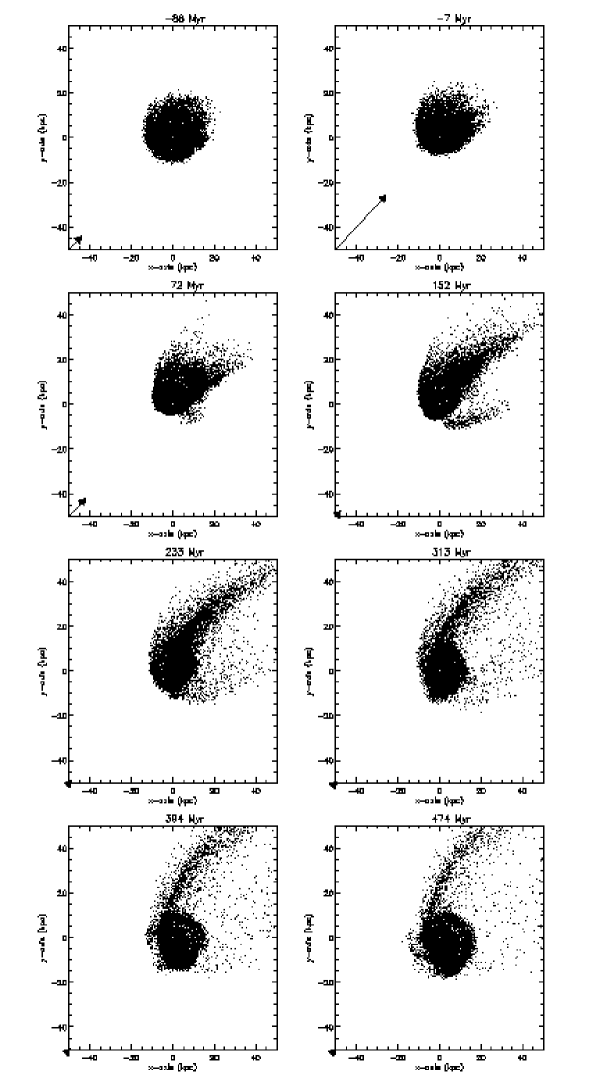
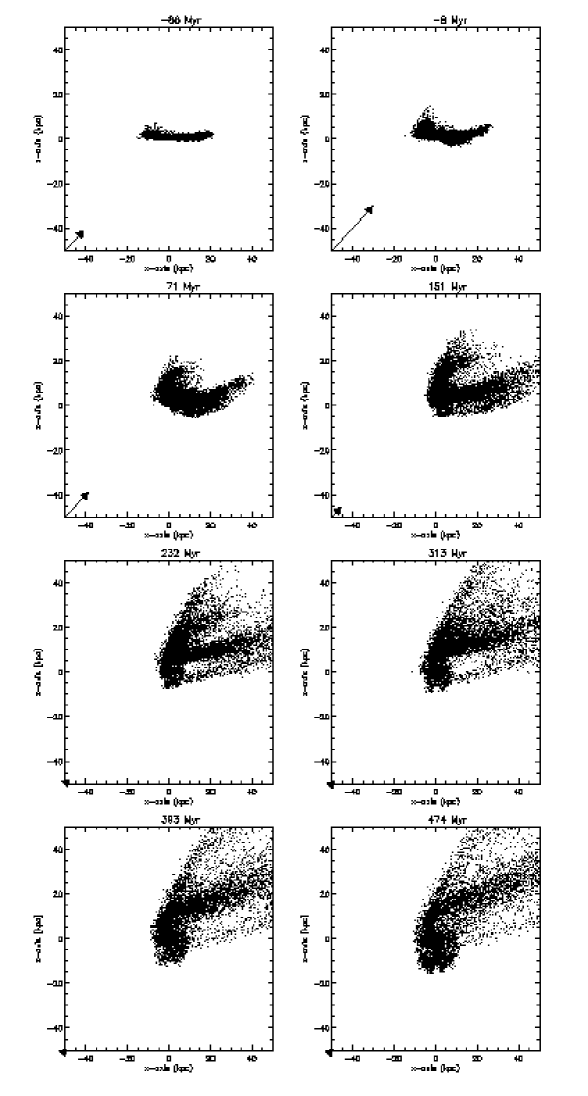


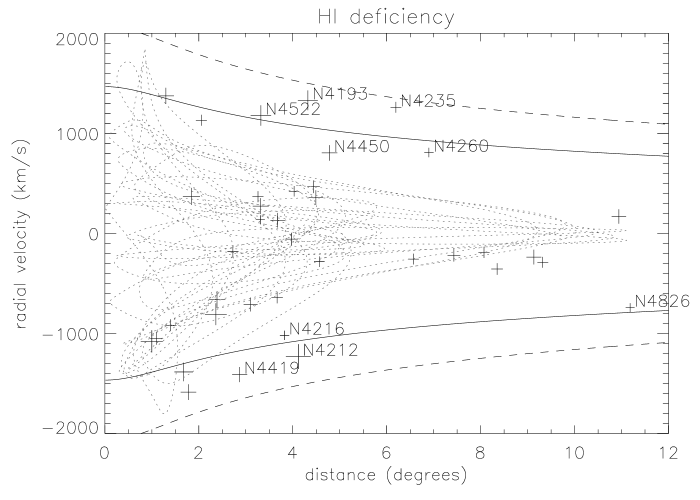
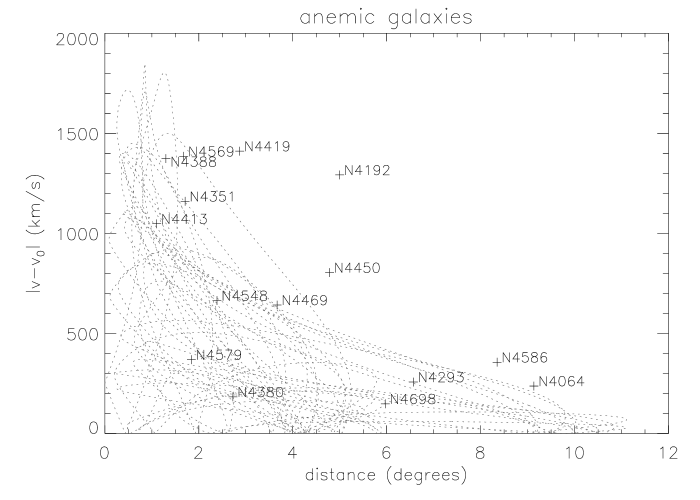

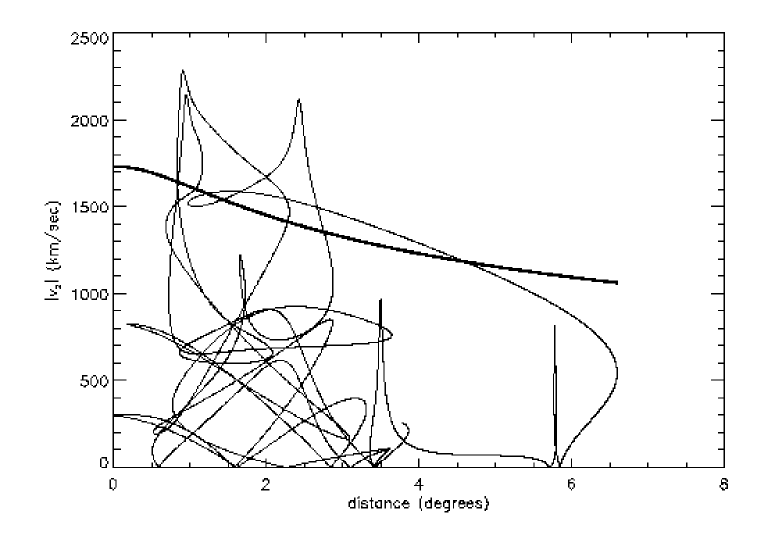
| RUN | DEFg | M | M | ||||||
|---|---|---|---|---|---|---|---|---|---|
| A(10,0) | 10 | 0 | - | - | 32 | 12.71 | 0.01 | 2.4 | 1.41 |
| B(20,0) | 20 | 0 | - | - | 34 | 13.85 | 0.02 | 3.1 | 0.94 |
| C(50,0) | 50 | 0 | 100 | 180 | 36 | 15.31 | 0.05 | 5.7 | 0.68 |
| D(100,0) | 100 | 0 | 70 | 125 | 37 | 12.76 | 0.10 | 5.1 | 0.32 |
| E(10,20) | 10 | 20 | 50 | 90 | 33 | 15.87 | 0.08 | 1.8 | 0.17 |
| F(20,20) | 20 | 20 | 0 | 0 | 30 | 16.26 | 0.13 | 2.5 | 0.15 |
| G(50,20) | 50 | 20 | -30 | -50 | 20 | 16.57 | 0.23 | 1.0 | 0.04 |
| H(100,20) | 100 | 20 | -200 | -360 | 19 | 4.9 | 0.61 | 0.4 | 0.01 |
| I(10,45) | 10 | 45 | -110 | -200 | 20 | 17.68 | 0.34 | 2.6 | 0.08 |
| J(20,45) | 20 | 45 | -130 | -230 | 14 | 18.03 | 0.73 | 1.5 | 0.03 |
| K(50,45) | 50 | 45 | -160 | -285 | 14 | 10.93 | 0.72 | 0.8 | 0.02 |
| L(100,45) | 100 | 45 | -170 | -300 | 9 | 4.83 | 1.13 | 0.3 | 0.01 |
| M(10,90) | 10 | 90 | -320 | -570 | 14 | 13.12 | 0.60 | 2.3 | 0.05 |
| N(20,90) | 20 | 90 | -320 | -570 | 11 | 10.75 | 0.82 | 1.2 | 0.02 |
| O(50,90) | 50 | 90 | -320 | -570 | 8 | 5.64 | 1.11 | 0.5 | 0.01 |
| P(100,90) | 100 | 90 | -320 | -570 | 6 | 3.33 | 1.35 | 0.3 | 0.01 |