eurm10 \checkfontmsam10
Tracking The Baryon Density From The Big Bang To The Present
Abstract
The primordial abundances of deuterium, helium, and lithium probe the baryon density of the universe only a few minutes after the Big Bang. Of these relics from the early universe, deuterium is the baryometer of choice. After reviewing the current observational status (a moving target!), the BBN baryon density is derived and compared to independent estimates of the baryon density several hundred thousand years after the Big Bang (as inferred from CMB observations) and at present, more than 10 billion years later. The excellent agreement among these values represents an impressive confirmation of the standard model of cosmology, justifying – indeed, demanding – more detailed quantitative scrutiny. To this end, the corresponding BBN-predicted abundances of helium and lithium are compared with observations to further test and constrain the standard, hot, big bang cosmological model.
1 Introduction
As progress is made towards a new, precision era of cosmology, redundancy will play an increasingly important role. As cosmology is an observational science, it will be crucial to avail ourselves of multiple, independent tests of, and constraints on, competing cosmological models and their parameters. Furthermore, such redundancy may provide the only window on systematic errors which can impede our progress or send us off in unprofitable directions. To illustrate the efficacy of such an approach in modern cosmology, I’ll track the baryon density of the Universe as revealed early on (first few minutes) by Big Bang Nucleosynthesis (BBN), later (few hundred thousand years) as coded in the fluctuation spectrum of the Cosmic Microwave Background (CMB) radiation, and up to the present, approximately 10 Gyr after the expansion began. As theory suggests and terrestrial experiments confirm, baryon number should be preserved throughout these epochs in the evolution of the universe, so that the number of baryons ( nucleons) in a comoving volume should be unchanged from BBN to today. As a surrogate for identifying a comoving volume, we may compare the baryon/nucleon density to the density of CMB relic photons. Except for the additional photons produced when e± pairs annihilate, the number of photons in our comoving volume is also preserved. As a result, the baryon density may be tracked through the evolution of the universe utilizing the nucleon-to-photon ratio where,
| (1) |
Since the temperature of the CMB fixes the present number density of relic photons, the fraction of the critical mass/energy density in baryons today () is directly related to ,
| (2) |
where the Hubble parameter, measuring the present universal expansion rate, is H kms-1Mpc-1. According to the HST Key Project, ([Freedman et al. (2001), Freedman et al. 2001]).
For several decades now the best constraints on have come from the comparison of the predictions of BBN with the observational data relevant to inferring the primordial abundances of the relic nuclides D, 3He, 4He, and 7Li. For recent reviews, the interested reader is referred to [Olive, Steigman, & Walker (2000)], [Burles, Nollett, & Turner (2001)], [Cyburt, Fields, & Olive (2001)], and references therein. However, the time is rapidly approaching when new data of similar accuracy will be available to probe the baryon density at later epochs. Indeed, recent CMB data has very nearly achieved this goal. This same level of precision is currently lacking for the present universe estimates but, such as they are, they do permit us to compare and contrast independent estimates of (or ) at three widely separated eras in the evolution of the universe. In the next section the BBN bounds on the nucleon density are presented and their implications for the dark baryon and dark matter problems described. Next, we turn to the CMB estimates of the baryon density, comparing them to those from BBN. Last (but not least), we turn to an estimate of the present universe baryon density utilizing data whose interpretation avoids the need to adopt a relation between mass and light in the universe.
In recent years cosmological research has been data-driven and we have become used to looking forward with great anticipation to the latest observational results, and greedily wishing for more. Be careful of what you wish for! Not all the new data has led us unerringly along the right path. Indeed, within a few weeks of this meeting new data became available on the CMB angular fluctuation spectrum (Halverson et al. 2001; Netterfield et al. 2001; Lee et al. 2001) and on the deuterium abundance ([Levshakov, Dessauges-Zavadsky, D’Odorico, & Molaro (2001), Levshakov, Dessauges-Zavadsky, D’Odorico, & Molaro 2001]; [Pettini & Bowen (2001), Pettini & Bowen 2001]) which change dramatically some of the results I presented in my talk at this Symposium. In the interest of preserving some of the historical record, I will comment on the older data and their implications, while reserving the most recent observations for my conclusions regarding the baryon density of the universe.
2 The Baryon Density During The First Few Minutes
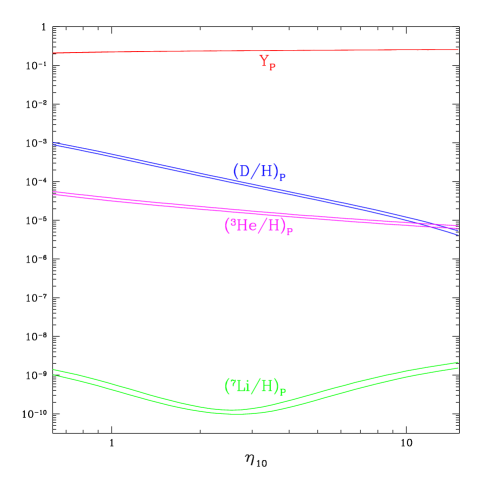
During the first few minutes in the evolution of the universe the density and temperature were sufficiently high for nuclear reactions to occur in the time available. As the universe expanded, cooled, and became more dilute, the “rolling blackout” became permanent and the universal nuclear reactor went offline. The abundances of the light nuclei formed during this limited epoch of primordial alchemy were determined, for the most part, by the competition between the time available (the universal expansion rate) and the density of the reactants: nucleons (neutrons and protons). The abundances predicted for nucleosynthesis in the standard cosmological model (SBBN) are shown (as a function of ) in Figure 1.
The abundances of D, 3He, and 7Li are “rate limited”, being determined by the competition between the nuclear production/destruction rates and the universal expansion rate. As such, they are sensitive to the nucleon density and have the potential to serve as “baryometers”. In contrast, the nuclear reactions which build 4He are so rapid and, because its destruction is inhibited (due to its strong binding and the lack of a stable nuclide at mass-5), the helium-4 mass fraction, Y, is insensitive to . Since virtually all the neutrons available at BBN are incorporated into 4He, Y is determined mainly by the neutron-to-proton ratio which is controlled by the competition between the weak interaction rate (“-decay”) and the expansion rate. As a result, since the neutron lifetime is known very accurately, the 4He abundance is a sensitive probe of the early universe expansion rate.
2.1 Deuterium – The Baryometer Of Choice
Of the three relic nuclides whose primordial abundances may be probes of the baryon density (D, 3He, 7Li), deuterium is the baryometer of choice. First and foremost, the predicted primordial abundance has a sigificant dependence on the nucleon density (D/H ). As a result, if the primordial abundance is known to, say, 10%, then the baryon density () can be determined to ; truly precision cosmology! Equally important, as [Epstein, Lattimer, & Schramm (1976)] showed long ago, BBN is the only astrophysical site where an “interesting” abundance of deuterium may be produced (D/H ); the relic abundance is not enhanced by post-BBN production. Furthermore, as primordial gas is cycled through stars, deuterium is completely destroyed (because of the small binding energy of the deuteron, destruction occurs during the pre-main sequence evolution, when the stars are fully mixed). As a result, the abundance of deuterium has only decreased (or, remained close to its primordial value) since BBN.
| (3) |
where “NOW” refers to the “true” deuterium abundance in any system observed at any time (e.g., the solar system; the interstellar medium; high redshift, low metallicity QSO absorbers, etc.).
There is, however, one potentially serious problem associated with using deuterium as a baryometer. The atomic spectra of deuterium and hydrogen are identical, save for the isotope shift associated with the deuteron-proton mass difference. As a result, a small amount of hydrogen at the “wrong” velocity (an “interloper”) can masquerade as deuterium, so that
| (4) |
A comparison of equations 3 and 4 reveals the problem: how to relate (D/H)OBS to (D/H)BBN? One approach is to concentrate on observing deuterium in those high redshift (high-z), low metallicity (low-Z) systems where not much gas will have been cycled through stars and the deuterium (“NOW”) should be essentially primordial (BBN). If so, there should be no variation (outside of the statistical errors) with metallicity. To test for interlopers the best approach (the favorite of theorists!) is to have lots of data. Observers are making great progress towards this goal, but the road has not always been straight.
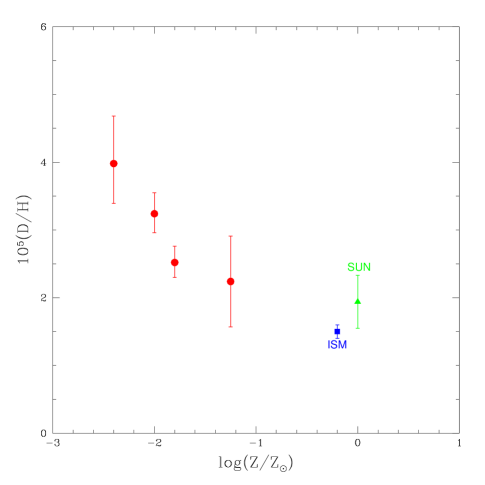
After some false starts, there were four high-z, low-Z QSO absorption line systems where deuterium had been detected as of the time of this Symposium in April 2001 (Burles & Tytler 1998a,b; O’Meara et al. 2001; [D’Odorico, Dessauges-Zavadsky, & Molaro (2001), D’Odorico, Dessauges-Zavadsky, & Molaro 2001]). A fifth system ([Webb et al. (1997), Webb et al. 1997]), with possibly a much higher D/H, is widely agreed to have insufficient velocity data to rule out contamination by a hydrogen interloper ([Kirkman et al. (2001), Kirkman et al. 2001]). However, these data on D/H, displayed as a function of metallicity in Figure 2, appear to challenge our expectations (of a low-metallicity, deuterium “plateau”) in that they suggest an anticorrelation between D/H and metallicity. Has deuterium actually been destroyed since BBN, and is the BBN abundance at least as high as the highest data point? This would be most surprising in such low metallicity systems (see, e.g., Jedamzik & Fuller 1997).
Perhaps one or more of the “high” points is “too high” because of an interloper. To test for this possibility, let’s display the same data as a function of the hydrogen column density (O’Meara et al. 2001); see Figure 3. It might be expected that the lower hydrogen column density absorbers could be more easily contaminated. Two of the systems have relatively low H-column densities (cm Lyman Limit Systems (LLS)) and two have considerably higher NH (cm Damped Lyman Alpha (DLA) absorbers).
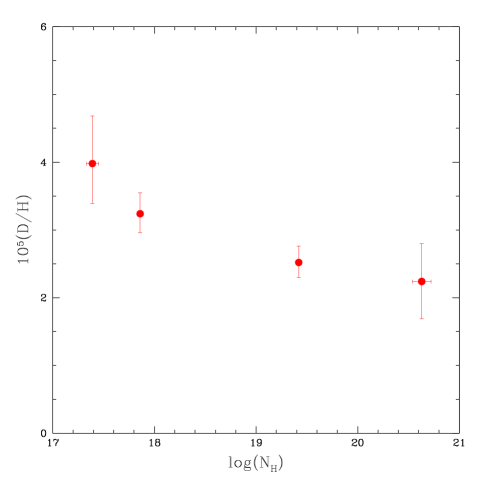
Indeed, the hint from Figure 3 is that interlopers may be playing a role in either or both of the LLS. If so, perhaps we should identify only the DLAs with the primordial deuterium abundance. However, given the small number of data points, this would be premature. At the Symposium I adopted a weighted average (D/H) and called for more data. Observers weren’t long in responding. But, I hadn’t anticipated what they would find.
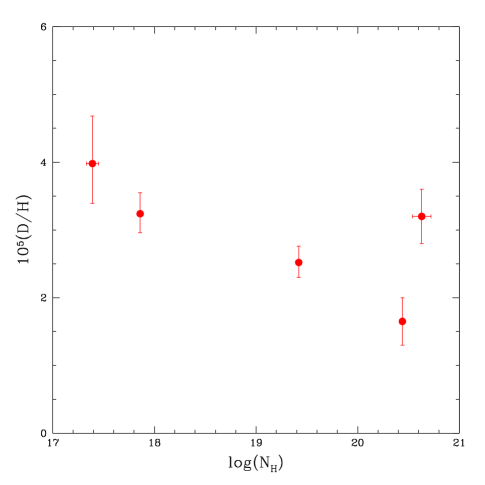
Further observations by [Levshakov, Dessauges-Zavadsky, D’Odorico, & Molaro (2001)] of the [D’Odorico, Dessauges-Zavadsky, & Molaro (2001)] absorber (the low D/H point at the highest NH in Fig. 3) revealed a more complex velocity structure and led to an upward revision in the derived D/H (which, by the way, is by more than the previous statistical error estimate, reinforcing the potential for systematic errors to wreak havoc). So far, so good, now that the four D/H determinations are more consistent with one another, alleviating the need to invoke interloper contamination. However, in the meanwhile [Pettini & Bowen (2001)] weighed in with a new deuterium detection in a DLA. The Pettini-Bowen abundance is smaller than all the other determinations, indeed smaller than (although within the errors of) the presolar nebula abundance of [Gloeckler & Geiss (2000)]. The current data (as of July 2001) are shown in Figure 4.
What to do? The dispersion among these four determinations hints that one or more may be wrong. Until this puzzle is resolved by more data (the last refuge of the theorist), I will adopt as a default estimate the one derived by [O’Meara et al. (2001)]: (D/H). The consequences for the BBN derived baryon density are shown in Figure 5 where the overlap between the predicted and “observed” primordial abundances are used to constrain .
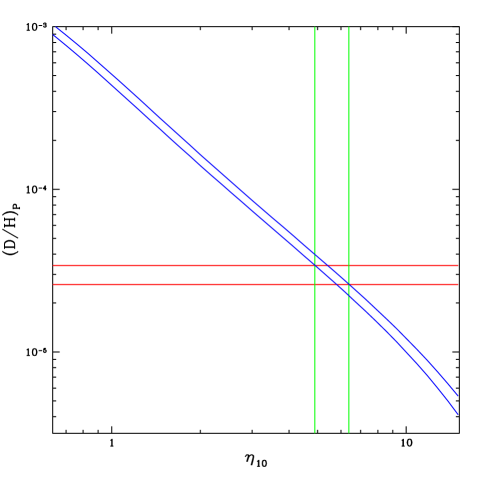
2.2 The BBN Baryon Density
From a careful comparison between the BBN predicted abundance (including errors – which are subdominant) and the adopted primordial value, the baryon density when the universe is less than a half hour old may be constrained (see Figure 6). For cosmology, this is truly a “precision” determination. Whether it is accurate, only time will tell.
| (5) |
This range for the baryon density poses some interesting challenges to our view of the universe. These challenges may be seen by comparing the BBN estimate of with those found by adding up all the baryons associated with the “luminous” material observed in the present/recent universe at z (Persic & Salucci 1992), and with estimates of the total mass density at present. These comparisons are shown in Figure 7 where the various density parameter estimates/ranges are plotted as a function of the Hubble parameter H0 (recall that, according to [Freedman et al. (2001)], H).
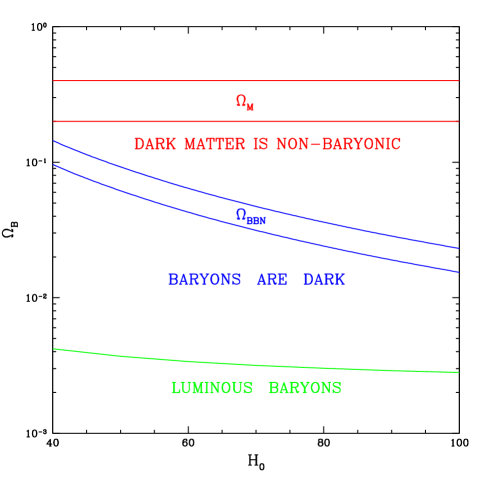
The gap between the upper limit to luminous baryons and the BBN band is the “dark baryon problem”: not all the baryons expected from BBN have been seen in the present universe. Perhaps it is hubris to expect that all baryons will choose to radiate (or absorb) in those parts of the spectrum we can see, or which our instruments can record. Indeed, from the absorption observed in the Lyman-alpha forest at redshifts of order 2 – 3 ([Weinberg, Miralda-Escudé, Hernquist, & Katz (1997), Weinberg, Miralda-Escudé, Hernquist, & Katz 1997]), it seems clear that the density of baryons in the present universe is much larger than the upper bound to luminous baryons shown in Figure 7. We return to a different estimate of the baryon density in the present/recent universe in § 4.
The gap between the BBN band and the band labelled is one aspect of the classical dark matter problem: the mass density inferred from the motions of galaxies exceeds the baryon density derived from BBN. Aside from those solutions which resort to modifying gravity (e.g., Sanders (2001) this volume), the standard assumption is that this gap provides evidence for the dominance at present of non-baryonic dark matter. Much of this Symposium was devoted to discussions of possible dark matter candidates and the means for their detection.
3 The Baryon Density At A Few Hundred Thousand Years
The early universe is radiation dominated. As the universe expands and cools, the density in non-relativistic matter becomes relatively more important, eventually dominating after a few hundred thousand years. At this stage perturbations can begin to grow under the influence of gravity and, on scales determined by the relative density of baryons, oscillations in the baryon-photon fluid will develop. When, at a redshift , the electron-proton plasma combines to form neutral hydrogen, the CMB photons are freed to propagate thoughout the universe. These CMB photons preserve the record of the baryon-photon oscillations through very small temperature fluctuations in the CMB spectrum which have been detected by the newest generation of experiments, beginning with COBE ([Bennett et al. (1996), Bennett et al. 1996]) and continuing with the exciting BOOMERANG ([boom1, de Bernardis et al. 2000]; [boom2, Lange et al. 2000]) and MAXIMA-1 ([max1, Hanany et al. 2000]) results which appeared somewhat more than a year ago. In Figure 8 we illustrate the status quo ante with the dramatic and challenging results from those earlier data.
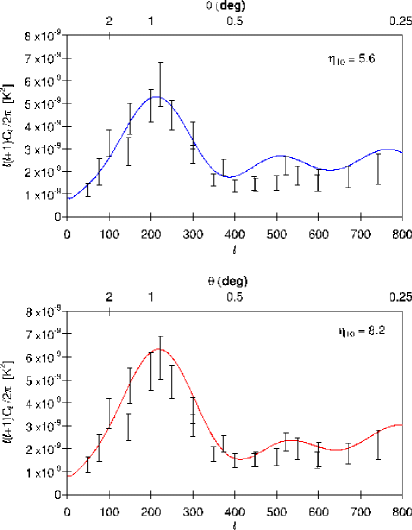
The relative heights of the odd and even peaks in the CMB angular fluctuation spectrum depend on the baryon density and the early BOOMERANG and MAXIMA-1 data favored a “high” baryon density (compare the “BBN case”, , in the upper panel with that for a baryon density some 50% higher shown in the lower panel). At the time of this Symposium, these were the extant data and they posed a challenge to the consistency of the standard model of cosmology.
At the Symposium we were told that new data would be forthcoming shortly and, the observers didn’t disappoint. In less than a month new (and some revised) data appeared (Halverson et al. 2001; Netterfield et al. 2001; Lee et al. 2001) which have eliminated the challenge posed by the older data. Although the extraction of cosmological parameters from the CMB data can be very dependent on the priors adopted in the analyses (see [Kneller, Scherrer, Steigman, & Walker (2001), Kneller et al. 2001]), the inferred baryon density is robust. [Kneller, Scherrer, Steigman, & Walker (2001)] find,
| (6) |
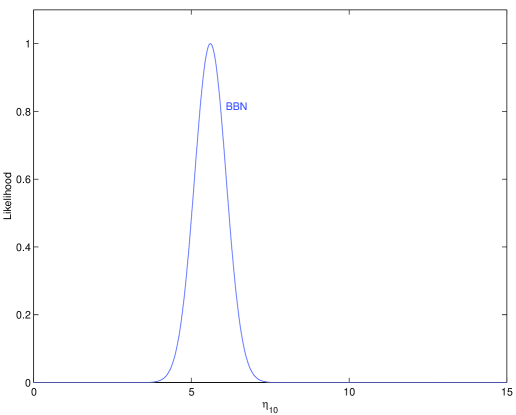
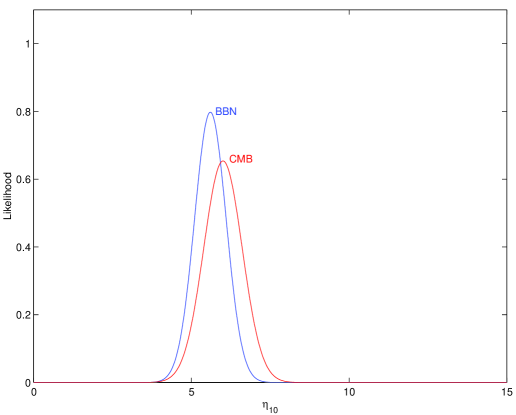
In Figure 9 is shown the comparison of the likelihoods for the nucleon-to-photon ratio from BBN, when the universe was some tens of minutes old, and from the CMB, some few hundred thousand years later. The excellent agreement between the two, independent estimates is a spectacular success for the standard model of cosmology and an illustration of the great potential for precision tests of cosmology.
4 The Baryon Density At 10 Gyr
As already discussed in § 2 (see Figure 7), the amount of baryons “visible” in the present universe is small compared to that expected on the basis of BBN (and, as seen in § 3, to that revealed by the CMB data). If most baryons in the present universe are dark, how can their density be constrained? There are a variety of approaches. Many depend on assumptions concerning the relation between mass and light, or require the adoption of a specific model for the growth of structure. In the approach utilized here we attempt to avoid such model-dependent assumptions. Instead, we use the data from the SNIa magnitude-redshift surveys ([Perlmutter et al. (1997), Perlmutter et al. 1997]; [Schmidt et al. (1998), Schmidt et al. 1998]; [Perlmutter et al. (1999), Perlmutter et al. 1999]), along with the assumption of a flat universe (which receives strong support from the newest CMB data (Halverson et al. 2001; Netterfield et al. 2001; Lee et al. 2001)) to pin down the total matter density (), which will be combined with an estimate of the universal baryon fraction () derived from studying the X-ray emission from clusters of galaxies. For more details on this approach, see [Steigman, Hata, & Felten (1999)] and [Steigman, Walker, & Zentner (2000)].
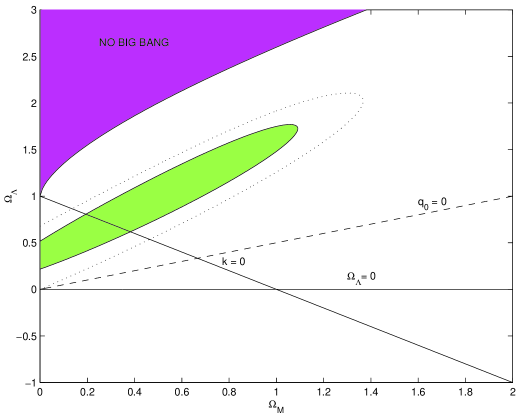
In Figure 10 are shown the SNIa-constrained 68% and 95% contours in the plane. The expansion of the universe is currently accelerating for those models which lie above the (dashed) q line. The line is for a “flat” (zero 3-space curvature) universe. As shown in [Steigman, Walker, & Zentner (2000)], adopting the assumption of flatness and assuming the validity of the SNIa data, leads to a reasonably accurate () estimate of the present matter density.
| (7) |
As the largest collapsed objects, rich clusters of galaxies provide an ideal probe of the baryon fraction in the present universe. Observations of the X-ray emission from clusters of galaxies permit constraints on the hot gas content of such clusters which, when corrected for baryons in stars (but, not for any dark baryons!), may be used to estimate . From observations of the Sunyaev-Zeldovich effect in X-ray clusters, [Grego et al. (2001)] constrain the hot gas fraction which [Steigman, Kneller, & Zentner (2001)] have used to estimate and to derive a present-universe ( Gyr; ) baryon density.
| (8) |
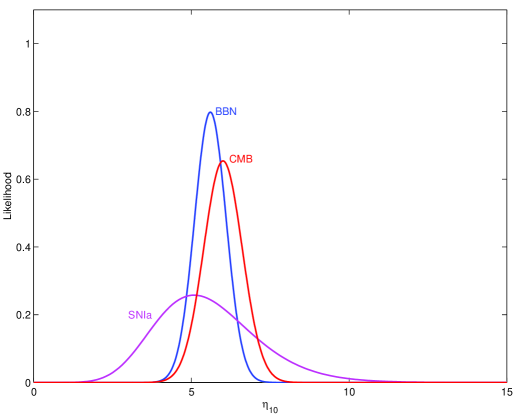
In Figure 11 the corresponding likelihood distribution for the present universe baryon density is shown (“SNIa”) along with those derived earlier from deuterium and BBN, and from the CMB fluctuation spectra. Although the uncertainties are largest for this present-universe value, it is in excellent agreement with the other, independent estimates.
5 Summary And Discussion
The abundances of the relic nuclides produced during BBN encode the baryon density during the first few minutes in the evolution of the universe. Of these relics from the early universe, deuterium is the baryometer of choice. The deuterium abundance in relatively unprocessed material, such as the high-z, low-Z QSO absorption line systems should be very nearly primordial. At present there are data for five such systems. Although the statistical accuracies of these data are high, the dispersion among them in the derived D/H ratio is surprisingly large, suggesting that systematic errors (interlopers?, complex velocity structure?) may effect one or more of these determinations. Nonetheless, these data seem consistent with a primordial abundance (D/H) ([O’Meara et al. (2001), O’Meara et al. 2001]) which was adopted in § 2 to derive ().
Several hundred thousand years later, when the universe became transparent to the CMB radiation, the baryon density was imprinted on the temperature fluctuation spectrum which has been observed by the COBE ([Bennett et al. (1996), Bennett et al. 1996]), BOOMERANG ([Netterfield et al. (2001), Netterfield et al. 2001]), MAXIMA ([Lee et al. (2001), Lee et al. 2001]), and DASI ([Halverson et al. (2001), Halverson et al. 2001]) experiments. For determining the baryon density, these current CMB data have a precision approaching that of BBN: (). The excellent agreement between the BBN and CMB values (see Fig. 9) provides strong support for the standard model of cosmology.
In the present universe most baryons are dark (), so that estimates of the baryon density some 10 billion years after the expansion began are more uncertain and, often model-dependent. In § 4 we combined an estimate of the total matter density () derived from the SNIa magnitude-redshift data ([Perlmutter et al. (1997), Perlmutter et al. 1997]; [Schmidt et al. (1998), Schmidt et al. 1998]; [Perlmutter et al. (1999), Perlmutter et al. 1999]) and the assumption of a flat universe (), with the universal baryon fraction inferred from X-ray observations of clusters of galaxies ([Grego et al. (2001), Grego et al. 2001]) to derive () ([Steigman, Kneller, & Zentner (2001), Steigman, Kneller, & Zentner 2000]). Although of much lower statistical accuracy, this estimate of the present universe baryon density is in complete agreement with those from BBN and the CMB (see Fig. 11). I note in passing that if the mass of dark baryons in clusters is similar to the stellar mass, this present-universe baryon density estimate would increase by , bringing it into essentially perfect overlap with the BBN and CMB values.
The concordance of the standard, hot, big bang cosmological model is revealed clearly by the overlapping likelihood distributions for the universal density of baryons shown in Fig. 11. As satisfying as this agreement might be, it should impell us to action, not complacency. How may we test further the standard model? One way is to return to the relic nuclides which, so far, have been set aside: 4He and 7Li.
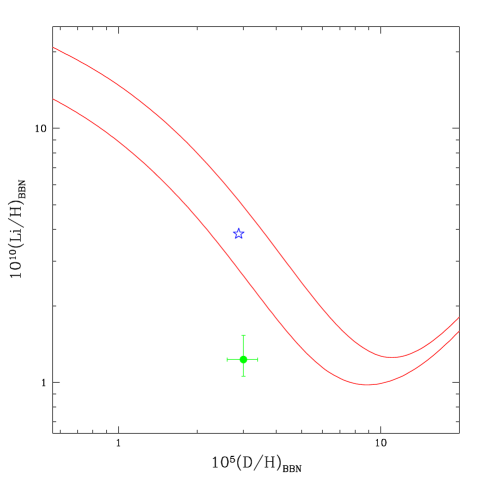
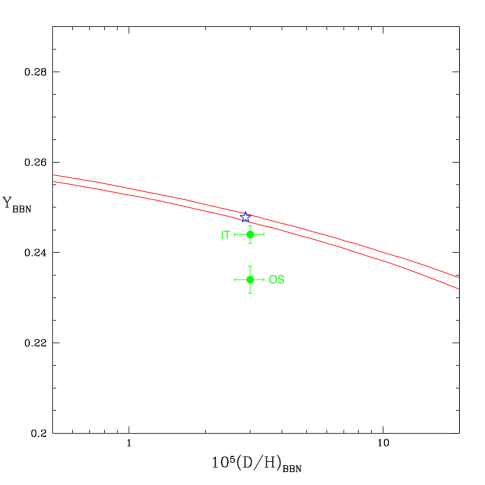
Consistency among the three, independent baryon density estimates permits us to identify a “best” value: (). For this baryon-to-photon ratio the BBN-predicted primordial abundances are: (D/H), Y, and (Li/H). These “best” estimates are shown by the “stars” in Figures 12 and 13. In those figures the bands reflect the BBN-predicted 4He vs. D and 7Li vs D relations, including the nuclear and weak interaction physics uncertainties. It is clear that the deuterium abundance is in excellent agreement with current data. What of 4He and 7Li?
At present there are two estimates for the primordial abundance of 4He based on large (nearly) independent data sets and analyses of low-metallicity, extragalactic H regions; see Fig. 12. The “IT” ([Izotov, Thuan, & Lipovetsky (1994), Izotov, Thuan, & Lipovetsky 1994], [Izotov & Thuan (1998), Izotov & Thuan 1998]) estimate of Y is only away from our best fit value of 0.248, while the “OS” determination ([Olive & Steigman (1995), Olive & Steigman 1995], [Olive, Skillman, & Steigman (1997), Olive, Skillman, & Steigman 1997], [Fields & Olive (1998), Fields & Olive 1998]) of Y is nearly lower. Although it may be tempting to dismiss the OS estimate, recent high quality observations of a relatively metal-rich H region in the SMC by [Peimbert, Peimbert, & Ruiz (2000)] reveal an abundance (Y) which is lower than the IT primordial value. When this abundance is extrapolated to zero metallicity, [Peimbert, Peimbert, & Ruiz (2000)] find Y, in excellent – albeit accidental! – agreement with the OS value. The comparisons among different observations and between theory and observations suggest that unaccounted systematic errors (underlying stellar absorption weakening the helium emission lines?) may have contaminated at least some of the data.
The comparison between theory and data for 7Li poses much more of a challenge; see Fig. 13. The data point plotted in Fig. 13, from [Ryan et al. (2000)]: (Li/H), is lower by a factor of three ( dex) than the standard model prediction (the “star” in Fig. 13). There are, however, good reasons to believe that the low value of the lithium abundance derived by [Ryan et al. (2000)] from observations of metal-poor, old stars ([Ryan, Norris, & Beers (1999), Ryan, Norris & Beers 1999]) is not representative of the lithium abundance in the gas out of which these stars formed ([Pinsonneault et al. (1999), Pinsonneault et al. 1999]; [Salaris & Weiss (2001), Salaris & Weiss 2001]; [Pinsonneault et al. (2001), Pinsonneault et al. 2001]; [Theado & Vauclair (2001), Theado & Vauclair 2001]). Using a model for lithium depletion via rotational mixing over the long lifetimes of these stars, [Pinsonneault et al. (2001)] reanalyzed the [Ryan, Norris, & Beers (1999)] data and concluded that the primordial lithium abundance should be higher than the [Ryan et al. (2000)] value by dex, bringing the abundance inferred from the earliest generation of stars in the Galaxy in closer agreement with that expected for the “best” estimate of the baryon density in the standard cosmological model.
6 Conclusions
Increasingly precise observational data permit us to track the baryon density from the big bang to the present. At widely separated epochs from the first few minutes, through the first few hundred thousand years, to the present universe, a consistent value emerges, accurate to better than 10%: (). Such a low baryon density () reinforces the need for non-baryonic dark matter (), which itself appears to be subdominant at present to an unknown form of dark energy. Precision cosmology has led us to an extreme form of the Copernican Principle! While this baryon density is fully consistent with present estimates of the primordial deuterium abundance, it challenges the data and “astrophysics” used to determine the primordial abundances of 4He and 7Li. If unresolved by new data, or better astrophysics, these conflicts might be providing a peek at new physics beyond the standard models of cosmology and/or particle physics. These are surely exciting times.
Acknowledgements.
For valuable advice, assistance, and tutorials I wish to thank Gus Evrard, Jim Felten, Jim Kneller, Jeff Linsky, Joe Mohr, Paulo Molaro, Keith Olive, Manuel Peimbert, Max Pettini, Marc Pinsonneault, Bob Scherrer, Evan Skillman, David Tytler, Sueli Viegas, Terry Walker, and Andrew Zentner. Praise is due Mario Livio and the efficient staff of the STScI for the smooth organization of an exciting meeting. My research is supported by DOE grant DE-FG02-91ER-40690.References
- [Bennett et al. (1996)] Bennett, C. L., et al. 1996 ApJ 464, L1.
- [Burles & Tytler (1998a)] Burles, S. & Tytler, D. 1998a ApJ 499, 699.
- [Burles & Tytler (1998b)] Burles, S. & Tytler, D. 1998b ApJ 507, 732.
- [Burles, Nollett, & Turner (2001)] Burles, S., Nollett, K. M., & Turner, M. S. 2001 Phys. Rev. D63, 063512.
- [Cyburt, Fields, & Olive (2001)] Cyburt, R. H., Fields, B. D., & Olive, K. A. 2001 preprint (astro-ph/0102179).
- [D’Odorico, Dessauges-Zavadsky, & Molaro (2001)] D’Odorico, S., Dessauges-Zavadsky, M., & Molaro, P. 2001 A&A, 338, L1.
- [Epstein, Lattimer, & Schramm (1976)] Epstein, R., Lattimer, J., & Schramm, D. N. 1976 Nature 263, 198.
- [Fields & Olive (1998)] Fields, B. D. & Olive, K. A. 1996 ApJ 506, 177.
- [Freedman et al. (2001)] Freedman, W. L., et al. 2001 ApJ, 553, 47.
- [Jedamzik & Fuller (1997)] Jedamzik, K. & Fuller, G. 1997 ApJ 483, 560.
- [Gloeckler & Geiss (2000)] Gloeckler, G. & Geiss, J. 2000 Proceedings of IAU Symposium 198, The Light Elements and Their Evolution (L. da Silva, M. Spite, and J. R. Medeiros eds.; ASP Conference Series), p. 224.
- [Grego et al. (2001)] Grego, L., et al. 2001 ApJ 552, 2.
- [Halverson et al. (2001)] Halverson, N. W., et al. 2001 preprint (astro-ph/0103305).
- [Izotov, Thuan, & Lipovetsky (1994)] Izotov, Y. I., Thuan, T. X., & Lipovetsky, V. A. 1994 ApJ 435, 647.
- [Izotov & Thuan (1998)] Izotov, Y. I. & Thuan, T. X. 1998 ApJ 500, 188.
- [Kirkman et al. (2001)] Kirkman, D., et al. 2001 preprint (astro-ph/0104489).
- [Kneller, Scherrer, Steigman, & Walker (2001)] Kneller, J. P., Scherrer, R. J., Steigman, G., & Walker, T. P. 2001 preprint (astro-ph/0101386).
- [Lee et al. (2001)] Lee, A. T., et al. 2001 preprint (astro-ph/0104459).
- [Levshakov, Dessauges-Zavadsky, D’Odorico, & Molaro (2001)] Levshakov, S. A., Dessauges-Zavadsky, M., D’Odorico, S., & Molaro, P. 2001 preprint (astro-ph/0105529).
- [Linsky & Wood (2000)] Linsky, J. L. & Wood, B. E. 2000 Proceedings of IAU Symposium 198, The Light Elements and Their Evolution (L. da Silva, M. Spite, and J. R. Medeiros eds.; ASP Conference Series), p. 141.
- [Netterfield et al. (2001)] Netterfield, C. B., et al. 2001 preprint (astro-ph/0104460).
- [Olive & Steigman (1995)] Olive, K. A. & Steigman, G. 1995 ApJ Suppl. 97, 49.
- [Olive, Skillman, & Steigman (1997)] Olive, K. A., Skillman, E., & Steigman, G. 1997 ApJ 483, 788.
- [Olive, Steigman, & Walker (2000)] Olive, K. A., Steigman, G., & Walker, T. P. 2000 Phys. Rep. 333. 389.
- [O’Meara et al. (2001)] O’Meara, J. M., et al. 2001 ApJ 552, 718.
- [Peimbert, Peimbert, & Ruiz (2000)] Peimbert, M., Peimbert, A., & Ruiz, M. T. 2000 ApJ 541, 688.
- [Perlmutter et al. (1997)] Perlmutter, S., et al. 1997 ApJ 483, 565.
- [Perlmutter et al. (1999)] Perlmutter, S., et al. 1999 ApJ 517, 565.
- [Persic & Salucci (1992)] Persic, M. & Salucci, P. 1992 MNRAS 258, 14P.
- [Pettini & Bowen (2001)] Pettini, M. & Bowen, D. V. 2001 preprint (astro-ph/0104474).
- [Pinsonneault et al. (1999)] Pinsonneault, M. H., Walker, T. P., Steigman, G., & Narayanan, V. K. 1999 ApJ 527, 180.
- [Pinsonneault et al. (2001)] Pinsonneault, M. H., Steigman, G., Walker, T. P., & Narayanan, V. K. 2001 preprint (astro-ph/0105439).
- [Ryan, Norris, & Beers (1999)] Ryan, S. G., Norris, J. E., & Beers, T. C. 1999 ApJ 523, 654.
- [Ryan et al. (2000)] Ryan, S. G., Beers, T. C., Olive, K. A., Fields, B. D., & Norris, J. E. 2000 ApJ 530, L57.
- [Salaris & Weiss (2001)] Salarais, M. & Weiss, A. 2001 preprint (astro-ph/0104406).
- [Sanders (2001)] Sanders, R.H. 2001 preprint (astro-ph/0106558).
- [Schmidt et al. (1998)] Schmidt, B. P., et al. 1998 ApJ 507, 46.
- [Steigman & Felten (1995)] Steigman, G. & Felten, J. E. 1995 Spa. Sci. Rev. 74, 245.
- [Steigman, Hata, & Felten (1999)] Steigman, G., Hata, N., & Felten, J. E. 1999 ApJ 510, 564.
- [Steigman, Kneller, & Zentner (2001)] Steigman, G., Kneller, J. P., & Zentner, A. 2001 preprint (astro-ph/0102152).
- [Steigman, Walker, & Zentner (2000)] Steigman, G., Walker, T. P., & Zentner, A. 2000 preprint (astro-ph/0012149).
- [Theado & Vauclair (2001)] Theado, S. & Vauclair, S. 2001 preprint (astro-ph/0106080).
- [Webb et al. (1997)] Webb, J. K., Carswell, R. F., Lanzetta, K. M., Ferlet, R., Lemoine, M., Vidal-Madjar, A., & Bowen, D. V. 1997 Nature 388, 250.
- [Weinberg, Miralda-Escudé, Hernquist, & Katz (1997)] Weinberg, D. H., Miralda-Escudé, J., Hernquist, L., & Katz, N. 1997 ApJ 490, 564.