Annihilation Radiation in the Galaxy
Abstract
Observations of annihilation radiation in the Galaxy are briefly reviewed. We summarize astrophysical mechanisms leading to positron production and recent estimates for production rates from nova and supernova nucleosynthesis in the Galaxy. The physical processes involved in the production of annihilation radiation in the interstellar medium are described. These include positron thermalization, charge exchange, radiative recombination, and direct annihilation. Calculations of 2 and 3 spectra and the positronium (Ps) fraction due to the annihilation of positrons in media containing H and He at different temperatures and ionization states are presented. Quenching of Ps by high temperature plasmas or dust could account for differences between 0.511 MeV and Ps continuum maps. These results are presented in the context of the potential of INTEGRAL to map sites of annihilation radiation in the Galaxy. Positron production by compact objects is also considered.
keywords:
positrons; gamma rays; nucleosynthesis; supernovae1 Introduction
With an omnidirectional flux of ph cm-2 s-1, the e+- annihilation line at 0.511 MeV is the brightest gamma-ray line in the Galaxy. Associated with the line is the positronium continuum formed by the decay of Positronium (Ps) atoms in the 3S1 state. The fraction of positrons that annihilate via the formation of Ps depends on the temperature, density, composition, and dust content of the medium. Consequently observations of and fluxes and line widths reveal the ISM properties at sites where positrons annihilate. Past missions have provided limited information on ISM conditions at localized sites because they employed non-imaging detectors with large fields-of-view (FoVs). Moreover, many earlier annihilation line observations used scintillation detectors rather than germanium spectrometers, and so were not able to resolve the width of the 0.511 MeV line. The capability of INTEGRAL to resolve and image the annihilation line — though not without considerable technical hurdles — promises to revolutionize our view of the Galaxy in the light of the e+- annihilation line.
This review summarizes the status of annihilation line astrophysics in the period following the demise of the Compton Gamma Ray Observatory and preceding the launch of INTEGRAL. In Section 2, past observations of annihilation radiation in the Galaxy are briefly reviewed. Section 3 summarizes the principal astrophysical processes that yield positrons, including recent calculations of positron production by novae, supernovae, cosmic rays, and galactic compact objects. Physical processes leading to the 2 line and 3 continuum are summarized in Section 4, and new calculations of line and continuum spectra and 3/ flux ratios in different media are presented in Section 5. The review is concluded in Section 6 with a discussion of prospects for INTEGRAL to identify the origin of positrons that produce annihilation radiation, including positron production by Galactic compact objects.
2 Spectra of Galactic Annihilation Radiation
The spectrum of the Galaxy as measured by a soft -ray telescope is complicated not only by the internal and particle backgrounds of the detector, but also by variable Galactic -ray point sources and the unknown distribution of diffuse emissions in the Galaxy. These technical difficulties have been dealt with in a variety of ways, leading to our present incomplete picture of the annihilation emission of the Galaxy.
The 0.511 MeV line was originally discovered by the Rice University group (Johnson & Haymes, 1973), though positive identification of the line required the flight of a germanium detector (Leventhal et al., 1978) which showed that the line, averaged over the 15∘ FoV of the Bell-Sandia telescope, has a FWHM width keV. Other observations of annihilation radiation have employed broad field-of-view instruments, the largest being the 130∘ FWHM FoV of the Solar Maximum Mission Gamma Ray Spectrometer (Share et al., 1988). By showing that the measured flux correlates with the opening angle of the detector, Lingenfelter & Ramaty (1989) firmly established that there exists a diffuse component of the annihilation radiation in the Galaxy. They also argued for the existence of a variable, time-dependent source of annihilation radiation on the basis of multiple observations made with the HEAO-3 and Bell-Sandia germanium spectrometers. Later analysis of the HEAO-3 data (Mahoney et al., 1994) showed that the evidence for a variable point source was marginal, and no evidence for a variable annihilation component has been obtained through 5.5 (Purcell et al., 1997) and 8.5 (Milne et al., 1999) years of observations of the Galactic Center region with the OSSE instrument on Compton GRO.
OSSE has been used to measure the Galactic annihilation radiation in the greatest detail (Milne et al., these proceedings). With a FWHM FoV of 11.4, representing about 0.1% of the full sky, OSSE can map annihilation radiation through multiple observations in different directions. This requires offset pointing to subtract background and sophisticated mapping techniques to map diffuse emission. An observation lasting for two 2-week periods is shown in Fig. 1, and illustrates the dominant features in the spectrum of a Galactic Center pointing. Shown is the spectrum measured during Viewing Periods 5 and 16 (Kinzer et al., 1999). The prominent 0.511 MeV annihilation line has a flux of ph cm-2 s-1. The deduced flux of the continuum is ph cm-2 s-1.

The omnidirectional flux of 0.511 MeV annihilation radiation measured with the Solar Maximum Mission is ph cm-2 s-1, though the precise flux measurement depends on whether the underlying distribution of the annihilation radiation is assumed to be described by a Galactic Center point source or a distribution described by, for example, the galactic CO emission (Share et al., 1990; Harris et al., 1990). The omnidirectional flux inferred (Purcell et al., 1997) through analyses of OSSE and earlier annihilation line observations is ph cm-2 s-1, consistent with the SMM result.
Naively assuming that the bulk of the annihilation takes place at the distance of the Galactic Center implies a total Galactic annihilation rate of kpc ph s-1. Letting represent the fraction of positrons that annihilate via the intermediate formation of Ps, then each produced annihilation photons, because a Ps atom decays 1/4 of the time via the state. If , as implied by spectral analyses, then positron sources in the Milky Way are producing a time-averaged rate e+ s-1.
The structure in the distribution of annihilation radiation can be determined either through model-dependent (Skibo, 1993) or model-independent (Purcell et al., 1997; Cheng et al., 1997; Milne et al., 1999) mapping techniques. In the former approach, one assumes that the annihilation radiation is described by model spatial distributions, for example, those describing novae, pulsars, hot plasma, or MeV gamma-ray distributions. One then minimizes of the observations with respect to various superpositions of the model distributions. This method is limited if the model distributions provide a poor characterization of features peculiar to the true spatial distribution of annihilation radiation. These methods were used to argue that a disk component, a bulge feature related to an old stellar population, and a time-variable point source were required to fit available 0.511 MeV line observations (Ramaty et al., 1994).
Model-independent mapping techniques, employing Singular Value Decomposition or the Maximum Entropy Method algorithms, can be used to reconstruct the image without recourse to assumptions about underlying model distributions. Using these methods, Purcell et al. (1997) showed that OSSE observations were described by the following emission components:
-
•
Positive galactic plane: ,
-
•
Negative galactic plane: ,
-
•
Central bulge: ,
-
•
Positive latitude enhancement: ,
-
•
Mirror region: ,
where the fluxes are given in units of ph cm-2 s-1. This analysis results in a flux for the full map of ph cm-2 s-1, which is consistent with the omnidirectional flux quoted earlier when consideration of emission in regions not observed with OSSE was included. The asymmetry associated with the positive latitude enhancement has been interpreted (Dermer & Skibo, 1997) in terms of annihilation fountain of pair-laden hot plasma driven by a starburst from the Galactic Center region into the halo of the Galaxy.
Later analysis (Milne et al., 1999) has confirmed that the positive latitude enhancement has a flux -2 ph cm-2 s-1, though there is only marginal evidence for a high-latitude enhancement in the positronium map. This implies that Ps is quenched in the fountain, either because the temperature is very high or the region is dusty. The first possibility can be determined by measuring the line width of the annihilation radiation in this direction, and will be discussed in more detail in the Section 5.
3 Positron Processes and Production Sites
| Processes | |
|---|---|
| N N+e+ | few |
| N + p e+ | |
| N + N N N + e+ | few |
| e+e- | - |
| e+e- | few |
As we have seen, sources must produce e+ s-1 to account for the diffuse annihilation glow of the Milky Way. Table 1 lists astrophysical processes that make positrons. The first row represents channels where e+ are produced through decay of nuclei formed in explosive and hydrostatic nucleosynthesis of novae, supernovae (SNe), Wolf-Rayet and Asymptotic Giant Branch stars. The positrons produced through this channel have a characteristic decay spectrum with typical kinetic energies of MeV. The second row represents secondary production interactions between cosmic ray protons and ions that produce a characteristic decay spectrum of positrons peaking at 30 MeV. Positrons can also be produced in stellar flares through this process. The third row represents cosmic ray interactions that form ions which subsequently decay through the emission of positrons. Depending on whether the ions are at rest or are in motion, positrons are formed with Lorentz factors ranging from only a few to values roughly equal to the Lorentz factors of the excited ion. This process can be important in stellar flares and in accreting neutron stars and black holes, and in regions with enhanced fluxes of low-energy cosmic rays.
The fourth row represents positrons formed by pulsar electromagnetic cascades. Here curvature or synchrotron photons materialize in the strong magnetic field near a pulsar polar cap. These positrons can escape through magnetic fields that open through the light cylinder. The Lorentz factors of positrons made in this way are, however, usually so large that they will not thermalize on a time scale corresponding to the age of the Galaxy. The pair production process of the fifth row occurs in luminous compact regions that may be found in galactic black hole candidates, microquasars, active galactic nuclei, and in gamma-ray bursts (Dermer & Böttcher, these proceedings). Not listed in Table 1 are higher-order processes such as triplet pair production e e+e+ +e-, and direct pair production e+ N e+ N + e+ + e-, which are generally much less important because of their small cross sections.
3.1 Positron Production in Novae
There are four principal channels for the production of positrons in Novae; these are,
-
1.
13Ni C, s, 100%
-
2.
18F O, min, 96.9%
-
3.
22Na Ne, yr, 90.4%
-
4.
26Al Mg, yr, 82% and (1.809 MeV),
where we also list the half-life and the fraction of decays that yield positrons. Nucleosynthesis in novae is discussed at this conference by Hernanz; here we only note that the first two channels of production are sufficiently prompt that the produced positrons will annihilate in the dense material formed in the nova explosion Hernanz et al. (1999), whereas e+ made through the latter two channels will be mixed in the expanding envelope and can be injected into the ISM. The Galaxy-averaged production rate of novae from Oxygen/Neon white dwarfs is estimated by (Hernanz et al., 1999a) to be - e+ s-1 and - e+ s-1 for the 22Na and 26Al channels, respectively. The quantity is the yearly rate of novae throughout the Galaxy. Starrfield et al. (1997) give - e+ s-1 and - e+ s-1 for these rates, which are slightly larger but consistent given the many uncertainties in the calculation. They also calculate the e+ production rate from novae on CO white dwarfs, and obtain - e+ s-1 and - e+ s-1. The yearly rate of novae throughout the Galaxy is estimated from observations to be per year. If a significant fraction of these novae are produced on O/Ne white dwarfs, then novae can provide a nonnegligible amount of the positrons injected into the Galaxy and would contribute to both the disk and bulge annihilation radiation.
3.2 Positron Production from SNe and Stellar Winds
The dominant channels for positron production and the associated ray lines formed through hydrostatic and explosive nucleosynthesis are
-
1.
57NiCo, hr, 40% and (1370 keV), followed by 57Co Fe, d, (122, 136 keV);
-
2.
56NiCo, d, (150, 750, 812 keV), followed by 56Co Fe, 78.8 d, 18% (847, 1238 keV);
-
3.
44TiSc, yr, (67.8, 78.4 keV), followed by 44ScCa, yr, 95% and (1.16 MeV);
-
4.
26Al Mg, yr, 82% and (1.809 MeV).
The decay lifetime from the channel 1 is too short to permit the positrons to escape from the ejecta into the ISM, so only a prompt 0.511 MeV line could be formed, and this would be severely degraded in optically thick material. The positron production rates into the ISM from Type Ia and Type II supernovae for the remaining channels depend sensitively on the percentage of positrons that escape into the ISM. For channel 2, Chan & Lingenfelter (1993) find that e+ s-1, where is the average number of solar masses of synthesized 56Fe per SN, and is the mean number of Type Ia SNe per century in the Milky Way. Woosley & Weaver (1992) calculate that . From these rates, it is clear that Type Ia SNe are capable of making an important if not dominant contribution to positron production, depending crucially on the escape fraction (Milne et al., 1999a).
Positron production through the 56NiCoFe channel in Type II SNe is estimated by Chan & Lingenfelter (1993) to be e+ s-1. Because of the thickness of the overlying envelope in Type II SNe, the escape fraction is very poorly known and is probably %. At best, this channel could make a minor contribution to the total positron production rate in the Galaxy.
The much smaller synthesized mass of 44Ti compared with 56Fe means that the 44TiScCa channel makes a small contribution to the Galactic positron production rate from Type Ia SNe, even taking into account the longer decay time scale and larger positron escape fraction. The production rate from Type Ib and II SNe depends on the large uncertainties in the amount of synthesized mass per SNe. In the extreme case, the positron production rate from Type Ia, Ib, and II SNe is estimated to be e+ s-1 (Chan & Lingenfelter, 1993).
All positrons produced through the 26AlMg chain escape into the ISM due to the long lifetime of 26Al. The 1.809 MeV line therefore provides a tracer of positron production through channel 4. With an omnidirectional 1.809 MeV flux of cm-2 s-1 (Diehl et al., 1995), this implies an associated Galactic positron production rate of e+ s-1. Type II SNe produce positrons from 26Al at a rate of e+ s-1, where the mass of 26Al produced per SN ranges from (Prantzos, 1996). It is therefore likely that other sources contribute to 26Al production, such as massive stellar winds and novae. Winds from Wolf-Rayet stars produce positrons at the rate of e+ s-1 (Meynet et al., 1997). AGB stars (Mowlavi, these proceedings) and novae can also make significant contributions. Thus the annihilation line map of the Galaxy should display a component that traces the 1.809 MeV map, although transport of the positrons from the production to the annihilation site could modify the spatial correlation, as would be the case for the positive latitude enhancement if due to a starburst/superwind (Dermer & Skibo, 1997).
3.3 Other Positron Sources
Cosmic rays produce positrons through the same strong interactions that produce gamma rays. Thus the -ray emission centered at MeV provides a tracer of positron production. COS-B analyses (Bloemen et al., 1984) imply that the Galaxy produces 100 MeV ph s-1. The and production cross sections are roughly equal, though two -ray photons are made from each . Thus the 100 MeV Galactic gamma-ray production rate also roughly represents an upper limit to the positron production rate from cosmic ray interactions, after correcting for the emission below 100 MeV and noting that bremsstrahlung and Compton photons substantially contribute to the diffuse Galactic gamma-ray background. Large fluxes of low-energy cosmic rays would also contribute to positron production through decay of radioactive nuclei. COMPTEL upper limits to nuclear deexcitation gamma rays (Bloemen et al., 1999) suggest that positrons made through this process do not, however, significantly contribute to the overall Galactic annihilation line flux.
Although difficult to quantify, compact objects could eject large numbers of positrons into the ISM. Galactic black-hole candidate sources (Dermer & Liang, 1988) and microquasars (Li & Liang, 1996) are the two leading candidates for producing localized and time-variable sites of annihilation radiation. Individual sources could eject - e+ s-1 into the ISM. Evidence has been presented from Sigma/Granat observations of 1E 1740.7-2942 and Nova Muscae for episodes of line emission at keV that was attributed to redshifted annihilation radiation (for a review, see Harris, 1997), but OSSE has not detected variable annihilation radiation or annihilation lines from black-hole candidate sources such as Cygnus X-1 (Phlips et al., 1996). As already noted, electromagnetic cascades in pulsars would probably produce positrons with Lorentz factors too great to thermalize within the lifetime of the Galaxy. Production of positrons by GRBs in the Galaxy is discussed in a separate contribution (Dermer & Böttcher, these proceedings).
4 Positron Annihilation Processes
Early calculations of positron annihilation in the ISM were treated by Bussard et al. (1979), and in Solar flares by Crannell et al. (1976). Updated cross sections and processes related to the annihilation of positrons are discussed in detail elsewhere (Guessoum et al., 1991, 1997), so they are reviewed only briefly here. Positrons injected into the ISM will annihilate directly or thermalize. Thermalization is more important than annihilation for positrons injected at MeV energies, and direct annihilation of higher energy positrons produces a line that is invariably too broadened to be detectable. Positrons thermalize through Coulomb losses with free electrons, and through excitation and ionization energy losses with bound electrons. When a positron’s energy reaches a few hundred eV, the energy-loss processes compete primarily with the formation of Ps through charge exchange in flight, as the rate of direct annihilation-in-flight is small. Thermal positrons either annihilate directly with free or bound electrons, or form Ps through radiative recombination and charge exchange. Charge exchange with neutral hydrogen has a 2430 Å threshold, so this process is suppressed in sufficiently low-temperature gases.
Ps is formed in the triplet () ortho-Ps and singlet () para-Ps ground states in a 3:1 ratio, with decay lifetimes of s and s, respectively. Cascading to the ground state can produce a Ly- line at 6.8 eV and other lines that are very weak but, in principle, detectable (Burdyuzha & Kauts, 1994; Wallyn et al., 1996). Ps can be quenched if the density is cm-3, though this is not relevant for annihilation in the ISM. Annihilation of thermalized positrons on dust (Zurek, 1985; Guessoum et al., 1991) is also an important quenching process for Ps, leading to a suppression of the continuum. These calculations are complicated by grain properties, including their sizes, charges, and compositions. Guessoum et al. (1991) find that the presence of dust in the warm envelopes around cold molecular cloud cores can reduce the Ps fraction, but that dust is unlikely to affect the annihilation line and continuum properties in the uniform ISM.
5 Calculations of Annihilation Line and Continuum Spectra
We have developed a computer code to calculate the 0.511 MeV line spectrum and relative strength of the continuum. The code incorporates updated cross sections to calculate thermally-averaged rates for all relevant binary interactions involving positrons, and uses a Monte Carlo technique to simulate the thermalization and Ps production of MeV positrons. We include charge exchange with neutral and singly-ionized helium, which have generally been ignored in astrophysical applications. Processes involving dust and are not yet included.
| Energy Redistribution | Positronium Formation |
|---|---|
| H H∗ | Ps |
| H H+ | H H+ Ps |
| He He∗ | He He+ Ps |
| He He+ | |
| Positronium Quenching | Annihilation |
| Ps | |
| H 3Ps H | H H+ |
| Ps Ps | He He+ |
| H 3Ps H 1Ps | 1Ps |
| H+ Ps H | 3Ps |
| He+ Ps He |
For the formation of Ps, we include radiative recombination with free electrons and charge exchange with hydrogen and neutral He. For Ps quenching, we include breakup of Ps by neutral hydrogen, ortho-Ps quenching via free electrons and via electrons bound in H, inverse charge exchange with H and He, and ionization of ortho-Ps atom by free electrons. This last reaction turns out only to be important in ionized gases at densities cm-3, and is relevant to positron annihilation at the Sun.
For the Monte Carlo determination of the fraction of positrons forming Ps before thermalization and the resulting Ps energy distribution, we include He and we use an updated experimentally-determined cross section for charge exchange in hydrogen. We find that this new cross section results in higher Ps production than previously calculated, and the resulting annihilation line width is broader.
The Ps formation, quenching and energy loss processes along with the positron annihilation processes treated in our calculations are shown in Table 2. The important diagnostic spectral features of annihilation radiation are the ratio and the FWHM width of the line. These two quantities depend upon the conditions of the medium where the annihilation occurs. The medium can be characterized by the temperature , the total (neutral + ionized) hydrogen density , and the ionization fractions , and . We use the non-thermal and thermally-averaged rates discussed above to solve a system of continuity equations for pair equilibrium and provide rates for positron annihilation from all of the various processes. These rates then directly give . The total line spectrum is the sum of several components, some having Gaussian shapes, others not. Hence, the total line shape will not, in general, be Gaussian.
| Cold | Warm | Warm | Hot | |
|---|---|---|---|---|
| Neutral | Neutral | Ionized | ||
| T(K) | 80 | 8000 | 8000 | |
| nHI | 38 | 0.31 | 0.06 | 0.0 |
| ne | 0.0 | 0.055 | 0.17 | |
| nHI | 0.0 | 0.055 | 0.17 | |
| nHeI | 3.8 | 0.036 | 0.023 | 0.0 |
| nHeII | 0.0 | 0.0 | 0.0 | 0.0 |
| nHeIII | 0.0 | 0.0 | 0.0 |
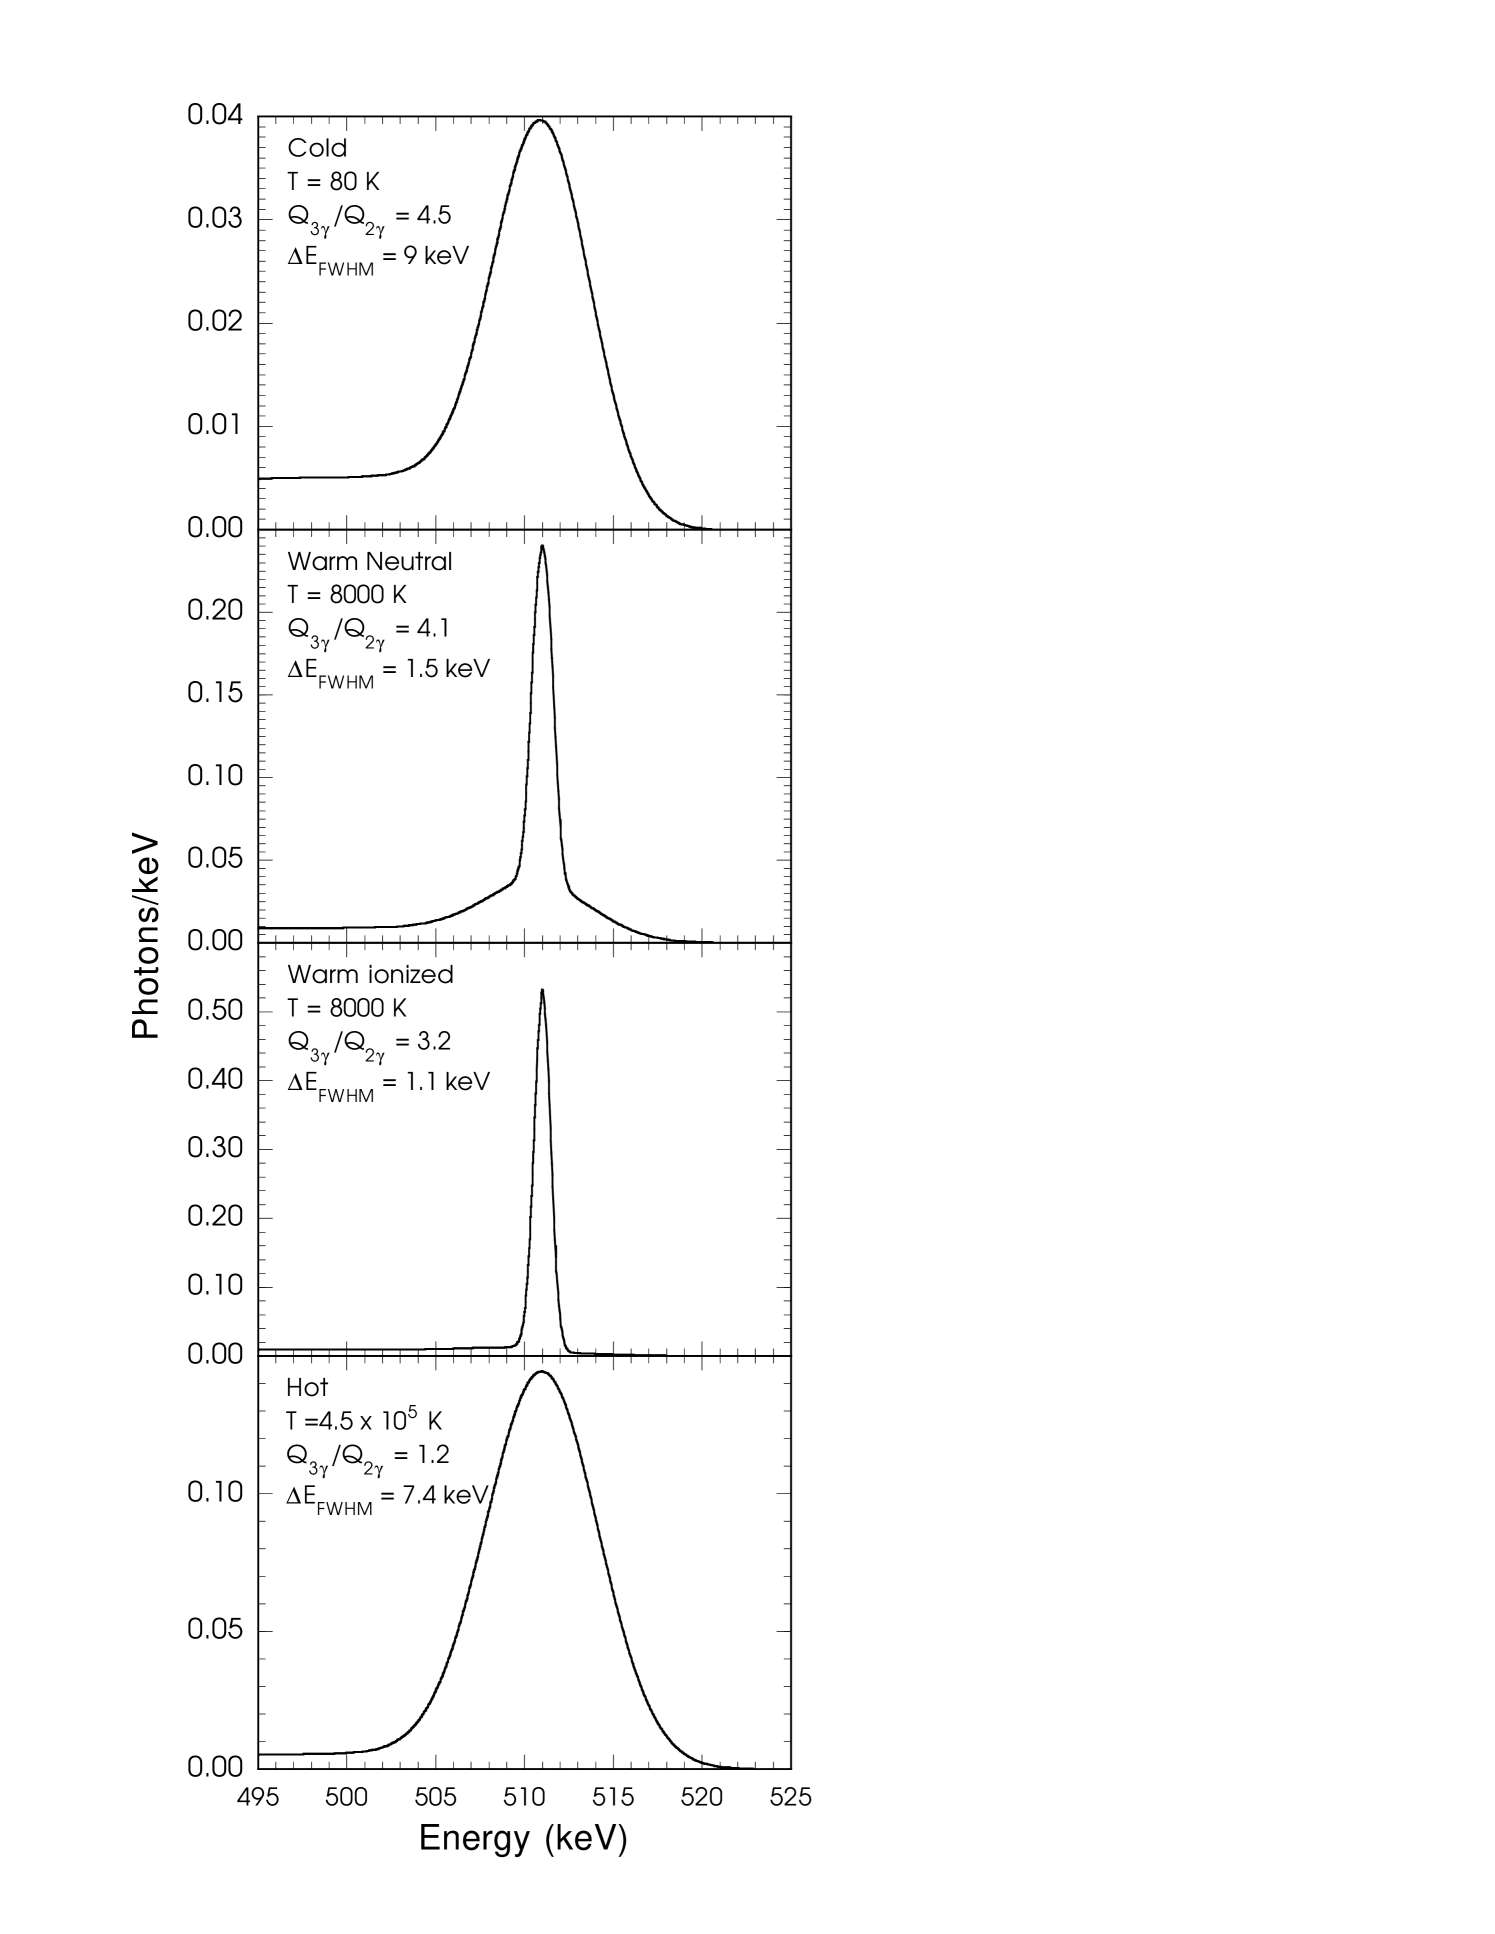
Fig. 2 shows calculations of the annihilation line and Ps continuum for phases of the ISM with temperatures and densities given by Table 3. Fig. 3 shows calculations of the same quantities for high temperature, fully ionized media. The quantities , giving the relative number of photons in the Ps continuum to the 0.511 MeV line, and the FWHM line width , from Figs. 2 and 3, are plotted in Fig. 4. In the limit of a fully neutral medium, all annihilation takes place through the formation of Ps. Consequently , because 3/4 of the annihilations take place via ortho-Ps, giving 3 photons per annihilation, whereas 1/4 of the annihilations take place via para-Ps, giving 2 photons per annihilation. Annihilation occurs before thermalization in a fully neutral medium, so the calculated 9 keV line width for the neutral medium is broader than for partially ionized media where the positrons generally thermalize before annihilating.
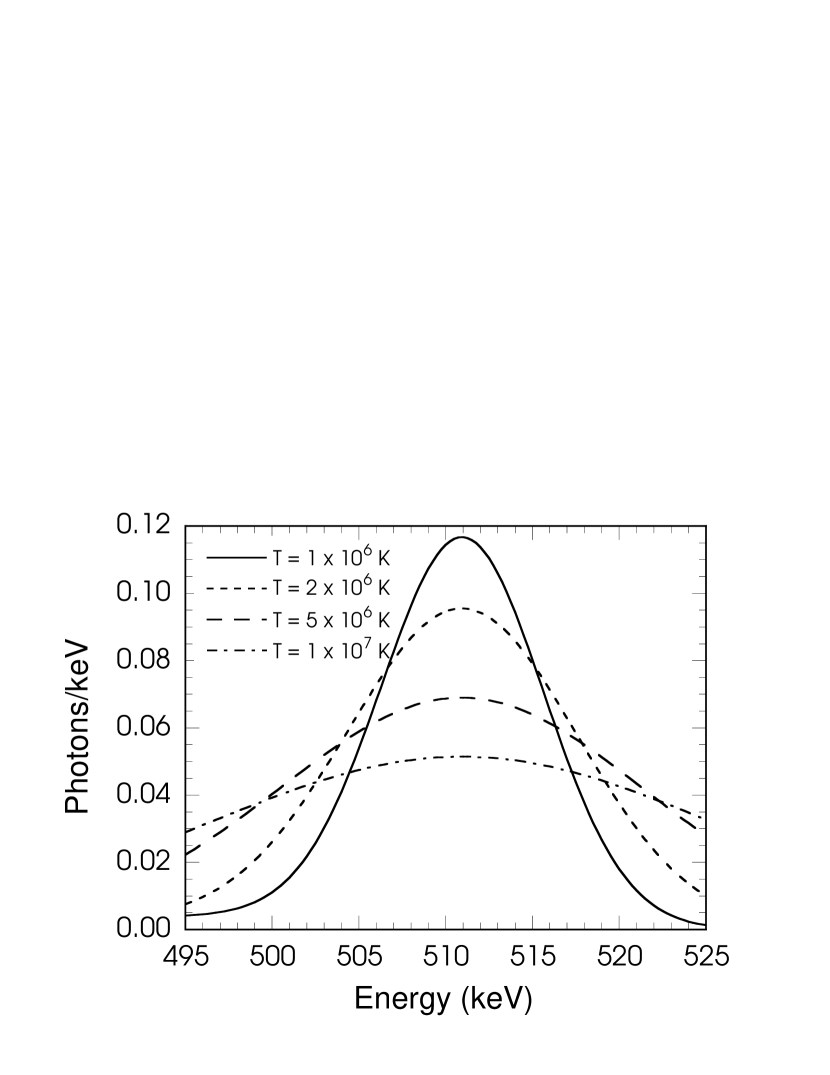
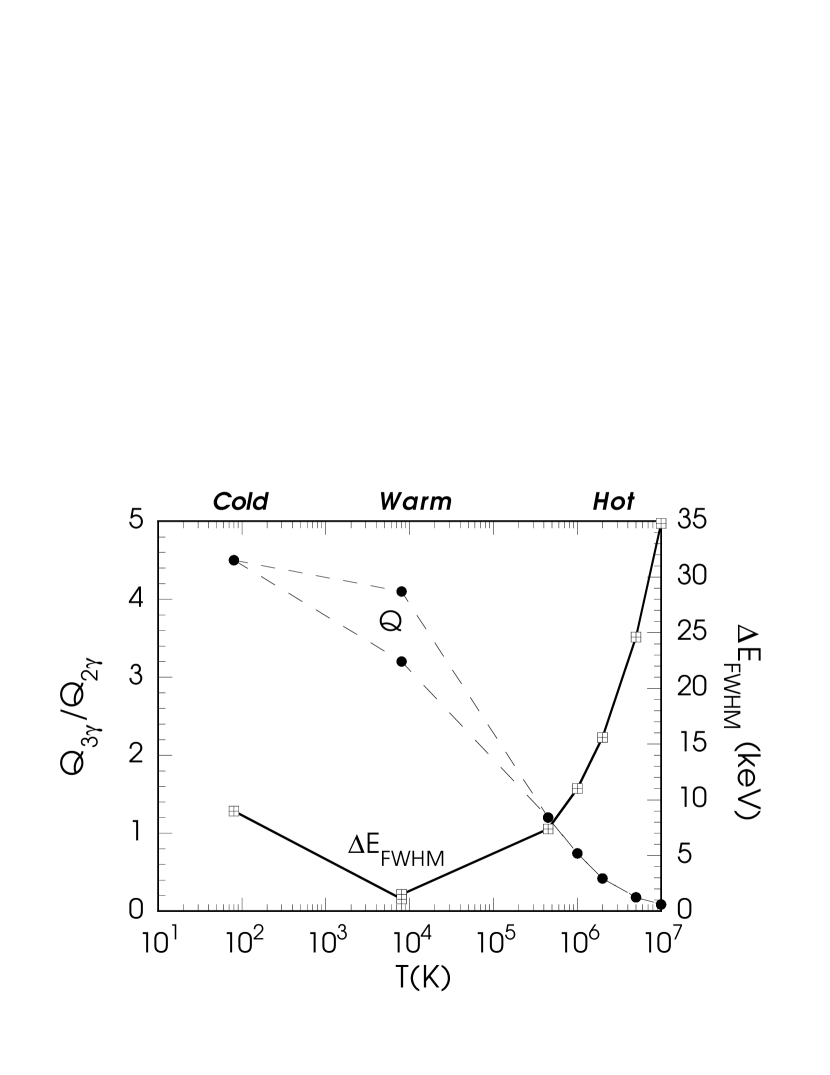
As the temperature increases, the relative number of continuum to 2 line photons decreases. This is because the Ps formation processes involving charge exchange with neutrals become less important at higher temperatures due to the fewer available neutral or partially ionized ions. The line width increases at high temperatures due to thermal broadening, and approaches the limit keV (Crannell et al., 1976; Guessoum et al., 1997), where is the temperature in units of K.
Fig. 4 quantitatively shows how the Ps continuum is quenched in high temperature plasmas. Consequently Ps formation can be quenched in high temperature gas. This property can account for the marginal detection or absence of a high-latitude enhancement in the Ps maps of the Galactic Center region as compared with the observation of a high-latitude enhancement in the 0.511 MeV line maps (Milne et al., 1999). If this interpretation is correct, then a broadened annihilation line would be detected in the direction of the high-latitude enhancement with a line width keV and with an intensity - ph cm-2 s-1. For broad FoV instruments such as TGRS (Harris et al., 1998), this broadened line is difficult to resolve from the narrow, bright annihilation line emitted by the disk and bulge components. The imaging capability of INTEGRAL will be able to determine whether the interpretation of the high latitude enhancement as a fountain of hot gas venting into the halo of the Galaxy is correct by mapping the intensity and line width in this direction, provided that the positive latitude enhancement is sufficiently localized. Further work will be required to determine if Ps can be quenched by dust in the Galactic Center region, which could also lead to suppression of the Ps continuum.
6 Summary and Conclusions
We have summarized our knowledge of astronomical sources of positrons and the processes that lead to the formation of annihilation radiation in the ISM. Because of the large uncertainties in nucleosynthesis calculations, the relative contributions of novae, SNe, and Wolf-Rayet winds remains unclear. Positrons from cosmic rays, compact objects, and GRBs could also make a significant contribution to positron production in the Galaxy. An important tool to reveal the dominant sources of positrons will be to use -ray tracers to establish associated positron injection rates. COMPTEL and INTEGRAL maps of the 26Al 1.809 line and EGRET maps of gamma-ray emission should trace some fraction of the annihilation glow of the Galaxy, with the residual attributed to other processes.
One of the lingering uncertainties in positron astrophysics is the question of whether positrons are formed by accreting compact objects in the Galaxy. SPI on INTEGRAL will be well suited to examine this question, not only by searching for annihilation line transients, but also by looking for annihilation hot spots that are coincident with compact object emission in the Galaxy. SPI’s 511 keV sensitivity for on-axis point sources during a s observation is 2- ph cm-2 s-1 (Vedrenne et al., 1999). Spectral analysis may show that annihilation photons from directions coincident with known compact objects have a different line width or ratio than the surrounding emission, suggesting a point source origin. For sufficiently bright sources, SPI could provide sub-degree imaging that could be compared with IBIS maps of point sources. Searches for variations of the Ps fraction and line width will reveal if there are unusual sites of positron production, and whether the emission from the positive latitude enhancement arises from annihilation in a hot superwind or at compact objects.
Acknowledgments
This work is supported by the Office of Naval Research. We thank P. A. Milne and M. J. Harris for discussions.
References
- Bloemen et al. (1984) Bloemen, J.B.G.M., Blitz, L., Hermsen, W., 1984, ApJ, 279, 136
- Bloemen et al. (1999) Bloemen, H., et al., 1999, ApJ, 521, L137
- Bussard et al. (1979) Bussard, R.W., Ramaty, R., Drachman, R.J., 1979, ApJ, 228, 928
- Burdyuzha & Kauts (1994) Burdyuzha, V.V., Kauts, V.L., 1994, ApJS, 92, 549
- Chan & Lingenfelter (1993) Chan, K.W., Lingenfelter, R.E., 1993, ApJ, 405, 614
- Cheng et al. (1997) Cheng, L.X., et al., 1997, ApJ, 481, L43
- Crannell et al. (1976) Crannell, C.J., Joyce, G., Ramaty, R., Werntz, C., 1976, ApJ, 210, 582
- Dermer & Skibo (1997) Dermer, C.D., Skibo, J.G., 1997, ApJ, 487, L57
- Dermer & Liang (1988) Dermer, C.D., and Liang, E.P., 1988, in Nuclear Spectroscopy of Astrophysical Sources, ed. N. Gehrels and G.H. Share (New York: AIP), 326
- Diehl et al. (1995) Diehl, R., et al., 1995, A&A, 298, 445
- Guessoum et al. (1991) Guessoum, N., Ramaty, R., Lingenfelter, R.E., 1991, ApJ, 378, 170
- Guessoum et al. (1997) Guessoum, N., Skibo, J.G., Ramaty, R., 1997, in the Second INTEGRAL Workshop, ed. C. Winkler, T. Courvoisier, Ph. Durouchoux (ESA SP-382), 113
- Harris et al. (1998) Harris, M.J., Teegarden, B.J., Cline, T.L., Gehrels, N., Palmer, D.M., Ramaty, R., Seifert, H., 1998, ApJ, 501, L55
- for a review, see Harris (1997) Harris, M.J., 1997, in the Fourth Compton Symposium, ed. C.D. Dermer, M.S. Strickman, and J.D. Kurfess (New York: AIP), 418
- Harris et al. (1990) Harris, M.J., Share, G.H., Leising, M.D., Kinzer, R.L., Messina, D.C., 1990, ApJ, 362, 135
- Hernanz et al. (1999) Hernanz, M., José, J., Coc, A., Gómez-Gomar, J., Isern, J., 1999, ApJ, 526, L97
- Hernanz et al. (1999a) Hernanz, M., José, J., Coc, A., Gómez-Gomar, J., Isern, J., 1999, in the Fifth Compton Symposium, ed. M. L. McConnell and J. M. Ryan (New York: AIP), 97
- Johnson & Haymes (1973) Johnson, W.N., Haymes, R.C., 1973, ApJ, 184, 103
- Kinzer et al. (1999) Kinzer, R.L, Purcell, W.R., Kurfess, J.D., 1999, ApJ, 515, 215
- Leventhal et al. (1978) Leventhal, M., MacCallum, C.J., Stang, P.D., 1978, ApJ, 225, L11
- Li & Liang (1996) Li, H., Liang, E.P., 1996, ApJ, 458, 514
- Lingenfelter & Ramaty (1989) Lingenfelter, R.E., Ramaty, R., 1989, ApJ, 343, 686
- Mahoney et al. (1994) Mahoney, W.A., Ling, J.C., Wheaton, W.A., 1994, ApJS, 92, 387
- Meynet et al. (1997) Meynet, G., Arnould, M., Prantzos, N., Paulus, G., 1997, A&A, 320, 460
- Milne et al. (1999) Milne, P.A., Kurfess, J.D., Kinzer, R.L., Leising, M.D., Dixon, D.D., 1999, in the Fifth Compton Symposium, ed. M.L. McConnell and J.M. Ryan (New York: AIP), 21
- Milne et al. (1999a) Milne, P.A., The, L.S., Leising, M.D., ApJS, 124, 504
- Phlips et al. (1996) Phlips, B.F., et al., ApJ, 465, 907
- Prantzos (1996) Prantzos, N. 1996, A&AS, 120, 303
- Purcell et al. (1997) Purcell, W.R., et al., ApJ, 491, 725
- Ramaty et al. (1994) Ramaty, R., Skibo, J.G., Lingenfelter, R.E., 1994, ApJS, 92, 393
- Skibo (1993) Skibo, J.G., 1993, PhD Thesis, Univ. of Maryland
- Share et al. (1990) Share, G.H., Leising, M.D., Messina, D.C., Purcell, W.R., 1990, ApJ, 358, L45
- Share et al. (1988) Share, G.H., et al., 1988, ApJ, 326, 717
- Starrfield et al. (1997) Starrfield, S., Truran, J.W., Wiescher, M.C., Sparks, W.M., 1997, in the Fourth Compton Symposium, ed. C.D. Dermer, M.S. Strickman, and J.D. Kurfess (New York: AIP), 1130
- Vedrenne et al. (1999) Vedrenne, G., et al., 1999, Astron. Lett. and Communications, 39, 325
- Wallyn et al. (1996) Wallyn, P., Mahoney, W.A., Durouchoux, P., Chapuis, C., 1996, ApJ, 465, 473
- Woosley & Weaver (1992) Woosley, S.E., Weaver, T.A. 1992, in Supernovae, ed. J. Audouze et al. (New York: Elsevier)
- Zurek (1985) Zurek, W.H. 1985, ApJ, 289, 603