Off-Axis Cluster Mergers: Effects of a Strongly Peaked Dark Matter Profile
Abstract
We present a parameter study of offset mergers between clusters of galaxies. Using the Eulerian hydrodynamics/-body code COSMOS, we simulate mergers between nonisothermal, hydrostatic clusters with a steep central dark matter density profile and a -model gas profile. We constrain global properties of the model clusters using observed cluster statistical relationships. We consider impact parameters between zero and five times the dark matter scale radius and mass ratios of 1:1 and 1:3. The morphological changes, relative velocities, and temperature jumps we observe agree with previous studies using the King profile for the dark matter. We observe a larger jump in X-ray luminosity () than in previous work, and we argue that this increase is most likely a lower limit due to our spatial resolution. We emphasize that luminosity and temperature jumps due to mergers may have an important bearing on constraints on derived from the observation of hot clusters at high redshift. Shocks are relatively weak in the cluster cores; hence they do not significantly increase the entropy there. Instead, shocks create entropy in the outer regions, and this high-entropy gas is mixed with the core gas during later stages of the merger. Ram pressure initiates mixing by displacing the core gas from its potential center, causing it to become convectively unstable. The resulting convective plumes produce large-scale turbulent motions with eddy sizes up to several 100 kpc. This turbulence is pumped by dark matter-driven oscillations in the gravitational potential. Even after nearly a Hubble time these motions persist as subsonic turbulence in the cluster cores, providing of the support against gravity. The dark matter oscillations are also reflected in the extremely long time following a merger required for the remnant to reach virial equilibrium.
Accepted by ApJ June 22, 2001
1 Introduction
The intracluster medium (ICM) in clusters of galaxies is now understood to evolve significantly over the lifetime of a cluster due to the complex interactions induced by mergers with other clusters. These mergers are an important part of the cluster formation process in present hierarchical models of large-scale structure. Mergers supply a substantial amount of energy to a cluster (two clusters colliding at km s-1 yield an energy erg). Thus they have been suspected of contributing to many different cluster phenomena, including the production of radio halos (Harris et al. 1980; Burns et al. 2000), extreme ultraviolet and nonthermal X-ray emission (Sarazin & Lieu 1998; Blasi & Colafrancesco 1999; Blasi 2000), the bending of narrow-angle-tail and wide-angle-tail radio galaxies (Burns et al. 1994; Gómez et al. 1997; Bliton et al. 1998), and the disruption of cooling flows (McGlynn & Fabian 1984; Stewart et al. 1984).
While some evidence for mergers can be obtained from optical data alone, it is the X-ray-emitting gas which provides the strongest evidence for mergers. The energy gained by the ICM of one cluster as it falls into the potential well of another is easily enough to raise its temperature to the observed values of K. Simulations have shown that the resulting shocks can produce long-lived substructure in X-ray surface brightness maps; however, they have also shown that X-ray temperature and velocity maps are likely to be much better diagnostics, partly because shock brightness contrasts are small when seen in projection (Roettiger, Burns, & Loken 1996; Ricker 1998). The Chandra and XMM satellites are producing ICM temperature maps of much higher spatial and spectral resolution and energy sensitivity than was previously possible (e.g., Markevitch et al. 2000; Vikhlinin, Markevitch, & Murray 2001; Mazzotta et al. 2001). While generally confirming that mergers produce large temperature variations in clusters, these new observations have raised new questions. In addition to showing high-temperature ridges characteristic of shocks, many of these observations show cold cluster cores moving through low density, shock-heated intracluster gas.
The intracluster gas is repeatedly stirred during a cluster’s life by merger shocks (Norman & Bryan 1998) and galaxy wakes (Stevens, Acreman, & Ponman 1999; Sakelliou 2000). The Reynolds number associated with these motions is typically of the order (Sarazin 1988)
| (1) |
where is the Mach number, is the size of the stirring agent, and is the mean free path for ions in the ICM. Merger shocks () typically span lengths comparable to the size of a cluster (), so for them . Galaxy motions () are transonic relative to the ICM, yielding . These influences on the ICM may produce turbulence; if so, it is in a range of Reynolds number which is accessible to present simulations. However, definitive observational detection of turbulence in the ICM will require measurements of the local gas velocity field. X-ray observations are just beginning to enter the regime in which it will be possible to constrain these velocities using X-ray emission lines (Roettiger & Flores 2000).
Turbulence may contribute to a number of the proposed secondary consequences of mergers, including the formation of constant-density gas cores, the destruction of cooling flows, and in situ acceleration of cosmic-ray particles. It can also affect the stripping of gas from galaxies as they orbit in the cluster potential. Unless tangled small-scale magnetic fields limit diffusion (Chandran et al. 1999), this picture is further complicated by the breakdown of the fluid description of the ICM on kpc scales. Nevertheless, we can make some headway with this problem by asking whether merger-induced hydrodynamical effects on scales of tens to hundreds of kpc can feed energy to scales on which collisionless processes become important. It may also be possible to include collisionless transport effects as a correction to fluid calculations on small scales.
Offset cluster mergers are a likely source of vorticity and turbulence in the intracluster medium. The bulk angular momentum that feeds this vorticity originates in tidal torques produced during the linear phase of structure formation (Hoyle 1949; Peebles 1969; White 1984) and should result in mergers with nonzero impact parameters. One example of such an off-center merger is Abell 754 (Zabludoff & Zaritsky 1995; Henriksen & Markevitch 1996; Roettiger, Stone, & Mushotzky 1998; Valinia et al. 1999).
To distinguish the effects of offset mergers from those of the many other simultaneous influences on the ICM, it is necessary to study them in isolation (see Schindler [2000] for a brief review). Offset mergers have been studied by only a few groups. Roettiger et al. (1998) and Roettiger & Flores (2000) treat them primarily in the context of attempts to model specific observed clusters. Ricker (1998) performed a parameter study of offset mergers between equal-mass clusters but neglected the effects of the collisionless dark matter component thought to dominate the mass of most clusters. Takizawa (2000) considers electron-ion nonequipartition effects in a parameter study of offset mergers, but these smoothed-particle hydrodynamics calculations use too few particles to adequately characterize merger shocks and energy transfer between the gas and dark matter. Also, published studies of controlled mergers have used dark matter density profiles with constant-density cores, despite the fact that simulations of hierarchical structure formation produce halos with cuspy central density profiles (e.g., Navarro, Frenk, & White 1997 [NFW]; Moore et al. 1998; Jing & Suto 2000). Finally, none of these systematic studies of controlled mergers emphasizes the distribution of entropy or the development of turbulence.
In this paper we describe a parameter study of offset mergers that addresses these issues. We ask the following questions. Can constant-density gas cores survive in collisions between clusters with steep central total density profiles? How long can the pressure peaks associated with these cores survive in off-center collisions? How do typical offsets affect the luminosity and temperature jumps expected during mergers? How is entropy generated and redistributed in mergers? How much do merger-driven motions mix the cluster cores and contribute to nonthermal support of the gas?
In § 2 we describe the simulation code and isolated merger model we use in our calculations. Our single-cluster convergence study and the merger simulations themselves are described in § 3. In § 4, we discuss the structure of the merger remnants, the evolution of luminosity and temperature, and the survival of distinct pressure peaks in the simulations. Finally, § 5 presents our conclusions. We will discuss at greater length merger-induced turbulence and methods for detecting off-center collisions in a future paper.
When cosmological scaling is required, in this paper we have assumed a Hubble constant km s-1 Mpc-1 with . Unless otherwise specified, quantities are expressed using length units of , mass units of , time units of Gyr, and temperature units of keV.
2 Numerical Method
2.1 Simulation Code
For our merger simulations we have used the COSMOS -body/hydrodynamics code (Ricker, Dodelson, & Lamb 2000). COSMOS solves the Euler equations for the intracluster medium using the piecewise-parabolic method (PPM; Colella & Woodward 1984). The code follows the evolution of collisionless dark matter by means of the particle-mesh method (Hockney & Eastwood 1988), solving the Poisson equation for the total gravitational potential using a full multigrid algorithm (Brant 1977). It also incorporates radiative cooling of the gas, although the simulations described in this paper do not make use of this feature. All three of the primary code components (hydrodynamics, gravity, and dark matter) make use of static, nonuniform grids, allowing us to use smaller zones in regions of interest than would be possible with a uniform-grid code. Our code is fully compressible and uses a three-dimensional Cartesian grid, so shocks and convective effects are intrinsically included. COSMOS has been tested thoroughly against a suite of standard test problems, and we have already used its hydrodynamical and gravitational modules to study cluster mergers without dark matter (Ricker 1998).
The combination of PPM and particle-mesh is widely used in cluster dynamics and large-scale structure simulation. PPM is to be contrasted with another widely-used hydrodynamical method, smoothed particle hydrodynamics (SPH; Gingold & Monaghan 1977; Lucy 1977), a Lagrangian method which uses particles as moving interpolation centers for the hydrodynamical variables. We use PPM because it resolves shocks extremely well. SPH handles shocks poorly but compensates in part by achieving better overall spatial resolution in high-density regions. Both algorithms have been shown to give consistent results when run with the same cluster-formation initial conditions (Frenk et al. 1999).
2.2 Boundary Conditions
Clusters formed in cosmological large-scale structure calculations do not evolve in isolation. Generally they are subject to tidal torques in the linear phase of structure growth, and during the nonlinear phase they accrete a significant number of smaller objects, from galaxies to other clusters. However, we are interested here in separating out the effects of merger-generated shocks. Because we are studying controlled mergers in isolation, it makes sense to use outflow boundary conditions for the gas and dark matter and isolated boundaries for the gravitational field. As noted in § 2.3.3, this requires us to cut off the initial density profiles at a finite radius, allowing particles and gas to escape through this outer boundary as the simulation progresses. Our single-cluster convergence study (§ 3.1) shows that this leads to a steepening of density profiles at large radius which is unrelated to the merger-induced changes in the clusters. For this reason we confine our conclusions to the region within the initial cutoff radius, focusing particularly on the behavior of the clusters within the innermost few core radii of their centers.
Here we briefly describe our implementation of isolated boundary conditions; further details appear in Ricker et al. (2000). For hydrodynamics we use standard zero-gradient boundary conditions wherever the mass flux through the external boundary is positive. For edge zones with inward-directed velocities, we use zero-gradient boundary conditions for all variables except the component of velocity normal to the boundary; for this component we use a Dirichlet boundary condition. This procedure prevents the destabilizing artificial inward flows which can result when matter near the boundary begins to fall back toward the center. In the case of dark matter particles we discard those particles which leave the grid. To handle isolated boundaries with our Poisson solver we have developed a method which first obtains a zero-boundary solution, uses this to obtain boundary values for the required correction to this solution, then solves for the correction using the given boundary values.
2.3 Initial Cluster Model
2.3.1 Density Profiles
In this paper we approach the merger problem by simulating isolated collisions between idealized model clusters. Our model clusters are initially spherically symmetric, with specified density profiles for the gas and dark matter. For the questions we address, this approach has two main advantages over studying clusters formed in large-scale structure simulations. We eliminate the complication of multiple mergers and focus on the effects of a single collision, allowing us to isolate important physical mechanisms. We also achieve high spatial resolution, which is critical for obtaining suitably converged results that track the length scales of interest in cluster cores. However, this approach does not consider the effects of multiple simultaneous mergers, external tidal fields, and infalling matter. Additionally, we neglect radiative cooling and choose our cluster parameters to ensure that the cooling timescale is larger than a Hubble time. We do this to avoid the computational difficulties that arise when the gas is allowed to cool very quickly (the so-called ‘cooling catastrophe’). The effects of mergers on cooling flows present some very interesting and challenging problems, which we will take up in a future paper.
In the current picture, the formation of a cluster of galaxies is a process of steady gravitational accretion and relaxation toward equilibrium, periodically interrupted by mergers with other partially virialized systems. These periodic interruptions destroy any pre-existing equilibrium. After such a merger, the cluster resumes relaxing toward a new equilibrium state, continuing until it is again interrupted. Previous calculations have shown that this relaxation time is long compared to the likely merger interval (Roettiger et al. 1993; Schindler & Müller 1993; Pearce, Thomas, & Couchman 1994; Ricker 1998), meaning that mergers usually involve clusters which are not fully virialized. However, studying the case of large is a necessary preliminary to study of the case in which a merger perturbs a partially virialized initial state. In this paper we are interested in understanding the physical mechanisms important in individual mergers rather than simulating a specific observed cluster.
Accordingly, we begin with an initial model that represents our best current knowledge of the structure of fully virialized, noninteracting clusters. We assume functional forms for the gas density and total density profiles, then set the dark matter profile, the gas temperature profile, and the dark matter velocity dispersion profile in such a way as to establish hydrostatic equilibrium. The gas density profile is taken from the -model (Cavaliere & Fusco-Femiano 1976),
| (2) |
where the central density , core radius , and asymptotic slope parameter are fitting parameters. When used with the assumption of isothermality, the -model with produces an X-ray surface brightness profile which is consistent with those observed in many clusters without cooling flows (Jones & Forman 1984). In this paper we take as a representative value. The -model is similar in shape to the nonsingular isothermal sphere profile (Binney & Tremaine 1987), which is a solution of the gas hydrostatic equation under the assumption of isothermality.
We take guidance for the form of the dark matter density profile from models of hierarchical large-scale structure formation. Using -body simulations, NFW have shown that, in such models, dark matter halos on scales from individual galaxies to rich clusters form with density profiles given by
| (3) |
where and are, respectively, a scaling density and radius, both of which depend upon the mass of the halo in question. The mass dependency in these simulations arises because of the differing redshift of formation of halos with differing masses, with the sense of the dependency being that less massive halos, which form earlier, have higher central densities and are thus more concentrated. The exact shape of this universal density profile has been called into question by Moore et al. (1998), who favor a steeper profile near the centers of halos, arguing that previous simulations have insufficiently resolved the halos. Nevertheless, the clear prediction of these models is that self-similar, purely gravitational evolution leads to a steeper density profile than that predicted by the -model. The addition of collisional, self-gravitating gas most likely modifies this profile somewhat, though if dark matter dominates as we expect it to, the total density profile should still be steeper than that of the gas near the center. Therefore, we choose a total density profile using the NFW functional form. The dark matter density profile is given by the difference between the total profile and the gas profile:
| (4) |
This can only be an approximation to the true situation, because the NFW profile has been established by -body simulations which do not include gasdynamics. If the NFW profile were to be maintained for the total density upon including gasdynamics, the shape of the dark matter profile would need to be different enough to exactly compensate for the -model shape of the gas. However, because the dark matter dominates the total density, particularly in the center of the cluster where the NFW profile continues to rise while the -model tends to a constant value, this is most likely an acceptable approximation in the inner regions of non-cooling-flow clusters.
2.3.2 Temperature and Velocity Dispersion Profiles
We choose the gas temperature and dark matter velocity dispersion profiles from the equations of hydrostatic equilibrium for the two matter components. A more complete discussion will be given in a subsequent paper (Ricker & Sarazin 2001, in preparation). With the total density profile given by equation (3), the total mass enclosed within radius is given by
| (5) |
where . The hydrostatic equation for the gas temperature profile is
| (6) |
where is the average mass per particle in the gas. It is useful to define a characteristic temperature scale as
| (7) |
Then the dimensionless temperature function is defined by
| (8) |
If we define as the ratio of the total mass scale length to the gas core radius,
| (9) |
then the gas density can be written as
| (10) |
where we have used our assumption that . Using equations (5) through (10), the dimensionless form of the hydrostatic equation becomes
| (11) |
In the case of which we are considering here, the solution to this equation (with the boundary conditions discussed below) can be written in closed form in terms of Clausen’s integral. However, for the purpose of initializing our simulations it is more straightforward to solve this equation numerically.
The outer boundary condition for equation (11) depends on the pressure at large radii in the cluster. One class of solutions would have the pressure approach a constant value at large radii to maintain pressure equilibrium with surrounding intercluster gas. Another might have the pressure go to zero at a finite radius, which would represent the outermost extent of the hot gas in the cluster. This condition might approximate a cluster with a strong accretion shock at its outer radius, with the gas pressure being very small outside of this radius. However, the overdensity in clusters is large ( in the core), so the outer pressure is likely to be very much smaller than the central pressure. Thus, we adopt the boundary conditions that apply to an isolated cluster that extends to large radii, so that the pressure approaches zero at large radii. Assuming the adopted form for the gas density profile (eq. [2]), this implies that as . With this boundary condition, the temperature profile requires no additional scaling parameters beyond those supplied by the assumed density profiles, and it is independent of the normalization of the gas profile ().
We constrain the allowable values of by noting that convective stability requires
| (12) |
while in order for the central cooling time to be larger than a Hubble time (to avoid producing a cooling flow), we must have
| (13) |
(Ricker & Sarazin 2001). By experimenting with typical values of , , and , we have found to be a safe value given the resolutions we obtain in the simulations described in § 3. This is comparable to the sizes of the numerical core radii seen in some large-scale structure calculations (e.g., NFW).
The resulting gas temperature profile (scaled to the central temperature) is shown as the dotted line in Figure 2e (below). For the temperature drops slowly (roughly as ), then flattens out and eventually tends toward an asymptotic behavior. By the radius , the temperature has dropped to 25% of its central value.
We follow a similar procedure to determine the dark matter velocity dispersion profile. We assume the dark matter velocity components to be isotropic and Gaussian distributed with velocity dispersion . The virial equation for the dark matter particles is then
| (14) |
For the dark matter the density profile we use contains , , , and ; hence no simple, natural scaling for is available (as in eq. [7] below). Therefore we choose the velocity dispersion at the cutoff radius , , and constrain its value using the assumption of virial equilibrium (eq. [26]). As with the gas hydrostatic equation, we numerically integrate the resulting dimensionless virial equation. The result (for , which we motivate in the next section) appears as a dotted line in Figure 2b. The velocity dispersion rises from its central value to about twice this value at , then drops slowly back to its central value at . The difference in behavior at small radii in comparison to the gas temperature is due to the differing behaviors of the dark matter and gas densities near the center. The dark matter requires a ‘colder’ center to maintain its cuspy density profile, while the gas requires a hotter center in order to maintain its constant-density core.
2.3.3 Scaling the Cluster Model
By choosing the dark matter and gas density profiles, we introduce as model parameters the density scales and , and the length scales and . Because both density laws (for typical values of ) yield divergent total masses for , we introduce a cutoff in the density profile at , making an additional parameter. We examine the effects of this cutoff in the single-cluster test calculations discussed in § 3.1. The velocity dispersion profile introduces the additional ‘thermal’ parameter , yielding a total of six parameters. (The scaling parameter for the gas temperature profile is determined by and via equation [7].)
While we could examine the evolution of clusters with chosen values of the above parameters, it is more useful to select values for the total mass , X-ray luminosity , emission-weighted temperature , and gas fraction , expressing the density, thermal, and length scales in terms of these quantities. This enables us more readily to compare our results with real clusters. In addition, it permits us to use observed correlations between these global quantities to reduce the dimensionality of the parameter space we must study.
We begin by defining the dimensionless density and dark matter velocity dispersion profiles:
| (15) | |||||
| (16) | |||||
| (17) |
The dimensionless gas temperature profile is defined in equation (8). Here we define
| (18) | |||||
| (19) |
If we take to be the virial radius , becomes the familiar halo concentration parameter. While NFW find in their simulations that has a weak dependence on halo mass, we adopt the simplification of a constant value , consistent with their results for cluster-mass halos. Together with our constraint on (§ 2.3.2), this reduces the number of free parameters to four.
We can now write expressions for our desired quantities , , , and :
| (20) | |||||
| (21) | |||||
| (22) | |||||
| (23) |
Here is the plasma emissivity function; we use the emissivity function of the MEKAL model in XSPEC (Mewe, Kaastra, & Liedahl 1995) with half-solar abundances. With the chosen values of (§ 2.3.2) and , only three of these equations are independent; one of the four quantities on the left-hand side, say , depends on the others. Therefore, given , , , and our constraints on and , we can numerically solve the three independent equations for , , and . We also have as a remaining free parameter.
We can further reduce the number of free parameters by considering ‘typical’ virialized clusters. Because and are observationally the most poorly determined quantities, it makes sense to allow them to vary. We constrain in terms of using the observed luminosity-temperature relation and the virial mass-temperature relation:
| (24) | |||||
| (25) |
The observed exponent of the relation lies in the range 2.5 to 3.0 (Markevitch 1998; Arnaud & Evrard 1999; Allen & Fabian 1999) when corrected for effects due to cooling flows. We have used the bolometric relation determined by Markevitch (1998) from a sample of 35 nearby clusters. In our notation Markevitch’s relation corresponds to erg s-1 keV-2.64 and . Mushotzky and Scharf (1997) show the cluster relation to be nearly independent of redshift up to ; hence this is likely to be a good approximation even for clusters at moderate redshifts.
The virial mass-temperature relation we use is taken from Evrard, Metzler, & Navarro (1996), who find in an ensemble of 58 simulated clusters that equation (25) with keV-3/2 and predicts cluster masses to within a standard deviation of 15%, even for fairly irregular clusters.
Finally, we constrain , the scaling factor for the dark matter velocity dispersion, using the assumption of virial equilibrium within . We also assume that dark matter particle orbits at are nearly isotropic. This yields the constraint
| (26) |
In setting up the initial particle distribution for each cluster, we choose the -, -, and -components of the velocity for each particle from a Gaussian distribution with dispersion .
2.4 Choice of Parameters
2.4.1 Model Clusters
With the assumptions discussed above, the properties of each cluster are completely determined by the assumed mass and gas fraction . We chose gas fractions which fell within the range of values permitted by X-ray cluster observations (David, Jones, & Forman 1995; White & Fabian 1995) and which yielded central cooling times larger than a Hubble time, .
Table 1 presents the parameter values for the two cluster models studied in the collision runs. Any other cluster properties can be derived from these values using the scaling relations discussed above. The temperatures of the two clusters were chosen to fall in the range of ‘typical’ rich clusters seen at low redshift (e.g., Edge et al. 1990; Edge, Stewart, & Fabian 1992). We then chose masses using the virial mass-temperature relation as described in section 2.3.3. The values of the scaling radius and central density (given in Table 1 in terms of the central electron number density, ) were constrained as described in § 2.3.3. Table 1 also shows the calculated values of the sound-crossing time and the 2–10 keV X-ray luminosity . The two clusters, which we label ‘A’ and ‘B’, have a mass ratio of approximately 2.8. Among real nearby clusters, our simulated clusters A and B are most nearly similar to Virgo and AWM7, respectively, although both of these real clusters have weak cooling flows.
| (2–10 keV) | ||||||||
|---|---|---|---|---|---|---|---|---|
| Cluster | () | (keV) | ( kpc) | ( cm-3) | (Gyr) | (Gyr) | ( erg s-1) | |
| A | 0.199 | 2.0 | 0.125 | 118 | 3.95 | 1.89 | 17.7 | 0.117 |
| B | 0.562 | 4.0 | 0.174 | 169 | 5.31 | 1.93 | 19.7 | 1.25 |
2.4.2 Initial Merger Kinematics
Our collision model, depicted in Figure 1, is appropriate for two clusters that have fallen together from a large distance with nonzero angular momentum. This model introduces three new parameters: the initial separation , the initial relative velocity , and the impact parameter . Because clusters of given masses do not all merge at the same time or with the same total angular momentum, we have some freedom in choosing the values of these parameters. However, only certain ranges of values are physically well-motivated. Here we discuss the scaling of our choices with the properties of our model clusters.
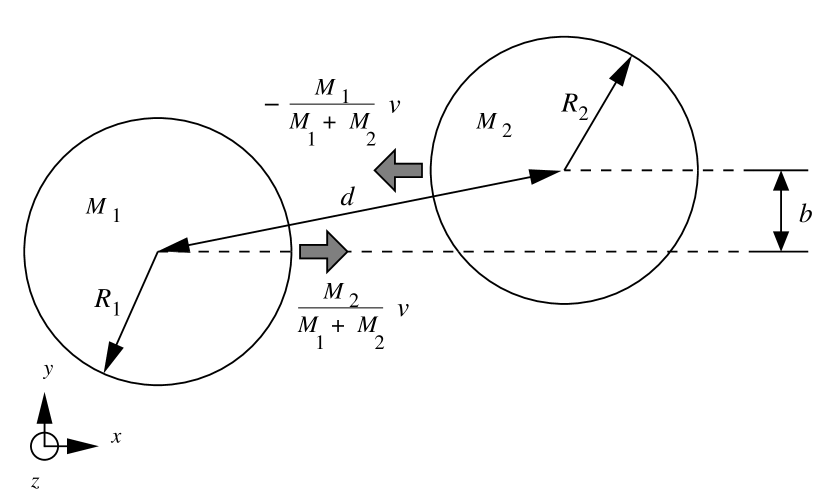
For computational reasons, it makes sense to fix the separation at the start of the calculation, balancing the need to save computational time in following the relatively uninteresting pre-merger cluster evolution with the need to start the clusters from a virialized state. In each case we set
| (27) |
where and are the cutoff radii of the two clusters. We assume the clusters to have fallen to this separation from a greater separation , at which their relative radial velocity is zero. The value of corresponds to the turn-around distance for the clusters (Sarazin 2001), assuming that the cluster merger (the first core crossing) occurs when the age of the Universe is 11 Gyr (the present age for and ). The exact value of does not affect the total energetics much as long as the relative velocity of the clusters at closest approach is close to the value expected for free-fall from infinity.
For the purpose of computing the initial relative velocity, we approximate the two clusters as point masses. Comparing the angular momentum and energy predicted with this approximation to the actual value determined from the simulations shows that this estimate is good to within 1% because of the highly concentrated nature of the cluster density profiles. We also neglect the clusters’ spin angular momenta. At the separation , the clusters are assumed to have zero relative radial velocity; hence their angular momentum and energy are
| (28) | |||||
where their reduced mass is
| (29) |
and is their relative azimuthal velocity. At the separation , the relative velocity is perpendicular to the direction of , so we can write
| (30) | |||||
Conserving angular momentum and energy, we eliminate and find
| (31) |
We estimate the range of impact parameters to study by using the linear-theory result for the dimensionless spin of dark-matter halos. The spin parameter is defined as (Peebles 1969)
| (32) |
Here is the angular momentum of the halo, is its total energy, and is its mass. Recently, Sugerman, Summers, and Kamionkowski (2000) have performed a detailed comparison of linear-theory predictions to actual angular momenta of galaxies formed in cosmological -body/hydro calculations. These simulations did not include cooling or star formation, so at the upper end of the mass range they studied their results should carry over to the clusters we are simulating. They find, in agreement with White (1984), that linear theory overpredicts the final angular momentum of galaxies by roughly a factor of three, with a large () dispersion in the ratio of the linear-theory prediction to the actual value. The importance of nonlinear effects on the spin parameter is less clear, as uncertainties in their group-finding algorithm strongly affect the determination of , , and for each galaxy and produce a large scatter in . However, given this uncertainty, the mean value of they obtain is about 0.05, close to the linear-theory result.
We take the halo to be the final merger remnant. Its final total angular momentum is the sum of the spin angular momenta of the two subclusters plus the orbital angular momentum . We estimate the initial spins of the subcluster by applying equation (32) to each of them, and we assume that the initial spins are correlated. The orbital angular momentum is then the difference between the final angular momentum of the merger remnant, and the total spin angular momenta of the subclusters (Sarazin 2001). Substituting equations (28)-(31) into equation (32) and solving for the impact parameter, we find that
| (33) |
Here, the function corrects for the internal angular momenta and energy of the subclusters, and can be written as
| (34) |
but it only depends on the ratio of the smaller to larger mass of the two subclusters. It varies between , so that . In our merger models, ( is the larger of the two scale radii of the clusters), and . If we assume and approximate , we find that the typical impact parameter is . Since this argument is statistical and a range of values are expected in mergers, we consider values of in our simulations.
| Cluster | Mass | |||||||
|---|---|---|---|---|---|---|---|---|
| Identifier | Models | Ratio | a | ( Mpc Gyr-1) | ( Mpc)b | a,c | ||
| C1 | AA | 0 | 0.436 | 7.10 | 4.73 | 4.73 | 0.144 | |
| C2 | AA | 2 | 0.436 | 7.10 | 4.97 | 4.73 | 0.144 | |
| C3 | AA | 5 | 0.436 | 7.10 | 5.32 | 4.73 | 0.144 | |
| C4 | AB | 0 | 0.548 | 8.63 | 6.78 | 6.78 | 0.213 | |
| C5 | AB | 2 | 0.548 | 8.63 | 7.12 | 6.78 | 0.213 | |
| C6 | AB | 5 | 0.548 | 8.63 | 7.63 | 6.78 | 0.213 | |
Table 2 presents the parameter values used in the collision runs. The simulations are labeled ‘C1’ to ‘C6’; runs C1–C3 are equal-mass collisions using cluster A, while runs C4–C6 use clusters A and B. Each run is followed for approximately 15 Gyr, more than the age of the Universe for and . For the hydrodynamics and gravitational potential calculations, we use a nonuniform mesh with zones covering a volume measuring approximately , where is the larger of and . The minimum zone spacing is approximately equal to one-seventh of the larger of the two dark matter scale radii, or kpc for runs C1–C3 and kpc for runs C4–C6. For the dark matter, each run also uses particles of equal mass, distributed between the merging clusters in proportion to their total dark mass. The results of these runs are described in §§ 3.2 and 3.3. In § 3.1 we first discuss the results of a convergence study involving a single cluster, which we used to set the grid and particle parameters used in the collision runs.
3 Numerical Simulations
3.1 Single-Cluster Convergence Study
We carried out several calculations of the motion of a single cluster with different spatial resolutions and numbers of particle in order to evaluate numerical effects due to our boundary conditions and finite-radius cutoff. These runs also enabled us to choose grid and particle parameters for the collision calculations. These runs used the cluster parameters appropriate to cluster A (see § 2.4) together with the numerical parameters listed in Table 3. Six runs were performed with two different grid spacings and three different numbers of particles. One additional run was performed at a grid spacing and particle number slightly better than the collision runs to be described later. The computational volume measured , and the cluster started at the position (2.36,2.36,2.36) with an initial velocity of 0.436 in the -direction. In each run the cluster was permitted to move for 5 Gyr, yielding an expected final displacement of 2.18.
| Identifier | Mesh Size | No. of Particles | a |
|---|---|---|---|
| S1 | 65536 | 0.80 | |
| S2 | 524288 | 0.80 | |
| S3 | 1048576 | 0.80 | |
| S4 | 65536 | 0.25 | |
| S5 | 524288 | 0.25 | |
| S6 | 1048576 | 0.25 | |
| S7 | 1048576 | 0.12 |
Figure 2 compares final average profiles of various quantities in the single-cluster tests to the initial profiles. Included are the dark matter density and velocity dispersion, gas density, enclosed gas fraction, gas temperature and specific entropy, and the gas radial Mach number. We also plot the ratio of the gas pressure gradient to the gravitational force per unit volume on the gas, which shows the extent to which the gas is in hydrostatic equilibrium. The results show the effects of finite zone spacing and particle number on small scales and outflow boundary conditions on large scales. For gridded (gas) quantities, each profile was generated by averaging profiles interpolated along 1000 different directions from the gas centroid. The radial sample spacing was taken to be equal to the size of the smallest zones in the calculation. For particle (dark matter) quantities, particles were binned in radial bins about the dark matter centroid; then the particle count or the average value of the velocity dispersion in each bin was used. The bin spacing used was the same as the sample spacing used for the gas profiles. With the exception of the gas fraction, the pressure-potential ratio, and the radial Mach number, all quantities are scaled in terms of the initial values of the appropriate scaling parameters, such as the core radius or central gas density.
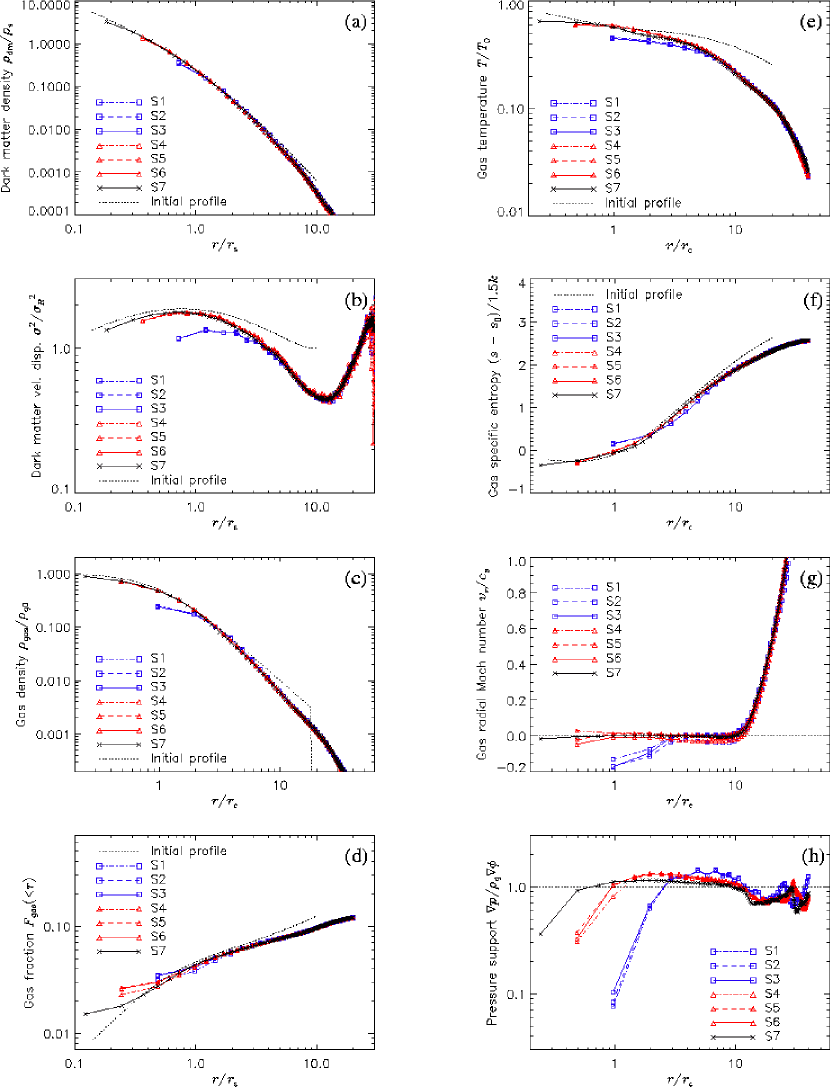
The dark matter density profile (Figure 2a) shows little sensitivity to the number of particles or zone spacing for the ranges of these parameters considered here. Resolution effects appear in the innermost part of the cluster; the density in the innermost radial bin tends to be some 15% below the initial value. This demonstrates the tendency of particle-mesh force smoothing to produce an artificial constant-density core on scales smaller than twice the mesh spacing. Thus in order to observe the turnover to behavior at small scales characteristic of the NFW profile, the mesh spacing should be no larger than about 1/4 the scale radius . For , the escape of particles through the outer boundary of the cluster makes the resulting final profile slightly steeper than its initial shape. Runs S1-S3 display a somewhat shallower profile between and than that in runs S4-S7.
The dark matter velocity dispersion profile (Figure 2b) also reflects this evaporative cooling: within in run S7, is about 9% lower than its initial value, with roughly the same dependence. Outside the final profile drops off more steeply, whereas outside it appears to rise again due to the radial motion of escaping particles. (We estimate by computing for each velocity component , averaging within radial shells, then sum the results for , , and and divide by 3. This procedure assumes isotropic particle velocity dispersions and does not subtract out radial expansion or contraction.) The central dispersion in runs S1-S3 is substantially lower than in run S7, but runs S4-S6 agree with S7.
The lack of an external confining pressure produces expansion of the gas at the outer boundary of the cluster. This has a major effect on the gas density profile (Figure 2c), causing it to become steeper at large radii. The profile also becomes slightly shallower at small radii. However, unlike the dark matter profile, once the gas core radius is resolved (runs S4-S7), the gas profile converges to a central density slightly below the initial value. Between and it agrees with the initial profile, but the effective core radius (defined as that radius at which the density drops to one-half its central value) at the end of the simulation is smaller than the initial value, so the overall shape at small radii differs slightly from a -model. When the core is not resolved (runs S1-S3), the behavior is more like the dark matter density, with the innermost density point well below its initial value. Again, the number of particles makes little difference for the range of values considered here.
The different behaviors of the gas and dark matter are apparent from the enclosed gas fraction profile (Figure 2d). The enclosed gas fraction is computed from the average gas and dark matter densities via the relation
| (35) |
In all cases the gas fraction at a given radius is smaller than its initial value for radii larger than about two zones. Within two zones of the center the gas fraction flattens out to a constant value rather than dropping to zero because of the artificial core in the dark matter profile. The final gas fraction rises more slowly than its initial profile, reaching the initial total value of 12.5% only at .
The spreading of the gas due to the lack of external pressure confinement leads to a steepening of the temperature profile (Figure 2e) and the advection of entropy out of the outer parts of the cluster (Figure 2f). Whereas the initial temperature profile drops to times its central value at , by the end of the single-cluster calculation it has dropped to about 0.2 times its central value. In runs S1-S3 the gas core is not resolved, and the innermost temperature point is about two-thirds its initial value at that radius. For runs S4-S7 the final temperature agrees much better with its initial profile, although run S7 does not reproduce the upturn within present in the initial conditions. The two sets of core-resolved runs also disagree slightly between and , with runs S4-S6 agreeing better with the initial profile. All of the simulated profiles agree with each other beyond about five core radii. Similar results can be seen in the specific entropy profile. Note that the specific entropy is measured relative to the central value given the imposed density and temperature profiles. The resulting imposed entropy profile passes through a minimum near , so at smaller radii the gas would be convectively unstable if our calculations were to use smaller zones.
The radial Mach number (Figure 2g) and pressure support profiles (Figure 2h) show that the innermost parts of the cluster approximate hydrostatic equilibrium much better as grid resolution improves. Both quantities are formed from angle-averaged values; thus the radial Mach number is computed using the average radial velocity and the average temperature. When the core is not resolved, the innermost radial velocity point is as much as 0.2 times the sound speed, and the pressure provides about 10% of the gravitational force there. In runs S4-S7 the maximum Mach number inside is less than 5%, and at the innermost point the pressure contributes 30% of the force due to gravity. The pressure support ratio increases immediately to a value slightly larger than unity outside the center, indicating that the outer parts of the cluster are nearly in hydrostatic equilibrium but are still slowly expanding. In all cases the gas outside is in nearly free expansion, with the radial velocity increasing to a sonic point at . The material inside this sonic point is slowly decelerating and will eventually fall back onto the cluster.
In summary, the single-cluster test calculations show that the values of particle number and zone spacing used in the collision runs are adequate to produce a control cluster which remains in nearly hydrostatic equilibrium. The code is especially well-converged with respect to particle number for the value () used in the collision runs, and the quantities of interest have converged down to radii of about two zones for the zone spacing used (). The accuracy of the converged solution is affected by the particle-mesh smoothing length on small scales and by the lack of an external confining pressure on large scales. These effects lead to an artificial core radius of 1–2 zones in the dark matter and a nearly free expansion of the gas and dark matter outside the initial density cutoff which steepens the density and temperature profiles near the cutoff.
3.2 Equal-Mass Mergers
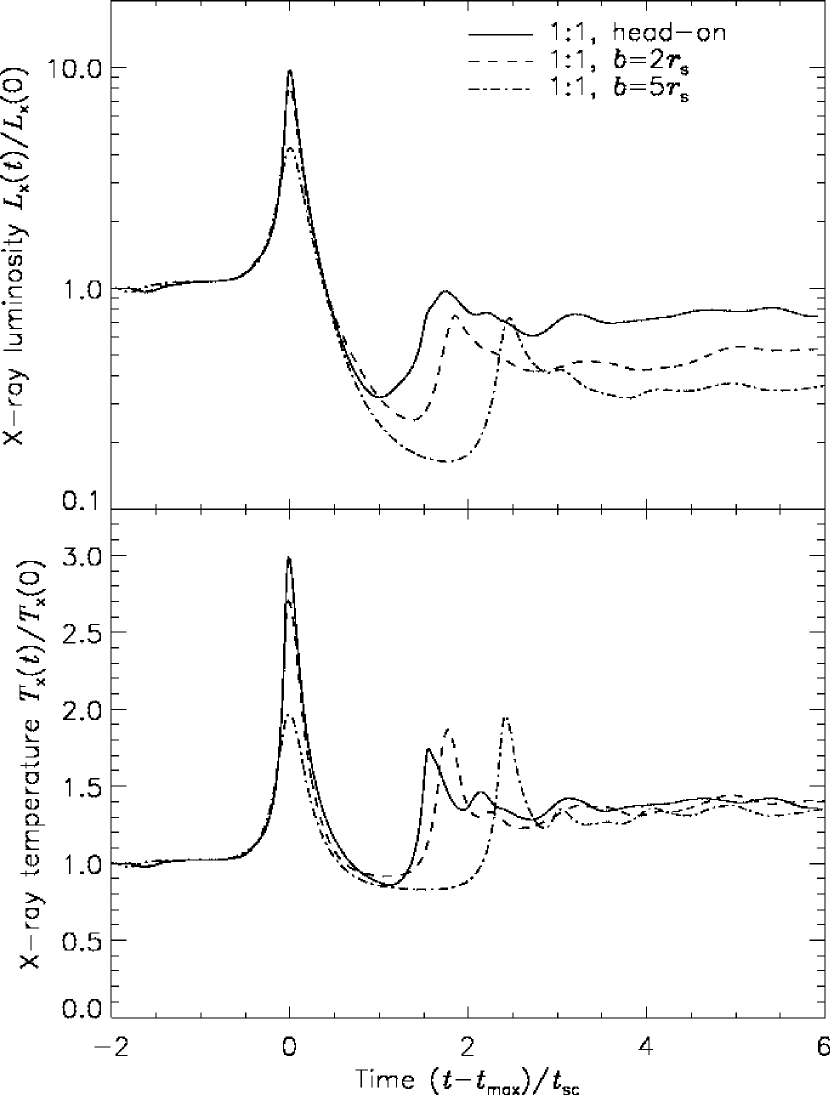
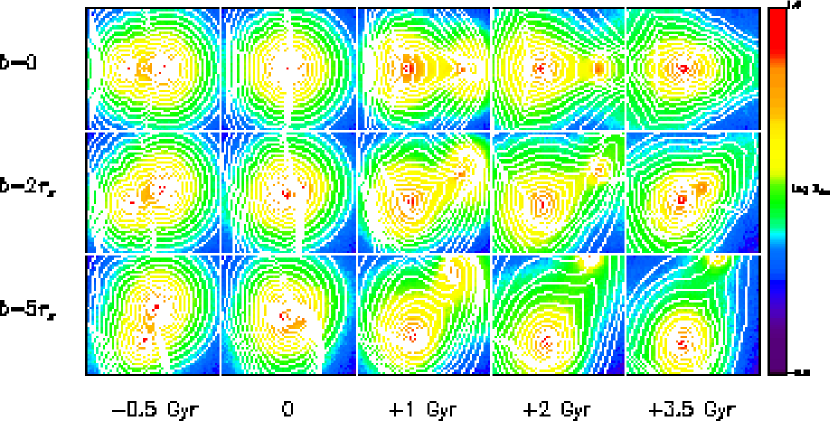
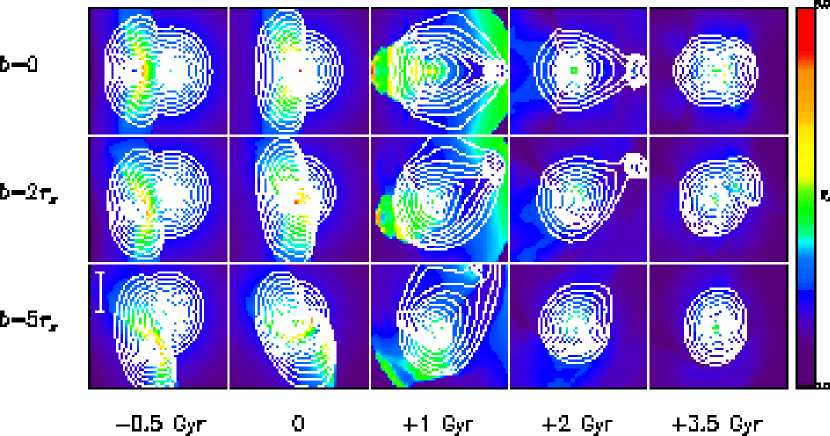
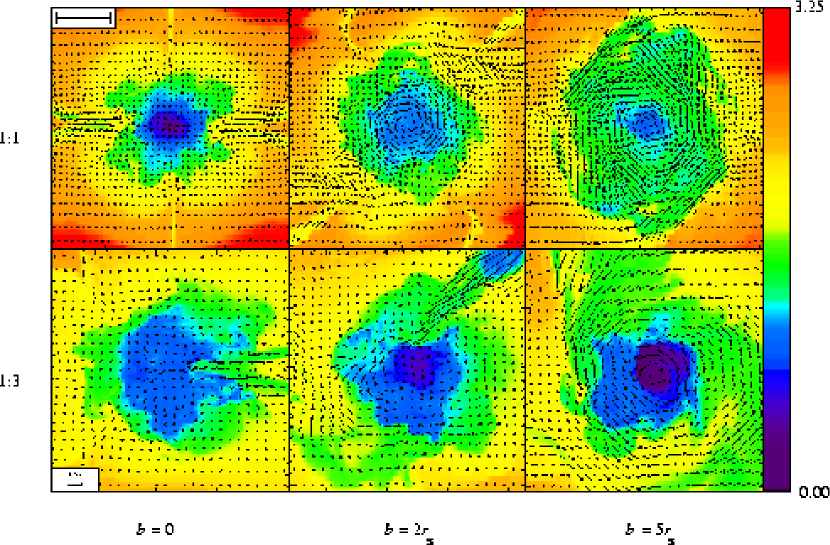
In this section we describe the simulations of mergers between clusters of equal mass (runs C1–C3). Figure 3 shows as functions of time the projection of the gas and dark matter densities along the -axis, which is perpendicular to the plane of the collision in the offset runs. We refer to the projected densities as and , respectively. Figure 4 shows the 2–10 keV X-ray surface brightness and X-ray emission-weighted temperature , also projected along the -axis. Figure 5 shows the total luminosity and average emission-weighted temperature for the entire computational grid as functions of time. The zero of time in each plot has been chosen to be the instant of maximum luminosity (in each case approximately 3.5 Gyr or after the start of the calculation). The abscissa of the luminosity and temperature plots is also scaled to the sound-crossing time .
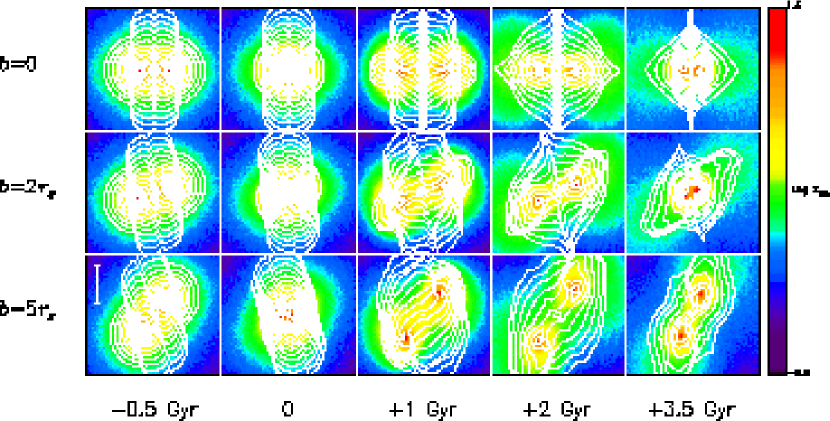
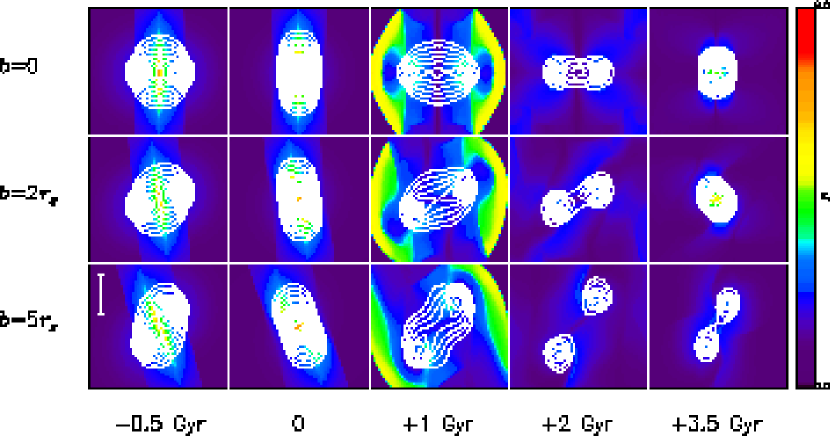
As the outer regions of the two clusters begin to interact early in the merger, a pair of roughly planar shocks forms at an angle to the collision axis, moving in opposite directions. By 0.5 Gyr prior to maximum luminosity, these planar shocks have passed through the cluster cores and are on their way out of the interaction region. They are readily apparent in the projected gas mass plot (Figure 3) and are barely visible in the surface brightness contours (Figure 4). Between the clusters the temperature is higher than the pre-shock value by about a factor of three, and the material in this region is expelled from the collision axis at about 1/2 the initial relative velocity. The material between the clusters is adiabatically compressed after the passage of the shocks. In previous gas-only merger calculations (Ricker 1998), the planar shocks later developed into spiral shocks which acted to dissipate the angular momentum of the cluster cores into large-scale rotational motion. With the addition of collisionless dark matter, however, the planar shocks play less of a role in the later stages of the collision, and we see more small-scale rotation as early as 3–4 Gyr after maximum brightness and continuing for at least 3 Gyr beyond that.
Although we have not attempted to reproduce any specific clusters with these calculations, we note that the simulations do resemble some merging clusters with particularly simple geometries. The temperatures and X-ray surface brightnesses in the early phases of the zero-offset, equal mass mergers strongly resemble the observed ROSAT image and ASCA temperature map of the cluster surrounding Cygnus-A (Markevitch et al. 1999). The offset 1:1 cases, seen just after first core passage, resemble the structure of Abell 3395 (Markevitch et al. 1998), which appears to be observed from above the merger plane.
The merging clusters undergo a dramatic increase in luminosity and temperature as the cluster cores collide. The luminosity jump ranges from a factor of 4 for the most off-center case to a factor of 10 for the head-on case. The average temperature increases by a factor of two to three. In the projected mass and X-ray maps, the period of core collision corresponds to the formation of a strong, crudely ellipsoidal shock which dissipates some of the initial kinetic energy of the cores into thermal energy in the surrounding gas. The greater increase in total luminosity and average temperature for the head-on case results from the fact that the dark matter cores, whose gas content produces the majority of the X-ray emission, pass directly through one another and the adiabatically heated gas between them. In the offset cases this hot gas is driven ahead of the cluster cores as they slip past one another, producing an S-shaped region of high temperature. In all cases, however, the dark matter cores continue to have associated peaks in the gas density even after they pass one another, a significant departure from the behavior in the gas-only collisions considered by Ricker (1998). Here the central potential is dominated by collisionless dark matter, which dissipates energy in a relatively inefficient manner compared to the gas during core passage. Thus the dark matter cores, which are able to pass through one another even in the head-on case, drag gas density peaks along with them. The extra oscillation due to the dark matter allows the dark matter to ‘pump’ the gas, keeping the system disrupted longer than would be expected if both matter components were collisional. Offsets on the order of a few hundred kpc are sometimes observed between the dark matter and gas density maxima, particularly as the cluster cores reach maximum separation after their first interaction.
The first period of enhanced luminosity and temperature lasts for approximately one sound-crossing time. After their close interaction, the cores recede from one another, causing the temperature to drop to about 80% of its initial value. By the time the cores reach their maximum separation, the luminosity decreases much more, reaching about 15% of its initial value in the most offset run and about 30% in the head-on run. As one might expect due to the relative efficiency of gas dissipation in the three cases, the clusters require longer to reach maximum separation in run C3; this occurs about after core passage in this run, compared to only 1/2 sound-crossing time for run C1. In each case, a second core passage occurs between 1.5 and 2.5 sound-crossing times after the first, producing smaller brightness and temperature jumps. Following this second passage, the total luminosity drops to between 30 and 70 percent of its initial value, while the average temperature drops to 1.4 times its initial value. The cores continue to oscillate, producing minor variations in the luminosity and temperature, but the values of these quantities change very little for the remainder of the calculation. During this time several weaker sets of shocks are generated by core passages, as is apparent at 3.5 Gyr after the first core passage in the projected mass and X-ray plots (Figures 3 and 4). We discuss the evolution of luminosity and temperature in more detail in § 4.2.
After the cores have coalesced, angular momentum continues to be redistributed in the gas by turbulent eddies which are fed by material falling back in the wake of the ellipsoidal shock. The remnant requires several billion years to reach equilibrium, and indeed has not quite reached equilibrium by , the end of the calculation (and more than a Hubble time for ). We consider the properties of the merger remnant at in § 4.1.
3.3 Mergers with a 1:3 Mass Ratio
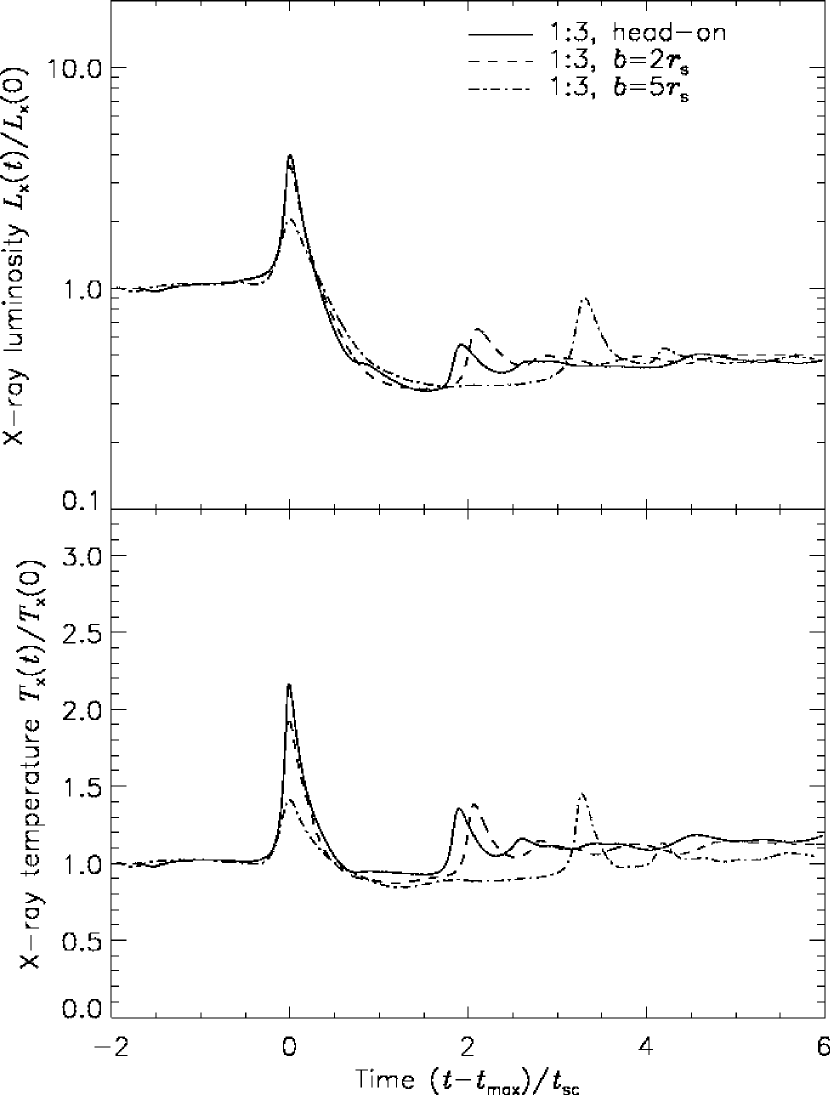
In this section we describe the simulations of mergers between clusters with a mass ratio of approximately 1:3 (runs C4–C6). Figure 6 shows mass maps projected along the -axis ( and ) for these runs at several different times. Figure 7 shows the 2–10 keV X-ray surface brightness and X-ray emission-weighted temperature , also projected along the -axis. Figure 8 shows the total luminosity and average emission-weighted temperature as functions of time. In these figures the more massive cluster initially approaches from the right. As for the 1:1 merger runs, the zero of time in each plot has been chosen to be the instant of maximum luminosity. The abscissa of the luminosity and temperature plots is also scaled to the sound-crossing time of the more massive cluster. Numerically, the values of the time of maximum luminosity and the sound-crossing time are similar to those obtained in the 1:1 collisions ( and 1.9 Gyr, respectively).
In the 1:3 runs the initial pair of shocks is not planar; instead, the shock sweeping through the less massive cluster curves around its core, and the adiabatically compressed region between the clusters takes on an arc shape. For nonzero impact parameters, the shock being driven into the more massive cluster is stronger on the side from which the less massive cluster approaches. However, at 0.5 Gyr prior to maximum luminosity the right-hand shock has not yet penetrated the more massive cluster core, as it has by this point in the equal-mass collisions.
Peak luminosity and temperature occur as the core of the less massive cluster passes through (in the head-on case) or swings past (in the offset cases) that of the more massive cluster. As in the equal-mass runs, in the offset cases here an S-shaped region of hot gas is apparent in the region between the cluster cores. The heating of the gas is more severe in the region in front of the less massive cluster. Also, the less massive cluster undergoes extreme distortions at this time. Gas velocities of up to 2000 km s-1 are present behind it, and as it plows into the hotter, denser ICM of the larger cluster, it is flattened perpendicular to its direction of motion. The core of the larger cluster is less affected by the interaction, as expected. Shortly after first core passage, the offset case C5 resembles Abell 754, consistent with the results of Roettiger et al. (1998). The offset cases also resemble Abell 2256 just at core passage if one uses the ASCA or BeppoSAX temperature maps (Markevitch 1996; Molendi, de Grandi, & Fusco-Femiano 2000) and assumes the merger axis to be perpendicular to the plane of the sky.
Although the smaller cluster undergoes severe distortion during the core passage, the merger’s effect on the total luminosity and average emission-weighted temperature of the system is noticeably less than in the 1:1 collisions. The luminosity increases by a factor of 2–4, and the temperature by a factor of 1.4–2.2, for about 1/2 sound-crossing time during the initial core passage. While maximum separation following core passage is reached at about the same time as in the 1:1 cases, the drop in luminosity and temperature is not as great. This period is again followed by a weaker secondary peak in luminosity and temperature as the cores fall back together. Here the most offset case (run C6) spends more time at maximum separation, causing the spread in secondary peak times to be 50% greater for the 1:3 runs than in the 1:1 cases. The second core passage for this run takes place almost 7 Gyr after the first, and in all cases this second interaction takes place on a nearly radial trajectory due to the dissipation caused by the first interaction. (The last two panels of Figures 6 and 7 for this run do not show the less massive cluster because at these times it is at a separation which places it outside the plotted region.) Both luminosity and temperature settle down to final values of 50% and 110%, respectively, of their initial values following the second core passage. A few oscillations are again seen as the cores settle into a common remnant. Unlike the 1:1 cases, here there is little variation in the final luminosity as impact parameter is varied.
4 Discussion
4.1 Structure of Merger Remnants
Each merger simulation was followed for approximately 15 Gyr, or about six sound-crossing times after the first core passage. Although this time is greater than the age of the Universe for and , it is nevertheless insufficient time for the remnants of either the 1:1 or the 1:3 mergers to come to equilibrium. This point is illustrated by Figure 9, which shows the gas specific entropy and velocity fields in the -plane of each run at Gyr. Although in each case the core of the remnant has lower entropy than its surroundings, the gas at the margins () continues to be disturbed by small-scale convective motions as matter accretes onto the remnant behind the shocks that have been driven out of the core region. The offset mergers all show evidence of bulk rotation, with velocities of km s-1, but in even the most offset cases this provides at most a few percent of the support needed to keep the remnant in hydrostatic equilibrium. The 1:1 cases are closest to equilibrium, having settled into roughly spherical distributions within of the center of mass. The 1:3 cases are relatively further from equilibrium, with distinct streams of material falling in from the right (in the head-on case) and along the top edge (in the offset cases). These streams continue to feed high-entropy gas from the smaller cluster into the remnant as the simulations come to an end.
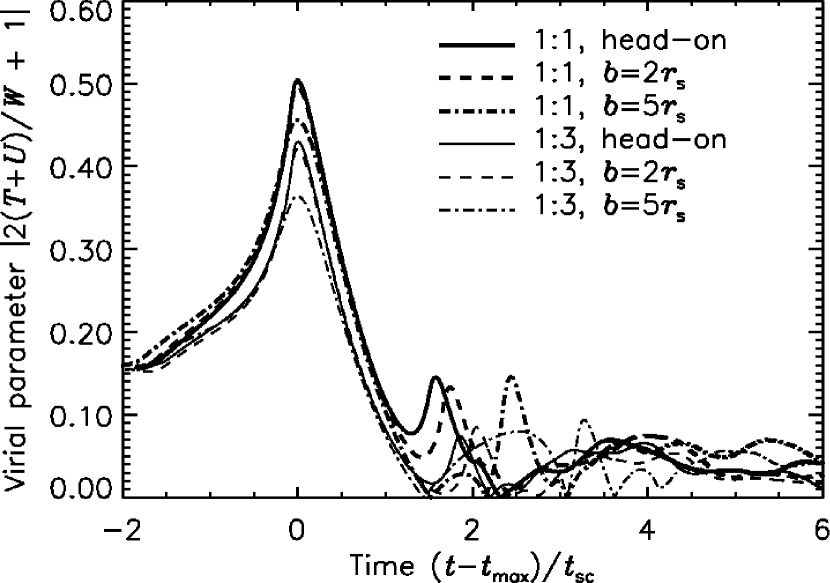
Departures from equilibrium can also be described in terms of total energetics. In describing the results of gas-only merger simulations, Ricker (1998) defined a ‘virial disequilibrium’ parameter as
| (36) |
where , , and are the total kinetic, internal, and potential energies. When the system is in virial equilibrium, , and when it is not, is equal to the second time derivative of the moment of inertia, divided by . Thus a useful equilibrium criterion is to require for an extended period (say ). In the gas-only mergers, the clusters required between 5.5 and 6 sound-crossing times to reach the level , after which was roughly constant. In Figure 10 we plot versus time for the six gas-plus-dark matter mergers considered in this paper. Note that, as in the earlier work, passes through a maximum during the first core passage, when the system is furthest from equilibrium. then declines steeply but oscillates for several sound-crossing times as the dark matter continues to pump the gas. Finally the system begins to tend steadily toward around after first core passage. However, by the end of the simulations only runs C4 and C5 have satisfied the equilibrium criterion just described.
We plot angle-averaged profiles of various quantities from the merger runs at Gyr in Figures 11 and 12. Profiles are generated from the raw simulation data as for the single-cluster test runs described in § 3.1. Although the merger remnant is not in hydrostatic equilibrium, the average profiles still serve to characterize the effect of the collision on the structure of the clusters. As for the single-cluster runs, the profiles here are scaled to the initial values of , , and so forth, with the exception of the enclosed gas fraction, the gas radial Mach number, and the pressure support ratio. For the 1:3 mergers the scaling parameters used are those pertaining to the more massive cluster (B).
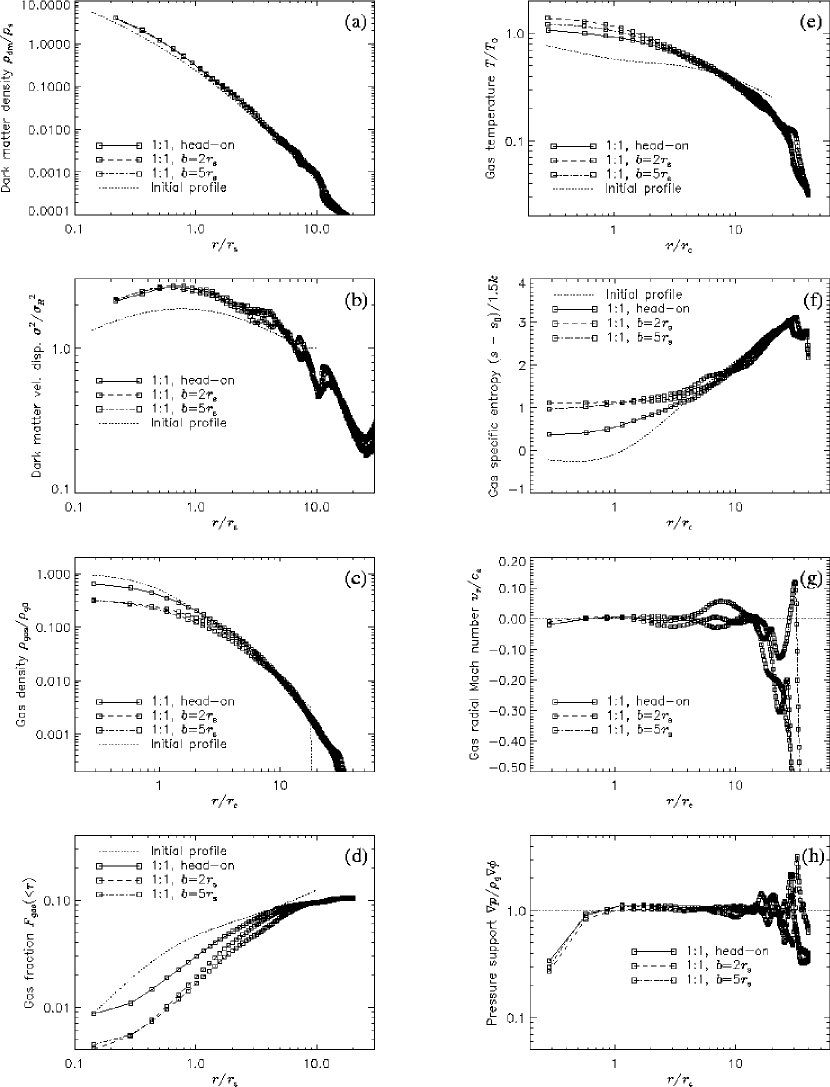
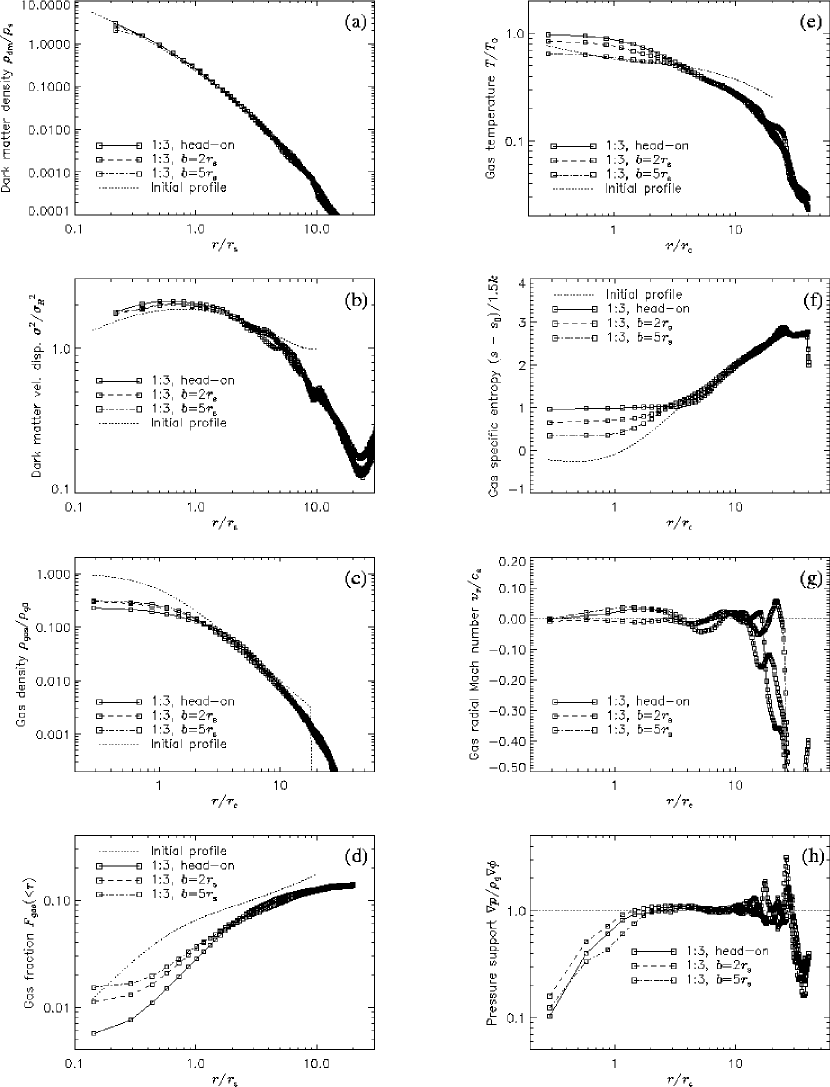
The dark matter density profile (Figures 11a and 12a) shows very little change in shape as a result of the collisions. Of all of the properties of the merger remnant, its shape is also the least affected by variations in mass ratio and impact parameter. The normalization ( since dark matter dominates the potential) increases in each case because the merger remnant is more massive than the individual colliding clusters, but the scale radius changes very little. The asymptotic slope of the profile does not increase as in the single-cluster test runs.
Figures 11b and 12b give the profile of the dark matter velocity dispersion at the end of the simulations. At the end of the 1:1 collisions, the central velocity dispersions are all increased as a result of the deeper potential well of the merger remnant. A similar but smaller effect is seen in the 1:3 mergers. At large radii, the velocity dispersions are all small as a result of the evaporation of faster moving particles and the outflow-only outer boundary conditions in the simulations. A similar effect was seen in the single cluster simulations (Figure 2b).
Although the dark matter density profiles are not strongly affected by the mergers, the gas density profiles (Figures 11c and 12c) change substantially as a result of the mergers. The central gas density in each case actually shows a substantial decrease from its initial value, dropping to 30–70% of its initial value for the 1:1 runs and to 20–30% of its initial value for the 1:3 runs. Using the half-density radius as an estimate for the core radius, we find that increases by 20–25%. The final value of shows a significant dependence on impact parameter. For the equal-mass collisions, the final gas density is about twice as high for head-on mergers as for the most offset mergers. For the 1:3 collisions, the variation is only 50%, but the sense is reversed, with head-on collisions resulting in a lower central gas density. In all cases we see a steepening of the asymptotic slope from to , as in the single-cluster runs, because of the initial cutoff at combined with the outflow boundary conditions.
The flattening of the gas density profile occurs because the shocks generated by the merger add entropy to the system and increase the buoyancy of the ICM in the relatively constant dark matter potential. The resulting profile for the enclosed gas fraction (Figures 11d and 12d) typically begins below the initial value of for radii comparable to the zone spacing, then increases roughly as and almost meets the initial profile at before flattening out to an asymptotic value slightly below the initial value. The change in curvature at small radii is also seen in the single-cluster runs and is a numerical effect due to the influence of particle-mesh force smoothing on the cuspy dark matter profile. Likewise, the drop from the initial profile between and is a numerical effect due to the expansion of material beyond the imposed initial density cutoff. The drop in the asymptotic value of the gas fraction occurs because more gas than dark matter is lost through the outflow boundary – versus – as shocks tend to eject collisional material while leaving the collisionless dark matter alone. The addition of an external confining pressure would most likely allow the asymptotic gas density slope to be flatter but leave the inner core unchanged.
This is apparent from the gas temperature profiles (Figures 11e and 12e), which show an inner region whose behavior depends on impact parameter and mass ratio and an outer region that is roughly independent of impact parameter and corresponds to the single-cluster result. The boundary between these two regions occurs at in each of the runs and is hotter relative to in the 1:1 runs than in the 1:3 runs. In all cases the final temperature profile declines more slowly at the very center than does the initial profile. Offset mergers display opposite trends with increasing for the two mass ratios: for 1:1 mergers, increasing impact parameter increases the final temperature over the head-on case, while for 1:3 mergers it decreases the temperature, reproducing the initial profile in the most offset 1:3 case. This behavior occurs because of the increase in core entropy associated with mixing of shocked gas from the outer ICM into the core material, as discussed in § 4.3. The specific entropy profile (Figures 11f and 12f) also demonstrates a parameter-independent outer region and parameter-dependent core, with the central entropy increase being over the initial central value in the hottest runs. Note that the magnitude of this increase is roughly the same for the two mass ratios.
Although the gas has not reached virial equilibrium in the simulations by Gyr, it is relatively quiescent. Figures 11g and 12g show the radial Mach number profiles for each run. Within the radial Mach number is less than 0.06 in magnitude, indicating that radial motions near the center are fairly subsonic at this point. Outside , the magnitude of the Mach number increases rapidly, reflecting the continued accretion of gas that was previously ejected from the center by the merger shocks. The gas within the initial cutoff radius is also quite close to hydrostatic equilibrium in angle average. The angle-averaged ratio of the pressure force to gravitational force per unit mass is shown in Figures 11h and 12h. Except for the innermost few zones where the small number of zones in the radial bins and truncation error in the gradient calculation dominate this ratio, it is within 15% of unity for .
4.2 Luminosity and Temperature Evolution
In the simplest self-similar picture of their assembly, clusters undergo spherical collapse and virialization and then radiate via thermal bremsstrahlung (Kaiser 1986). This model fails to predict the observed X-ray luminosity-temperature relationship: the predicted relation is , whereas the observed relation is closer to (Mushotzky 1984). Cooling flows have larger luminosities and lower average temperatures than average and are known to steepen this relation and increase its dispersion (Fabian et al. 1994). However, removing them from cluster samples in various ways does not eliminate the discrepancy (Markevitch 1998; Allen & Fabian 1999; Arnaud & Evrard 1999). Various solutions to this problem have been proposed. Most recently these have focused on raising the entropy of the ICM via nongravitational heating, though Bryan (2000) has recently suggested that galaxy formation may do the same thing by removing low entropy gas. Preheating models increase the entropy of the gas before it falls into cluster potentials (Kaiser 1991; Evrard & Henry 1991). These models require substantial amounts of heating: keV/baryon appears to be needed (Lloyd-Davies, Ponman, & Cannon 2000).
Note that the luminosity-temperature relation used to scale the initial conditions for our simulations (eq. [24]) is not retained as the mergers progress. Comparing to as time passes in run C1, we find that immediately following the initial brightness peak, the ratio of these two quantities jumps to twice its initial value, fluctuates here for a bit, increases briefly to almost six times its initial value during the second core passage, then settles down to about three times its initial value, where it remains roughly constant for the remainder of the calculation. The behavior of the other runs is similar. Thus the trajectory of the system in the plane is roughly parallel to the observed statistical relation both before and after the merger, but during the merger the system undergoes a shift to a higher temperature normalization.
The normalization of the relation is complicated by the presence of two clusters within the computational volume. In this context we note that luminosity is an ‘extensive’ quantity, which must be divided by the number of clusters one is counting, while temperature is an ‘intensive’ quantity, which does not scale with the number of clusters. For equal-mass mergers, the cluster cores merge to form a single core (to within the spatial resolution of our grid) approximately 5–7 Gyr after the initial core passage. Long before this point the clusters would be considered a single cluster with ‘bimodal’ structure if seen along the -axis, because the twin brightness peaks lie within an Abell radius of each other and are gravitationally bound. Moreover, from most lines of sight the cluster would appear to be unimodal by at most 3 Gyr after initial core passage. Indeed, the head-on collision seen along the collision axis appears to be unimodal throughout the calculation. Comparing the initial and final states of the system is less problematic. Initially we have two clusters following the imposed relation; at the end, we have one cluster with temperature 1.4 times the initial value and luminosity between 80% and 160% of the initial value of the individual clusters. Hence the final ratio of to is in the range 1.5 (run C1) to 3 (run C3).
Alternatively, one may say that the final temperature is the value expected given the final luminosity and the initial relation. Let us define
| (37) |
In the highest-resolution single-cluster run (S7) we see due to numerical effects. Nearly all of the X-ray emission arises within a few scale radii of the center of the cluster, so the increase in run S7 (and presumably a comparable portion of the increase in the merger runs) is probably due to spatial resolution. The lack of an external confining pressure (such as might be expected due to continuously infalling material from the low-density intergalactic medium) allows material from the center of the cluster to expand more than it might otherwise, causing unwanted adiabatic cooling. Although this changes , adiabatic changes yield , so cooling due to the outflow boundaries should decrease this ratio, not increase it:
| (38) |
Shocks might have a much larger effect on because they produce less of a density jump than a temperature jump. For shocks of arbitrary strength, the inverse of the shock compression is given by (Markevitch, Sarazin, & Vikhlinin 1999):
| (39) |
where () and () are the preshock (postshock) density and temperature, respectively, and is the adiabatic index. For , this gives
| (40) | |||||
The average temperature increases by about 40% during the equal-mass merger runs, so the value of lies between 1.2 and 1.5. In the 1:3 cases, the less massive cluster contributes only about 10% as much luminosity as the more massive cluster at the start of the calculation, so in this case , consistent with the range of values in the 1:1 collisions. On the other hand, equations (38) and (40) give and . Thus, the temperature increase is larger (or the X-ray luminosity increase is smaller) than expected from either shocks or adiabatic compression. This probably indicates that the luminosity increase is limited by the finite numerical resolution in the cores of the clusters and would be larger if the calculations were better resolved.
We close this section with the following note. The observation of massive clusters at high redshift (e.g., MS1054: Donahue et al. 1998) is often taken as strong evidence for low because of the exponential sensitivity of the cluster mass function to (e.g., Oukbir & Blanchard 1992). However, in deriving such constraints one directly measures an X-ray temperature, then uses the mass-temperature relation to find the mass. Our results show that this procedure is dangerous: merger shocks produce short-lived, but significant, increases in the X-ray temperature of a cluster. For a few percent of its life, a merging cluster appears much hotter, and thus more massive, than it really is (Figure 13). Furthermore, because this period corresponds to a time of significantly enhanced luminosity, merging clusters are also easier to detect. We note, for example, that MS1054 now shows evidence of substructure and a lower intrinsic temperature than first reported, suggesting that its apparent high temperature is due to an ongoing merger (Neumann & Arnaud 2000). As another example, Gómez, Hughes, and Birkinshaw (2000) have recently suggested that Abell 665, one of the richest, hottest, and most X-ray luminous clusters at redshifts , is currently undergoing a merger and is at the epoch when the cluster cores collide. This could explain its very high luminosity and temperature. We are using our results with a merger tree code to estimate the effect of merger shocks on the significance of distant, massive cluster constraints on and will address this question in a subsequent paper (Randall, Sarazin, & Ricker 2001, in preparation).

4.3 Persistence of Gas Cores and Turbulence
A cluster is defined by the presence of a distinct potential well within which dark matter, gas, and galaxies are confined. Mergers produce dramatic fluctuations in these potentials, leading eventually to the combination of the merging clusters into a single remnant. Some merging clusters in which the mergers appear to be well-advanced show a double core structure at their centers (e.g., Abell 2065; Markevitch et al. 1999), with two X-ray surface brightness peaks, indicating that the cores of the individual cluster potentials are still intact. If the original subclusters have cooling flows at their centers, the X-ray surface brightness of the surviving peaks in the subcluster potentials can be particularly large.
Cluster cores lose their distinct identity in several ways. As with galaxies that pass too close to a cluster’s center, tidal stripping can remove material from a shallower cluster potential and add it to a deeper one. In addition, violent relaxation (for collisionless matter) and ram-pressure stripping (for diffuse gas) convert the bulk kinetic energy of a cluster into dispersive or thermal energy, enabling material to become unbound from its own potential, while remaining bound within the combined potential of the material from both clusters. Dynamical friction offers another means for converting organized bulk velocities to dispersive ones, but the timescale on which it operates is typically large compared to the timescales associated with these other mechanisms.
Our results shed some light on the mechanism by which ram pressure affects the survival of cluster cores in mergers. Rather than ablating gas from the edges of a core, ram pressure disrupts cores by pushing the gas as a unit away from the center of the potential well in which it originates, causing it to become convectively unstable. The resulting convective motions destroy the spherical symmetry of the core and mix the core gas with higher-entropy shocked gas in its surroundings. This also appears to be an important mechanism by which mergers initiate turbulent motions.
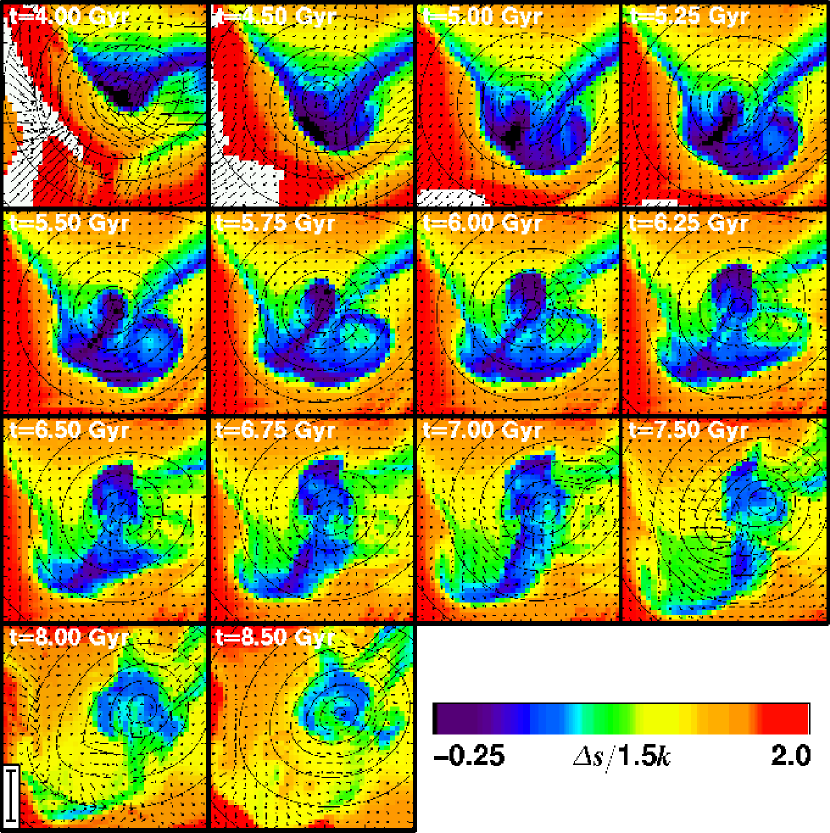
Figure 14 shows an example of this process using the specific entropy field. This example begins just after the first core interaction of run C5 (the less massive cluster core has exited to the right at 4.00 Gyr). The diffusivity of the gas is low, so the core interaction pushes low-entropy gas out of the more massive core, where it finds itself out of convective equilibrium. Beginning around 5.00 Gyr this gas flows in a plume back toward the more massive potential center. A large eddy also forms in the wake of the less massive cluster; its remnants persist until 7.00 Gyr. The plume overshoots the potential center and begins to decelerate and spread along equipotential lines. It reaches maximum overshoot around 7.00 Gyr, when it is met by high-entropy gas from the returning less massive core. The remaining gas bound to this core has higher entropy and, stripped from its potential well, is forced to flow around the plume. As the dark matter associated with the less massive cluster passes through the more massive potential well, it drives a new shock through the low-entropy gas from the more massive cluster that did not flow into the plume; this shock exits to the lower left after 8.50 Gyr. The remnants of the plume mix with the newly reshocked gas to form the core of the merger remnant, with higher entropy than was present in the original clusters.
The turbulent velocity field created by a merger lasts for several sound-crossing times. In Figure 15 we plot the rms gas velocity profile in each of the collision runs at Gyr as a fraction of the average sound speed and the circular (Keplerian) velocity. Throughout the merger remnant, turbulent velocities are subsonic: for they are typically % of the sound speed in the 1:1 cases, while the rms Mach number is about twice as large in the 1:3 cases. Outside this radius the rms velocity rises to between 60% and 100% of the sound speed, with the increase much steeper in the 1:1 cases. Throughout most of the cluster, turbulence supplies % of the hydrostatic support. In certain cases this contribution appears to be larger within the innermost or so of the core, though it is likely that here the rms velocity is overestimated due to the relatively small number of zones contributing to radial velocity averages.

Our results support the finding of others (e.g., Roettiger, Burns, & Loken 1996; Norman & Bryan 1998) that, following a merger, the intracluster medium becomes turbulent, and that turbulent pressure and bulk rotation provide less than 20% of the support needed for hydrostatic equilibrium. The picture which emerges from our calculations is that this turbulence is initiated by convective instability and, to a lesser extent, by baroclinic vorticity generation at oblique shocks. It is sustained for several Gyr by pumping due to the oscillation of the dark matter, which relaxes more slowly than the gas. While Roettiger et al. (1996) also argue for this mechanism using isolated merger simulations, Norman and Bryan (1998) find higher rms velocities in a cluster simulation involving multiple mergers and accretion, and they argue that minor mergers are the primary pumping mechanism. Our results suggest that individual major mergers and cumulative minor mergers induce comparable amounts of turbulence, since the turbulent pressure in our simulations is that of Norman & Bryan’s result even several Gyr after the collision.
To date the grid-based merger simulations used to argue for turbulence in clusters have reached spatial resolutions on the order of 10 kpc. In fully developed turbulence, the range of eddy length scales is of order
| (41) |
where is the integral scale and is the dissipation scale (Richardson 1922; Kolmogoroff 1941). Thus, directly simulating three-dimensional turbulent flow with a hydrodynamic code requires at least of order zones. For many astrophysical applications, this is impossible – for example, in stellar convective layers . However, as we have already argued, the Reynolds number of the intracluster medium during mergers is of order , and turbulence, if it is present at all, operates over a much smaller range of length scales. We therefore have some hope of performing direct numerical simulations of merger-driven turbulence within the very near future. By comparison, the simulations described in this paper achieve a spatial dynamic range of .
Several approximate methods for numerically treating turbulence exist (see Canuto 1994 for a partial review). Among these methods, large-eddy simulation (LES) has achieved some success in reproducing characteristics of turbulence in laboratory experiments (Canuto 1997). LES attempts to simulate directly only the largest-scale eddies in a turbulent flow, since these depend on the boundary conditions and geometry of the flow at the integral scale, and it uses a subgrid model to handle the (presumably universal and geometry-independent) turbulent dissipation on unresolved scales. Most grid-based astrophysical simulation algorithms are, on some level, LES, but they do not use subgrid turbulence models, instead relying on numerical dissipation at the zone scale. This numerical dissipation arises due to the truncation error of each individual method and bears no relation to the real dissipation mechanism. For most methods this practice should yield an incorrect energy dissipation spectrum, since it links large- and small-scale eddies in an unphysical way (Canuto 1997). However, it has been argued by Sytine et al. (2000) that the piecewise-parabolic method, which we employ in this paper, accurately reproduces the energy and enstrophy power spectra produced by solving the full Navier-Stokes equations in direct simulations of compressible turbulence, because it is much less dissipative than other techniques and because its dissipation is confined to narrow regions near flow discontinuities. Estimates of the dissipation in PPM for some simple flow fields (Porter & Woodward 1994) suggest that convective features spanned by 32 or more zones are well-converged. This is consistent with recent results of Calder et al. (2001) for single-mode Rayleigh-Taylor instabilities. Thus, for example, the convective plume shown in Figure 14, which measures approximately 3210 zones at maximum extent, is probably just sufficiently resolved to yield the correct growth rate. Further high-resolution calculations using adaptive mesh refinement will be useful in verifying this result (Ricker et al. 2001).
5 Summary
We have presented results from a controlled parameter study of off-axis mergers between clusters of galaxies. We have extended previous work by using the NFW density profile and nonisothermal temperature profiles, systematically controlling merger parameters and justifying their scaling, carefully studying numerical effects and convergence requirements, and examining the survival of pressure peaks and the mechanism for the onset of turbulence in mergers. We have also presented results on the variation of relaxation times, merger remnant properties, and luminosity and temperature peaks with merger parameters. The calculations presented here do not include radiative cooling or magnetic fields. We anticipate adding these physical processes in future calculations (particularly cooling, which appears to play a very important dynamical role in many observed clusters).
The morphological changes, relative velocities, and temperature jumps we observe agree well with previous studies of collisions between clusters modeled using the King profile (e.g., Roettiger et al. 1998). In particular, velocities of km s-1 are to be expected, even in quite offset mergers, for cosmologically reasonable initial conditions. The peak temperature occurs for a period at first core passage and is a factor greater than the initial temperature. We observe a larger jump in X-ray luminosity () than previous studies including dark matter, and we argue that this increase is most likely a lower limit due to our spatial resolution. Second core passage, with corresponding secondary luminosity and temperature jumps, typically occurs after the first. In the most offset 1:3 case, this secondary peak is delayed by an additional sound-crossing time. We emphasize that luminosity and temperature jumps due to mergers may have an important bearing on constraints on derived from the observation of hot clusters at high redshift. We will address this issue further in a subsequent paper.
Shocks play an important dissipative role in mergers, but they are relatively weak in the highest-density regions. As a result they do not directly raise the entropy of the cluster cores. Instead, shocks create entropy in the outer parts of the clusters, and this high-entropy gas is mixed with the core gas during later stages of the merger. Mixing is initiated by ram pressure: the core gas is displaced from its potential center and becomes convectively unstable. The resulting convective plumes initiate large-scale turbulent motions with eddy sizes up to several 100 kpc. This turbulence is pumped by oscillations in the gravitational potential, which in turn are driven by the more slowly relaxing collisionless dark matter. Even after nearly a Hubble time these motions persist as subsonic turbulence in the cluster cores, providing of the support against gravity. The dark matter oscillations are also reflected in the extremely long time following a merger required for the remnant to come to virial equilibrium. Because of the increase in core entropy, if a constant-density gas core is initially present, it is not destroyed by a merger, even if the dark matter density profile has a central cusp.
References
- (1) Allen, S. W., & Fabian, A. C. 1999, MNRAS, 297, L57
- (2) Arnaud, M., & Evrard, A. E. 1999, MNRAS, 305, 631
- (3) Blasi, P. 2000, APh, to appear (astro-ph/0008113)
- (4) Blasi, P., & Colafrancesco, S. 1999, APh, 12, 169
- (5) Bliton, M., Rizza, E., Burns, J. O., Owen, F. N., & Ledlow, M. J. 1998, MNRAS, 301, 609
- (6) Brandt, A. 1977, Math. Comp., 31, 333
- (7) Bryan, G. 2000, ApJL, 544, 1
- (8) Burns, J. O., Rhee, G., Owen, F. N., & Pinkney, J. 1994, ApJ, 423, 94
- (9) Burns, J. O., Roettiger, K., Loken, C., Norman, M., & Bryan, G. 2000, in Cluster Mergers and their Connection to Radio Sources, 24th meeting of the IAU, Joint Discussion 10
- (10) Calder, A. C., et al. 2001, to appear in Proc. 20th Texas Symposium on Relativistic Astrophysics, December 10-15, 2000, Austin, TX (astro-ph/0102239)
- (11) Canuto, V. M. 1994, ApJ, 428, 729
- (12) ________. 1997, ApJ, 478, 322
- (13) Cavaliere, A., & Fusco-Femiano, R. 1976, A&A, 49, 137
- (14) Chandran, B. D. G., Cowley, S. C., Ivanushkina, M., & Sydora, R. 1999, ApJ, 525, 638
- (15) Colella, P.& Woodward, P. 1984, JCP, 54, 174
- (16) David, L. P., Jones, C., & Forman, W. 1995, ApJ, 445, 578
- (17) Donahue, M., Voit, G. M., Gioia, I., Lupino, G., Hughes, J. P., & Stocke, J. T. 1998, ApJ, 502, 550
- (18) Edge, A. C., et al. 1990, MNRAS, 245, 559
- (19) Edge, A. C., Stewart, G. C., & Fabian, A. C. 1992, MNRAS, 258, 177
- (20) Evrard, A. E., & Henry, J. P. 1991, ApJ, 383, 95
- (21) Evrard, A. E., Metzler, C. A., & Navarro, J. F. 1996, ApJ, 469, 494
- (22) Frenk, C. S. et al. 1999, ApJ, 525, 554
- (23) Gingold, R. A.& Monaghan, J. J. 1977, MNRAS, 181, 375
- (24) Gómez, P. L., Pinkney, J., Burns, J. O., Wang, Q., Owen, F. N., & Voges, W. 1997, ApJ, 474, 580
- (25) Gómez, P. L., Hughes, J. P., & Birkinshaw, M. 2000, ApJ, 540, 726
- (26) Harris, D. E., Lari, C., Vallee, J. P., & Wilson, A. S. 1980, A&AS, 42, 319
- (27) Henriksen, M. J., & Markevitch, M. L. 1996, ApJL, 466, 79
- (28) Hockney, R. W.& Eastwood, J. W. 1988, Computer Simulation Using Particles (Bristol: IOP)
- (29) Hoyle, F. 1949, in Problems of Cosmical Aerodynamics (Dayton: Central Air Documents Office), 195
- (30) Jing, Y. P., & Suto, Y. 2000, ApJL, 529, 69
- (31) Jones, C., & Forman, W. 1984, ApJ, 276, 38
- (32) Kaiser, N. 1986, MNRAS, 222, 323
- (33) ________. 1991, ApJ, 383, 104
- (34) Kolmogoroff, A. N. 1941, Dokl. Akad. Nauk SSSR, 32, 16
- (35) Lloyd-Davies, E. J., Ponman, T. J., & Cannon, D. B. 2000, MNRAS, 315, 689
- (36) Lucy, L. B. 1977, AJ, 82, 1013
- (37) Markevitch, M. 1996, ApJL, 465, 1
- (38) Markevitch, M. 1998, ApJ, 504, 27
- (39) Markevitch, M., Forman, W. R., Sarazin, C. L., & Vikhlinin, A. 1998, ApJ, 503, 77
- (40) Markevitch, M., Sarazin, C. L., & Vikhlinin, A. 1999, ApJ, 521, 526
- (41) Markevitch, M., et al. 2000, ApJ, 541, 542
- (42) Mazzotta, P., Markevitch, M., Vikhlinin, A., Forman, W. R., David, L. P., & Van Speybroeck, L. 2001, ApJ, in press (astro-ph/0102291)
- (43) McGlynn, T. A., & Fabian, A. C. 1984, MNRAS, 208, 709
- (44) McNamara, B. R., et al. 2000, ApJL, 534, 135
- (45) Mewe, R., Kaastra, J. S., & Liedahl, D. A. 1995, Legacy, 6, 16
- (46) Molendi, S., de Grandi, S., & Fusco-Femiano, R. 2000, ApJL, 533, 43
- (47) Moore, B., Governato, F., Quinn, T., Stadel, J., & Lake, G. 1998, ApJ, 499, L5
- (48) Mushotzky, R. F. 1984, Phys. Scripta, T7, 157
- (49) Mushotzky, R. F., & Scharf, C. A. 1997, ApJ, 482, L13
- (50) Navarro, J. F., Frenk, C. S., & White, S. D. M. 1997, ApJ, 490, 493 (NFW)
- (51) Neumann, D., & Arnaud, M. 2000, ApJ, 542, 35
- (52) Norman, M. L., & Bryan, G. L. 1998, in Ringberg Workshop on M87, eds. K. Meisenheimer and H.-J. Röser (Springer)
- (53) Oukbir, J., & Blanchard, A. 1992, A&A, 262, L21
- (54) Pearce, F. R., Thomas, P. A., & Couchman, H. M. P. 1994, MNRAS, 268, 953
- (55) Peebles, P. J. E. 1969, ApJ, 155, 393
- (56) Porter, D. H., & Woodward, P. R. 1994, ApJS, 93, 309
- (57) Richardson, L. F. 1922, Weather Prediction by Numerical Process (Cambridge: CUP)
- (58) Ricker, P. M. 1998, ApJ, 496, 670
- (59) Ricker, P. M., Dodelson, S., & Lamb, D. Q. 2000, ApJ, 536, 122
- (60) Ricker, P. M., et al. 2001, to appear in Proceedings of the VII International Workshop on Advanced Computing and Analysis Techniques in Physics Research (ACAT 2000), October 16-20, 2000, Fermi National Accelerator Laboratory, Batavia, IL (astro-ph/0011502)
- (61) Roettiger, K., Burns, J., & Loken, C. 1993, ApJL, 407, 53
- (62) ________. 1996, ApJ, 473, 651
- (63) ________. 1997, ApJS, 109, 307
- (64) Roettiger, K., & Flores, R. 2000, ApJ, 538, 92
- (65) Roettiger, K., Stone, J., & Mushotzky, R. 1998, ApJ, 493, 62
- (66) Sakelliou, I. 2000, MNRAS, 318, 1164
- (67) Sarazin, C. L. 1988, X-ray Emission from Clusters of Galaxies (Cambridge: CUP)
- (68) Sarazin, C. L. 2001, in Merging Processes in Clusters of Galaxies, ed. L. Feretti, I. M. Gioia, & G. Giovannini (Dordrecht: Kluwer), in press (astro-ph/0105418)
- (69) Sarazin, C. L., & Lieu, R. 1998, ApJL, 494, 177
- (70) Schindler, S. 2000, in Cluster Mergers and their Connection to Radio Sources, 24th meeting of the IAU, Joint Discussion 10 (astro-ph/0010006)
- (71) Schindler, S., & Müller, E. 1993, A&A, 272, 137
- (72) Stevens, I. R., Acreman, D. M., & Ponman, T. J. 1999, MNRAS, 310, 663
- (73) Stewart, G. C., Fabian, A. C., Jones, C., & Forman, W. 1984, ApJ, 285, 1
- (74) Sugerman, B., Summers, F. J., & Kamionkowski, M. 2000, MNRAS, 311, 762
- (75) Sytine, I. V., Porter, D. H., Woodward, P. R., Hodson, S. W., & Winkler, K.-H. 2000, JCP, 158, 225
- (76) Takizawa, M. 2000, ApJ, 532, 183
- (77) Valinia, A., Henriksen, M. J., Loewenstein, M., Roettiger, K., Mushotzky, R. F., & Madejski, G. 1999, ApJ, 515, 42
- (78) Vikhlinin, A., Markevitch, M., & Murray, S. S. 2001, ApJ, submitted (astro-ph/0008496)
- (79) White, D. A., & Fabian, A. C. 1995, MNRAS, 273, 72
- (80) White, S. D. M. 1984, ApJ, 286, 38
- (81) Zabludoff, A. I., & Zaritsky, D. 1995, ApJ, 447, L21