DIRBE Minus 2MASS: the Cosmic Infrared Background at 3.5 Microns
Abstract
Stellar fluxes from the 2MASS catalog are used to remove the contribution due to Galactic stars from the intensity measured by DIRBE in 13 regions in the North and South Galactic polar caps. Allowing for a constant calibration factor between the DIRBE 3.5 m intensity and the 2MASS 2.2 m fluxes gives very small pixel to pixel scatter. After subtracting the interplanetary and Galactic foregrounds, a residual intensity of kJy sr-1 or nW m-2 sr-1 at 3.5 m is found. A similar analysis at 2.2 m gives a residual intensity of kJy sr-1 or nW m-2 sr-1. The intercepts of the DIRBE minus 2MASS correlation at 1.25 m show more scatter and are a much smaller fraction of the foreground, leading to a weak limit on the CIRB of kJy sr-1 or nW m-2 sr-1 (1 ).
1 Introduction
Measuring the Cosmic InfraRed Background (CIRB) was a primary goal of the Diffuse InfraRed Background Experiment (DIRBE) on the COsmic Background Explorer (COBE, see Boggess et al. (1992)) which observed the entire sky in 10 infrared wavelengths from 1.25 to 240 m. In the near infrared band the dominant foreground intensities that contaminate the CIRB in the DIRBE data are the zodiacal light (sunlight scattered by interplanetary dust) and the light from stars in the Milky Way. Hauser et al. (1998) obtained far infrared CIRB detections, but the procedure for removing galactic stars described by Arendt et al. (1998) only gave upper limits on the CIRB in the near infrared. Dwek & Arendt (1998) showed that the DIRBE 3.5 m intensity was very well correlated with the DIRBE 2.2 m intensity at high galactic latitudes. Dwek & Arendt (1998) used this correlation to convert a lower limit on the 2.2 m CIRB based on galaxy counts into a lower limit on the 3.5 m CIRB. Gorjian et al. (2000) estimated the CIRB at both 2.2 and 3.5 m by directly measuring the fluxes of galactic stars and subtracting the resulting intensity from the DIRBE maps. Wright (2001) followed the same procedure using fluxes from the 2MASS catalog. Cambrésy et al. (2001) have also used the 2MASS data to remove the galactic stars from the DIRBE data and estimate the CIRB at 1.25 and 2.2 m. The analysis of Wright (2001) was restricted to small and very dark patches of the sky, and thus did not sample a large enough range of stellar fluxes to allow an independent cross-calibration of the DIRBE and 2MASS datasets. In this paper we triple the number of pixels by extending the Wright (2001) analysis to 13 fields with a wide range of ecliptic latitudes, and combine the Wright (2001) and Dwek & Arendt (1998) techniques to obtain a new estimate of the 3.5 m CIRB.
2 Data Sets
The DIRBE Zodiacal Subtracted Mission Average (ZSMA) project data set only uses a fraction of the DIRBE data since extreme solar elongations were dropped. Therefore we used the DIRBE weekly maps: DIRBE_WKnn_P3B.FITS for . These data and the very strong no-zodi principle described by Wright (1997) were used to derive a model for the interplanetary dust foreground that is described in Wright (1998) and Gorjian et al. (2000). The zodiacal light model was then subtracted from each weekly map, and the remainders were averaged into mission averaged, zodiacal subtracted maps. At 1.25 and 2.2 m, no correction for interstellar dust emission is needed, while at 3.5 m there is a very small correction (Arendt et al., 1998). The pixels in these mission averaged, zodiacal subtracted maps provide the DIRBE data, , where is the DIRBE pixel number.
The fluxes from the 2nd incremental release of the 2MASS Point Source Catalog (Cutri et al., 2000) were converted into intensities by smearing with a square beam with a center uniformly distributed in the DIRBE pixel and orientation uniformly distributed in position angle, as described by Wright (2001). Only stars with 2MASS magnitudes were used. This procedure gives us , the estimated bright star contribution to the DIRBE intensity in the pixel.
The fields are the 4 DIRBE dark spots selected by Wright (2001), and the 9 fields selected by Johnson & Wright (2000) to not have any “placeholders” within a square. The 2MASS project created a placeholder list of bright stars which were expected to saturate the camera even on the short first read, and added these entries to the catalog. Since stars which saturate 2MASS are easily observed by DIRBE, any area with placeholders will have large residuals in the DIRBE vs. 2MASS correlation. Unfortunately the placeholder list is only 80-90% complete, and some large residuals remain in our data.
3 Analysis
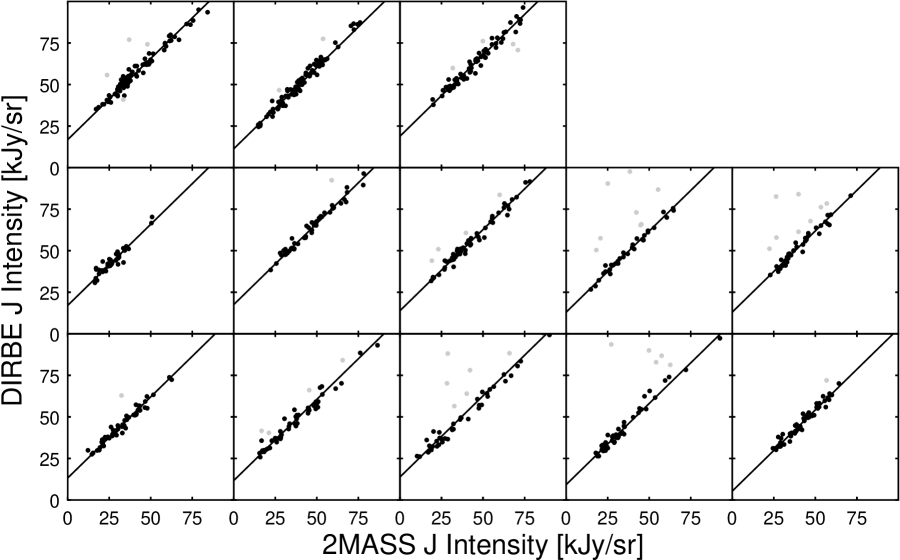
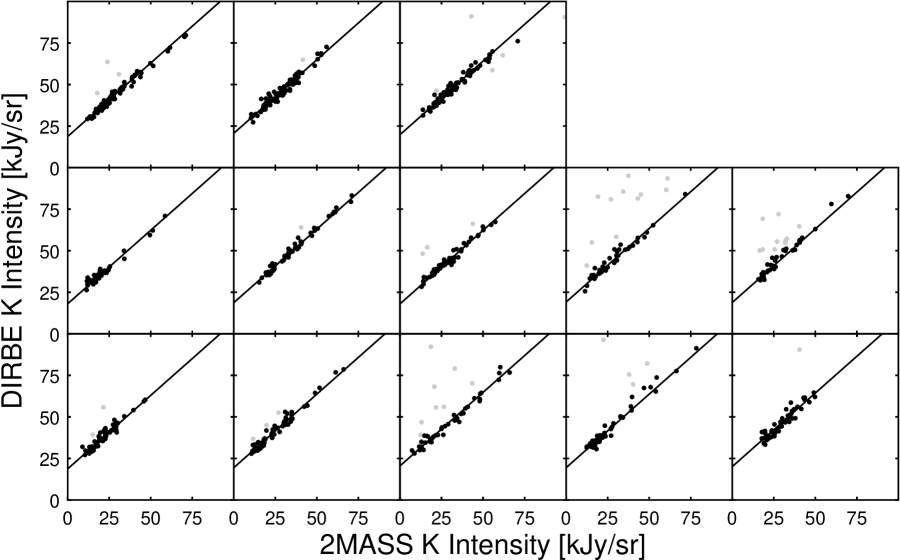
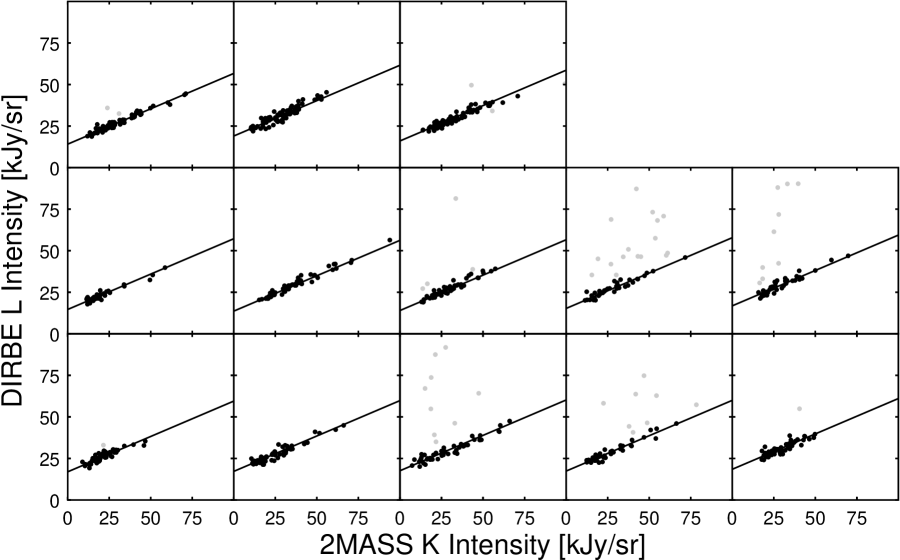
The fits shown in Figures 1, 2, and 3 are to the form
| (1) |
where is the intercept in the field, is the zodi-subtracted DIRBE intensity in the pixel, and is the bright star contribution computed by smearing the 2MASS catalog. This fit is performed by minimizing the norm of the residuals, . After performing the fit, the median of the absolute value of the residuals is found. Then a “standard deviation” is found by dividing this median error by 0.674, the conversion factor between standard errors and standard deviations for a Gaussian distribution. An outlier rejection step with a threshold of 3.5 times this standard deviation is then applied to the data. The fit and outlier rejection are iterated until no more outliers are found. The outliers are almost entirely due to saturated stars omitted from the placeholder list and to bright stars slightly off the edge of the fields.
The calibration factors for 1.25 & 2.2 m translate into DIRBE fluxes for a magnitude 2MASS star of 1477 & 542 Jy. The latter value is surprisingly small, indicating a DIRBE effective wavelength that is 10% longer than the 2MASS Ks band. The ratio of the 3.5 to the 2.2 m calibrations is 0.481 which agrees with the ratio of 0.496 found by Dwek & Arendt (1998) from the correlation of the 2.2 and 3.5 m DIRBE maps, or the 0.498 found by Wright & Reese (2000).

The contributions from stars fainter than 14th magnitude to the intercept were evaluated using the Wainscoat et al. (1992) star count model. But Wright & Reese (2000) and Gorjian et al. (2000) find that this model overpredicts high latitude star counts by 10% in the range. We apply this correction by reducing the model counts by 10% for magnitudes and obtain the faint star contributions given as and in Table 1. At 3.5 m the faint star contribution is based on the 2.2 m value multiplied by the calibration ratio of 0.481.
4 Pixel to Pixel Scatter
The pixel to pixel scatter in these fits is quite small, and much of this scatter is due to detector noise in the DIRBE experiment. To investigate this we constructed separate maps from the even weeks and from the odd weeks of DIRBE data. A difference map formed from should have the same noise as the standard DIRBE map made by averaging all the data, both even and odd, together but will have no signal. This approach was used by Wright (1998) to estimate the angular power spectrum of the DIRBE maps. The “standard deviations” of the noise only difference maps are 1.37, 1.37, and 1.15 kJy sr-1, while the signal plus noise sum maps had “standard deviations” of 2.23, 1.86, and 1.43 kJy sr-1. The quadrature differences of these scatters are 1.8, 1.3, and 0.8 kJy sr-1, or 4.2, 1.7, and 0.7 nW m-2 sr-1 at 1.25, 2.2, and 3.5 m. These differences are upper limits on any real pixel to pixel variance caused by fluctuations in the cosmic background, since the scatter in the real maps also includes the effects of imperfect modeling of the DIRBE beam, stellar variability, and small scale structure in the zodiacal light model. These upper limits are well below the detections claimed by Kashlinsky & Odenwald (2000) at 1.25 and 2.2 m. Figure 4 shows the histograms of the residuals of the fits to the noise only difference map on the left and the signal plus noise sum map on the right. Clearly the scatter is dominated by the detector noise.
| 108 | +58 | 3.6 | 1.9 | 16.8 | 18.7 | 14.1 |
|---|---|---|---|---|---|---|
| 157 | -83 | 2.9 | 1.5 | 11.3 | 20.7 | 19.0 |
| 258 | -59 | 3.9 | 2.0 | 18.9 | 19.8 | 16.0 |
| 127 | +64 | 3.1 | 1.6 | 17.1 | 18.1 | 14.6 |
| 66 | +58 | 4.8 | 2.5 | 17.6 | 18.7 | 13.7 |
| 88 | +75 | 3.4 | 1.7 | 13.9 | 18.0 | 14.0 |
| 122 | +85 | 3.1 | 1.6 | 13.0 | 19.1 | 15.2 |
| 178 | +79 | 3.0 | 1.5 | 13.0 | 18.8 | 16.8 |
| 182 | +62 | 3.3 | 1.7 | 13.2 | 18.7 | 16.9 |
| 194 | +72 | 3.0 | 1.5 | 11.7 | 19.4 | 17.2 |
| 195 | +66 | 3.1 | 1.6 | 13.8 | 20.5 | 17.6 |
| 205 | +67 | 3.1 | 1.6 | 9.2 | 19.4 | 17.4 |
| 218 | +61 | 3.4 | 1.8 | 5.3 | 20.1 | 18.5 |
5 Cosmic Infrared Background
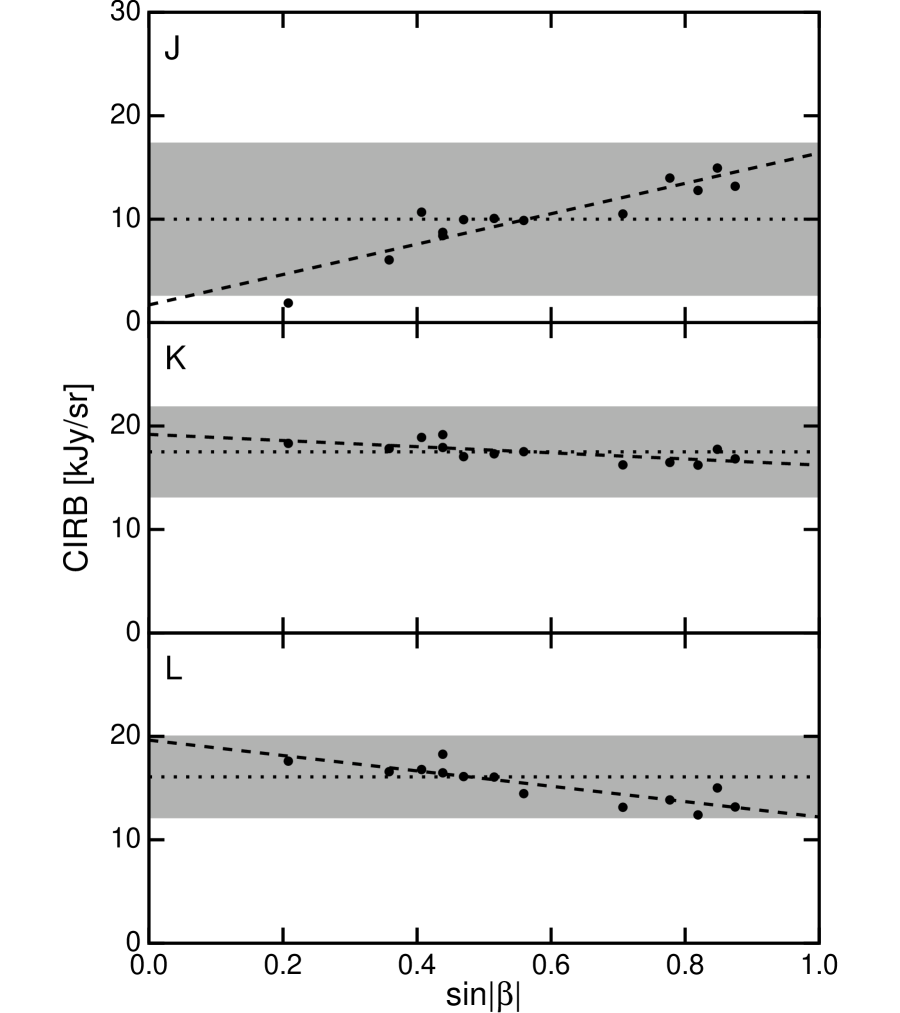
For each field an estimate of the CIRB is obtained from the quantity . This is plotted for the 3 bands and 13 fields in Figure 5. Note that the values at 1.25 m show a strong trend with the ecliptic latitude , while the 2.2 m values show very little trend and the 3.5 m values show a small negative trend. These trends with ecliptic latitude clearly show that the models of the interplanetary dust are imperfect.
The zodiacal light model we have used was described by Gorjian et al. (2000) and Wright (1998). The estimated uncertainty in the zodiacal light model is 5% of the value at the ecliptic pole, which gives errors of 5.9, 3.8, and 3.3 kJy sr-1. The DIRBE project ZSMA datasets were computed using the Kelsall et al. (1998) model which gives estimates for the zodiacal intensity at the pole which are 9.2, 3.9, and 4.0 kJy sr-1 smaller than the model used here, and thus lead to estimates of the CIRB that are larger than our estimates.
There is a small correction for faint galaxies that appear in the 2MASS PSC catalog. These have been subtracted along with the galactic stars, but should be included in the CIRB. Wright (2001) estimates that this correction is 0.05 and 0.1 kJy sr-1 at 1.25 and 2.2 m. The 0.1 kJy sr-1 correction at 2.2 m implies a 0.05 kJy sr-1 at 3.5 m since the ratio of the 3.5 to 2.2 m calibration factors is 0.481.
The CIRB values we report are based on the median of the 13 different values from our 13 fields, corrected for the small contribution of galaxies in the 2MASS PSC catalog. The sources of uncertainty are listed in Table 2. The statistical uncertainty in the median is quite small. The relative uncertainty in the faint star correction is . The relative uncertainty in the galaxy correction is . The calibration uncertainty is determined from the change in the median when the calibration factor is forced to be changed by , except for 2.2 m where the change is due to the large difference between this calibration and the expected value. The zodiacal uncertainty is of the value at the ecliptic poles. The error generated by the trend with is the slope with respect to divided by . This is the standard deviation for a single field chosen at random over the sky. In principle, with fields, one could divide this uncertainty by , but we have chosen not to because this is a systematic error. It is possible that this slope error term and the zodiacal pole error term are double counting the systematic error due to imperfect modeling of the interplanetary dust cloud, but we have included both to be conservative.
| Component | |||
|---|---|---|---|
| Statistical | 0.50 | 0.36 | 0.34 |
| Faint Stars | 0.34 | 0.18 | 0.09 |
| Galaxies | 0.05 | 0.10 | 0.05 |
| Calibration | 1.36 | 2.03 | 0.60 |
| Zodiacal | 5.87 | 3.79 | 3.25 |
| slope | 4.24 | 0.86 | 2.14 |
| Quadrature Sum | 7.39 | 4.40 | 3.95 |
6 Discussion
The results reported in this paper are consistent with most previous determinations of the near infrared cosmic background. The at 2.2 m and at 3.5 m reported by Gorjian et al. (2000) was for a single field at high ecliptic latitude. The fields used in this paper are more uniformly distributed in , and the trend with seen in Figure 5 explains most of the difference between Gorjian et al. (2000) and the present paper at 3.5 m. Wright & Reese (2000) found at 2.2 m and at 3.5 m, which are consistent with the present results.
Wright (2001) reported at 1.25 m and at 2.2 m. The smaller present value at 1.25 m is explained by the trend with ecliptic latitude and the inclusion of fields closer to the ecliptic in the present work. The larger present value at 2.2 m is explained by the low calibration factor we find when the calibration is allowed to be a free parameter.
Cambrésy et al. (2001) give at 1.25 m and at 2.2 m, but they used the DIRBE ZSMA project data sets which are based on the Kelsall et al. (1998) zodiacal light model. If we apply the difference between this model and our model at the ecliptic poles, we reduce the Cambrésy et al. (2001) central values to 13.7 and 16.5 kJy sr-1 at 1.25 and 2.2 m which are consistent with the present results.
Matsumoto (2000) gives and at 1.25 and 2.24 m using the Kelsall et al. (1998) zodiacal light model which become and after correcting for the difference between the zodiacal light models. Thus these results from the IRTS experiment are consistent with the DIRBE results reported here.
Bernstein, Freedman & Madore (2001) have measured the optical extragalactic background light and obtain (2 errors) using the HST at which is consistent with a reasonable extrapolation through the uncertain -band result reported here.
While these DIRBE, IRTS and HST determinations of the extragalactic background by direct observation of the total light of the sky are all in concordance when consistent zodiacal light models are used, there is a large discrepancy between the directly measured extragalactic light and the background determined from galaxy counts: where is the number of sources per steradian brighter than flux . Madau & Pozzetti (2000) give at both 0.81 and 2.2 m. These values from number counts are really only lower limits to the total extragalactic background, but it is disturbing that both the Bernstein, Freedman & Madore (2001) background at 0.81 m and the 2.2 m background reported here are 3 times higher than the lower limit. This discrepancy could well be caused by a combination of several small corrections to the counting and photometry of galaxies instead of an exotic new emission process such as a decaying neutrino (Sciama, 1998). The ultra-compact dwarf galaxies found by Phillipps et al. (2001) would not have been included in any galaxy counts, but seem to account for only a small percentage of the total galaxy light. Galaxies fainter than the limits of current number counts may add to the total light from galaxies (Totani et al., 2001). The intergalactic stars seen by Ferguson, Tanvir & Von Hippel (1998) may add another 10 to 20% to the total light. Low surface brightness galaxies and outer parts of normal galaxies may have been neglected in the counts due to the high brightness of the night sky at 2.2 m from ground-based observatories. Several 10% corrections or a few 20% corrections when combined could make the integrated light from sources agree to within the zodiacal model uncertainty with the directly measured background. Thus the suggestion by Cambrésy et al. (2001) that a novel source is needed to explain the high value level of the CIRB may be premature.
The technique of using the 2MASS catalog to remove the galactic star contribution in the DIRBE data works well, and allows us to generate CIRB estimates at 1.25, 2.2, and even 3.5 m that are limited by the uncertainty in the zodiacal light model. When 2MASS data over the entire sky are released, it should be possible to improve the zodiacal light model by requiring that near infrared DIRBE2MASS values be independent of ecliptic latitude. An improved knowledge of the zodiacal light along with SIRTF measurements of at 3.5 m that are sensitive to both low surface brightness parts of known sources and to new populations of low surface brightness sources should lead to a better understanding of the near infrared extragalactic background.
References
- Arendt et al. (1998) Arendt, R., Odegard, N., Weiland, J., Sodroski, T., Hauser, M., Dwek, E., Kelsall, T., Moseley, S. H. Jr., Silverberg, R., Leisawitz, D., Mitchell, K., Reach, W. & Wright, E. 1998, ApJ, 508, 74
- Bernstein, Freedman & Madore (2001) Bernstein, R., Freedman, W. & Madore, B. 2001, ApJ, in press
- Boggess et al. (1992) Boggess, N. W. et al. 1992, ApJ, 397, 420
- Cambrésy et al. (2001) Cambrésy, L., Reach, W., Beichman, C. & Jarrett, T. 2001, ApJ, 555, 563
- Cutri et al. (2000) Cutri, R. et al., 2000, “Explanatory Supplement to the 2MASS Second Incremental Data Release,” http://www.ipac.caltech.edu/2mass/releases/second/doc/explsup.html, viewed 28 March 2000.
- Dwek & Arendt (1998) Dwek, E. & Arendt, R. 1998, ApJ, 508, L9
- Ferguson, Tanvir & Von Hippel (1998) Ferguson, H., Tanvir, N. & von Hippel, T. 1998, Nature, 391, 461
- Gardner et al. (1993) Gardner, J. P., Cowie, L. L. & Wainscoat, R. J. 1993, ApJ, 415, L9
- Gorjian et al. (2000) Gorjian, V., Wright, E. & Chary, R. 2000, ApJ, 536, 550
- Hauser et al. (1998) Hauser, M. G., Arendt, R. G., Kelsall, T., Dwek, E., Odegard, N., Weiland, J. L., Freudenreich, H. T., Reach, W. T., Silverberg, R. F., Moseley, S. H., Pei, Y. C., Lubin, P., Mather, J. C., Shafer, R. A., Smoot, G. F., Weiss, R., Wilkinson, D. T. & Wright, E. L. 1998, ApJ, 508, 25
- Johnson & Wright (2000) Johnson, B. & Wright, E. 2000, paper #72.03 at the 197th AAS meeting
- Kashlinsky & Odenwald (2000) Kashlinsky, A. & Odenwald, S. 2000, ApJ, 528, 74
- Kelsall et al. (1998) Kelsall, T., Weiland, J. L., Franz, B. A., Reach, W. T., Arendt, R. G., Dwek, E., Freudenreich, H. T., Hauser, M. G., Moseley, S. H., Odegard, N. P., Silverberg, R. F. & Wright, E. L. 1998, ApJ, 508, 44
- Madau & Pozzetti (2000) Madau, P. & Pozzetti, L. 2000, MNRAS, 312, L9
- Matsumoto (2000) Matsumoto, T. 2000, The Institute of Space and Astronautical Science Report SP No. 14, p. 179
- Phillipps et al. (2001) Phillipps, S., Drinkwater, D., Gregg, M. & Jones, J. 2001, ApJ in press.
- Sciama (1998) Sciama, D. 1998, astro-ph/9811172
- Totani et al. (2001) Totani, T., Yoshii, Y., Iwamuro, F., Maihara, T. & Motohara, K. 2001, ApJ in press
- Wainscoat et al. (1992) Wainscoat, R.J., Cohen, M., Volk, K., Walker, H.J., & Schwartz, D.E. 1992, ApJS, 83, 111
- Wright (1997) Wright, E. 1997, BAAS, 29, 1354
- Wright (1998) Wright, E. 1998, ApJ, 496, 1
- Wright & Reese (2000) Wright, E. & Reese, E. 2000, ApJ, 545, 43
- Wright (2001) Wright, E. 2001, ApJ, 553, 538