Absolute kinematics of radio source components in the complete S5 polar cap sample
We observed the thirteen extragalactic radio sources of the S5 polar cap sample at 8.4 GHz with the Very Long Baseline Array, on 1997.93 and 1999.41. We present the maps from those two epochs and briefly discuss the morphological changes experimented by some of the radio sources in the 1.4 yr elapsed. These results correspond to the first two epochs at 8.4 GHz of a program directed to study the absolute kinematics of the radio source components of the members of the sample by means of phase delay astrometry at 8.4, 15 and 43 GHz.
Key Words.:
astrometry – techniques: interferometric – quasars: individual: QSO 0016+731, QSO 0153+744, QSO 0212+735, QSO 0615+820, QSO 0836+710 (4C 71.07), QSO 1039+811, QSO 1150+812, QSO 1928+738 (4C 73.18) – BL Lacertae objects: individual: BL 0454+844, BL 0716+714, BL 1749+701, BL 1803+784, BL 2007+7771 Introduction
Very-long-baseline interferometry (VLBI) allows routine imaging of compact radio sources with milliarcsecond resolution. Use of phase-delay astrometric techniques in VLBI also allows determinations of relative positions with nearly microarcsecond accuracy (e.g., Marcaide & Shapiro mar83 (1983)). Moreover, phase delay astrometry, unlike group-delay astrometry, permits a reliable subtraction of the source structure contribution to the delay, by referring such contribution to a reference point in the map. Such a (fixed) reference point provides an unambiguous identification of radio source features seen at different epochs, crucial for the determination of the absolute kinematics of the components (see Charlot et al. cha90 (1990), Guirado et al. 1995b , Ros et al. ros99 (1999)).
In the past, our group has successfully applied phase-delay astrometry techniques to a number of pairs of radio sources. Guirado et al. (gui95a (1995, 1998)) studied the pair QSO 1928+738/BL 2007+777 (about 5∘ apart) at 2.3, 5, and 8.4 GHz. Ros et al. (ros99 (1999)) added a new source (BL 1803+784) to this pair, and extended the phase-connection technique (Shapiro et al. sha79 (1979)) to separations of 68 from observations at 8.4 GHz. Pérez-Torres et al. (per00 (2000)) successfully applied the phase-connection technique to the radio sources QSO 1150+812/BL 1803+784 (nearly 15∘ apart), from observations at 2.3 and 8.4 GHz. In addition, Ros et al. (ros00 (2000)) and Pérez-Torres et al. (per00 (2000)) have demonstrated that dual-frequency observations are not required anymore to subtract the ionospheric delay from the data. Indeed, those authors showed that it is possible to accurately model the ionosphere contribution from Global Positioning System data taken at sites nearby VLBI stations.
The astrometric results mentioned above have encouraged us to try to demonstrate the feasibility of the phase-connection technique for a complete sample of radio sources, using single-frequency VLBI observations, with the aim of studying the absolute kinematics of all the sources in the sample. Our sample consists of the 13 sources selected by Eckart et al. (eck86 (1986, 1987)) from the S5 survey (Kühr et al. kuh81 (1981)), with the following selection criteria: a) declination , galactic latitude , b) flux density Jy at the epoch of the survey, and c) spectral index (). Throughout the paper, we will refer to those 13 radio sources as “the complete S5 polar cap sample”.
We show in Fig. 1 the sky distribution of the members of the complete S5 polar cap sample, and indicate their names and relative angular separations. All 13 members of this sample are at such close angular distances that the use of an appropriate observing scheme permits a successful phase-connection of the data for a 24-hour observing Very Long Baseline Array (VLBA) run. Provided that enough phase-delay data (usually several hours) are acquired for each of the 13 radio sources, we should be able to solve for their positions with accuracies better than 0.1 milliarcseconds (mas). Once we precisely determine the relative positions of all the members of the S5 polar cap sample at 8.4 GHz for several epochs, the registration of the maps should be straightforward.
Such an astrometric analysis should allow us to unambiguously discern – for each of the 13 radio sources – which components are moving and which are stationary. Finding stationary components in 15 sources (the 13 of our sample, 3C 345 (Bartel et al. bar86 (1986)), and 1038+528 A (Marcaide et al. mar94 (1994))) would strongly support the standard model for AGNs (Blandford & Königl bla79 (1979)). On the contrary, finding that some have no stationary components might reveal phenomena unthought. Knowing which components move and how, in an absolute sense, should allow us to propose the correct physical models.
As a first step in the astrometric process, we present here the hybrid maps of all radio sources at 8.4 GHz for the two observing epochs. The astrometric results will be shown in further publications.
We concisely describe the 8.4 GHz observations in Sect. 2, and present the source maps corresponding to the first (1997.93) and second (1999.41) epochs for all 13 radio sources in Sect. 3. We conclude with some summary remarks in Sect. 4.

2 Observations
We observed the complete S5 polar cap sample at 8.4 GHz on 6 December 1997 (epoch 1997.93) and on 28 May 1999 (epoch 1999.41) with the VLBA, each time for 24 hours. We used each time the recording mode 128–8–1 (1 bit sampling, 16 channels per each of the 8 IFs, with a total of 128 channels), yielding a total bandwidth of 64 MHz, in right circular polarization. Data were correlated at the VLBA Array Operations Center of the National Radio Astronomy Observatory (NRAO) in Socorro, New Mexico, using a basic integration time of 4 s. All radio sources were detected and provided fringes for all baselines. We observed in groups of 3 or 4 radio sources in a cyclic way with duty cycles of about 6 min. Every scan was 78 s long, and the small (a few seconds) time gap between different scans was used for slewing the VLBA antennas. We replaced one or two members of the group of observed sources by new members about every 2 hours, until all 13 members of the sample were observed. This observing scheme resulted in a time coverage for each single radio source of about 4 hours. We tracked the clock behavior – of relevance for the ulterior astrometric analysis – by including some scans of BL 0454+844 in all groups observed during the first 12 hours, and of BL 2007+777 in all groups observed during the second 12 hours.
After having fringe-fitted the correlator output, we obtained correlation amplitudes for each source. We then constructed the visibility amplitudes in a standard manner, using the antenna gain and system temperature information provided by each station. We exported the data for use with the Caltech VLBI Package (Pearson pea91 (1991)) and the difference mapping software difmap (Shepherd et al. she94 (1994)).
|
||||||||||||||||||||||||||||||||||||||||||||||||||||||||||||||||||||||||||||||||||||||||||||||||||||||||||||||||||||||||||||||||||||||||||||||||||||||||||||||||||||||||||||||||||||||||||||||||||||||||||||||
-
a
The restoring beam is an elliptical Gaussian with full-width-half-maximum (FWHM) axes . For each source, the position angle (P.A.) stands for the direction of the major axis (measured north through east).
-
b
Total flux density recovered in the hybrid mapping process.
- c
|
|||||||||||||||||||||||||||||||||||||||||||||||||||||||||||||||||||||||||||||||||||||||||||||||||||||||||||||||||||||||||||||||||||||||||||||||||||||||||||||||||||||||||||||||||||||||||||||||||||||||||||||||||||||||||||||||||||||||||||||||||||||||||||||||||||||||||||||||||||||||||||||||||||||||||||||||||||||||||||||||||||||||||||||||||||||||||||||||||||||||||||||||||||||||||||||||||||||||||||||||||||||||||||||||||||||||||||||||||||||||||||||||||||||||||||||||||||||||||||||||||||||||||||||||||||||||||||||||||||||||||||||||||||||||||||||||||||||||||||||||||||||||||||||||||||||||||||||||||||||||||||||||||||||||||||||||||||||||||||||||||||||||||||||||||||||||||||||||||||||||||||||||||||||||||||||||||||||||||||||||||||||||||||||||||||||||||||||||||||||||||||||||||||||||||||||||||||||||||||||||||||||||||||||||||||||||||||||||||||||||||||||||||||||||||||||||||||||||||||||||||||||||||||||||||||||||||||||||||||||||||||||||||||||||||||||||||||||||||||||||||||||||||||||||||||||||||||||||||||||||
-
Note:
For each source whose name is on the first column, the other columns correspond to the component designation (as indicated in Figs. 2 to 16), flux density, separation and position angle relative to the strongest component, major axis, axis ratio, and position angle of the major axis. The uncertainties give have been estimated from the exploration of the parameter space (, and ), and from empirical considerations (e.g., the errors of the component positions are typically smaller than a tenth of a beam width, but to be conservative we have assumed a magnitude of a fifth of beam width for them).
-
a
This component is model fitted as double only in the first epoch. In the second epoch the model fit algorithm merged both components into a single one.
3 Imaging results
We obtained images of all 13 radio sources using standard hybrid mapping techniques. We found only minor calibration problems for data from the North Liberty antenna at epoch 1997.93; we had to multiply gain by a factor 2.03 – for all IF channels – to get consistent results with the other nine antennas. We show the maps obtained in Figs. 2 through 16. In all figures, east is left, and north is up. We list the main parameters of those maps in Table 1. We use a Hubble constant = km s-1 Mpc-1 and a deceleration parameter =, which results in the linear scales (10 pc) plotted on the bottom right corner of each image.
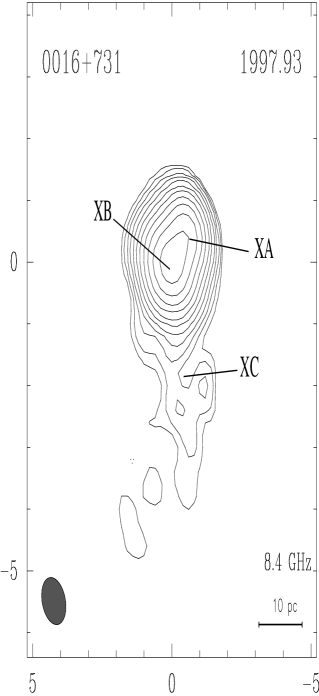
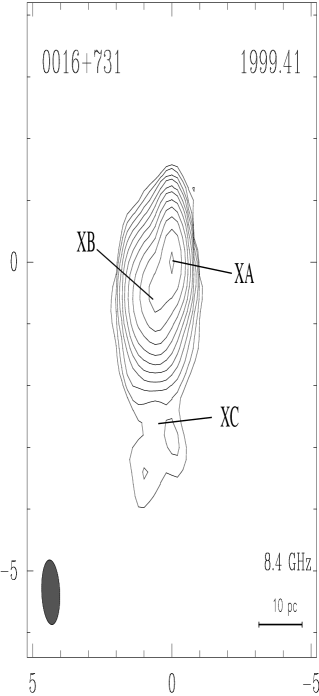
3.1 QSO 0016+731
The QSO 0016+731 has an optical magnitude =19.0 and a redshift =1.781 (Stickel & Kühr sti96 (1996)). Eckart et al. (eck87 (1987)) reported that almost all of its flux density originates in an area smaller than 3 mas and that it does not have extended structure with flux density larger than 0.1 Jy at 5 GHz. Pearson & Readhead (pea88 (1988)) confirmed this result. This source experienced a decrease of the flux density through the nineties, from 1.5 Jy for the period 1990 - 1995 to 0.4 Jy for the second half of the decade.
Our maps (Fig. 2) show a double structure along P.A.130°at both epochs. However, an alteration in the morphology of the source is clearly seen between the first and the second epoch. The total mapped flux density decreased from 528 mJy to 387 mJy (27 %). This decrease in the total flux density of the source is due to a strong decrease in the flux of the westernmost component (XB, the brightest feature in Fig. 2). To quantify those changes, we used the tasks modelfit and modfit of the Caltech package (Pearson pea91 (1991)) to fit the visibility data to a model of elliptical components with Gaussian brightness profiles. The models are presented in Table 2. The modeling provides reasonable fits with three components: a compact one (XA), a second, more elongated one (XB) west of XA, and a third, weaker one (XC), the extended emission south of XA. The changes in the maps are likely associated to component XB, whose flux density decreased from 367 mJy to 205 mJy (45%), while the emission of component XA remained more stable.
3.2 QSO 0153+744
The QSO 0153+744, has =16.0 and =2.338 (Stickel & Kühr sti96 (1996)). At kiloparsec-scales, this source does not display large structures (Hummel et al. (hum97 (1997)). At pc-scales, QSO 0153+744 is a compact double radio source embedded in a halo, with a separation of 10 mas between components (Eckart et al. eck87 (1987); Hummel et al. hum88 (1988); Pearson & Readhead pea88 (1988)). The jet, as seen in projection, changes its direction by a full 180° between component A and the bright secondary component B, located about 10 mas from the core at P.A. °. No component motion has been detected. The source flux density at 8.4 GHz has been roughly stable at 0.8 Jy, from 1996 to 1999.
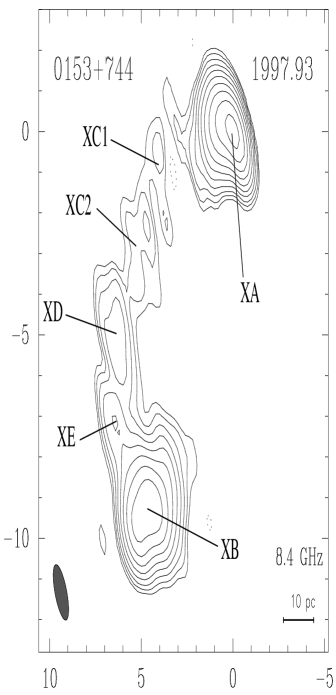
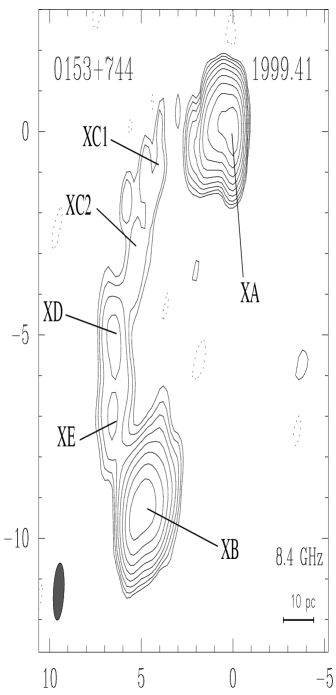
Fig. 3 shows the two components reported by Eckart et al. (eck87 (1987)) (XA and XB in the figure), and emission in an arc joining the two components. Both XA and XB are well modeled at each epoch by four Gaussian individual components (Table 2). The complex structure of this radio source does not show dramatic changes over the years, although some slight changes are readily visible. The overall flux density has been decreasing slowly in the second half of the nineties (Peng et al. pen00 (2000)). A careful astrometric test of the registration of the maps (Ros et al., in preparation), should shed more light on eventual proper motions in the components of this source.
3.3 QSO 0212+735
The QSO 0212+735 has =19.0 and =2.367 (Stickel & Kühr sti96 (1996)). This source does not show extended emission at kpc scales in VLA images obtained at 1.49 GHz (Antonucci et al. ant86 (1986)). Eckart et al. (eck87 (1987)) reported a core-jet structure with a jet extending 12.5 mas away from the core in P.A. 91° at 1.7 GHz. Pearson & Readhead (pea88 (1988)) reported a very similar structure to that found by Eckart et al. (eck87 (1987)). More recently, Fey et al. (fey96 (1996)) reported maps at 2.3 GHz that show an elongated jet with a strong component at 13 mas (P.A. 91°) of the core and a fainter component at 41 mas (P.A. 95∘) from the core. Their 8.4 GHz map shows extended emission up to 14 mas, in P.A. 42°.
Our maps at 8.4 GHz (Fig. 4) display a jet-like structure prolonging eastwards up to 14 mas. We reproduce the emission of the radio source at each epoch with a 7–component model (Table 2). The peak of brightness corresponds to component XB. In the first epoch, XA is at 0.5 mas northwest of XB, in P.A. 55°. In the second epoch, some structure is visible west of the brightest region XA/XB.
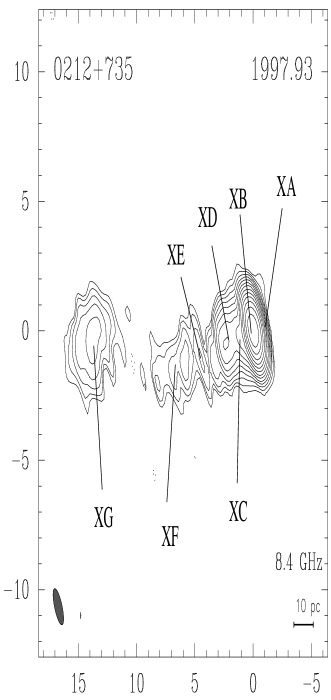

Lacking an accurate astrometric registration, all components seem to have remained unchanged for the last 20 years. Note that component XG, about 13.8 mas (P.A. 93°) east of the peak of brightness, with a 3% of the total mapped flux density, appears unchanged between our two epochs.
3.4 BL 0454+844
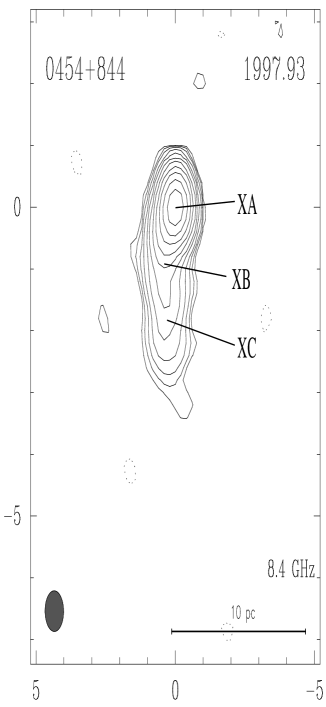
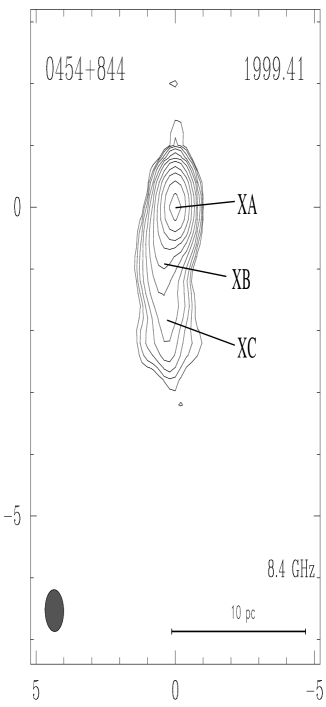
The BL Lacertae object BL 0454+844, with =16.5 and =0.112 (Stickel & Kühr sti96 (1996)) has been reported to contain all the flux density in its milliarcsecond structure (Eckart et al. eck87 (1987)). Those authors reported a strong core emission and weaker extended emission southwards, which was also confirmed by Pearson & Readhead (pea88 (1988)). Its radio emission shows variability on scales of (several) months. It registered a local maximum in mid 1995, and it has since then been decreasing (by 40%) through late 1999. Then, its flux density has started to increase again (Peng et al. pen00 (2000)). Our maps (Fig. 5) show a very compact structure. There is no emission outside 4 mas of the core. We reproduce its emission with a three-component model (see Table 2). It is interesting to notice that the most compact source in the sample has also the smallest redshift.
3.5 QSO 0615+820
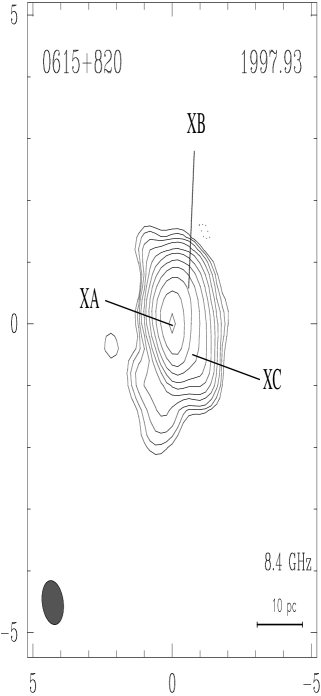
The QSO 0615+820 is a radio source with =17.5 and =0.710 (Stickel & Kühr sti96 (1996)). Eckart et al. (eck87 (1987)) reported this radio source to be unresolved, and modeled it with a single elliptical Gaussian profile elongated in P.A. 195° at 5 GHz and in P.A. 181° at 15 GHz.
Our maps (Fig. 6) show a compact plateau-like structure within 2–3 mas; however, we could not reasonably fit the brightness distribution with a single elliptical Gaussian component. We obtained good Gaussian fits (Table 2) with three close components within 1 mas, with a spatial L-shaped distribution, being the brightest one XA, to the east.

3.6 BL 0716+714
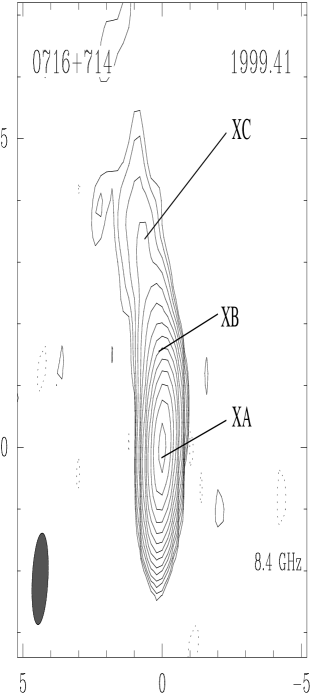
The object BL 0716+714 () is a rapidly variable source across the electromagnetic spectrum, a paradigm of the intra-day variable (IDV) behavior (Quirrenbach et al. qui91 (1991); Wagner et al. wag96 (1996)). No sign of optical counterpart exists, and thus no redshift is available. This fact prompted several authors (e.g., Eckart et al. eck87 (1987)) to assume a value of . Previous radio maps show a core-halo structure on arcsecond scales (Antonucci et al. ant86 (1986)). VLBI maps at 5 and 22 GHz show a very compact source on the milliarcsecond-scale with some hints of a core-jet structure oriented along a P.A. 10°(Eckart et al. eck87 (1987)).
Our maps (Fig. 7) show a core-jet structure extended northwards. We modeled the structure with three components (see Table 2). In the first epoch the components lie at 0.8 mas (XB) and 1.8 mas (XC) (P.A. 11°) of the main component (XA), and in the second epoch, at 1.0 and 3.3 mas (again P.A. 11°). Taking the association at face value, and for the elapsed period of time between both epochs (1.5 yr), XC would have moved with a rate of 0.7 mas yr-1. However, BL 0716+714 looks more than a source with “flaming” features than the “classical” core-jet structure with components emerging from the core and traveling along the jet. In a classical core-jet source the emergence of components is related to changes in the flux density. For this source, the flux density has changed dramatically from one epoch to the other (University of Michigan Radio Astronomy Observatory data base and Peng et al. pen00 (2000)). After smooth flux density changes from 1994 to 1997, the flux density began to rise by mid 1997. A decrease followed by late 1997, and a rise of more than 100% by the first half of 1998, remaining stable over the following months until a further decrease took place by mid 1999. We mapped a total flux density of 0.377 Jy in 1997.93, and 0.990 Jy in 1999.41. This source is a case where frequent sampling of the structure and astrometric registration are essential to correctly interpret the source structure changes.

3.7 QSO 0836+710 (4C 71.07)
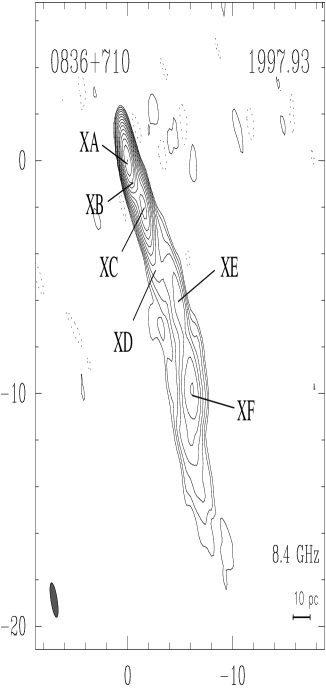
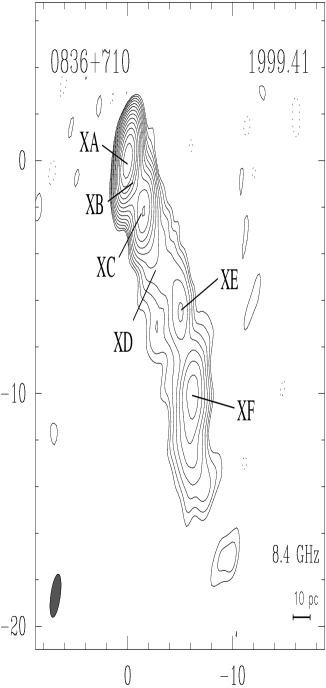
The QSO 0836+710 has =16.5 and =2.172 (Stickel & Kühr sti96 (1996)). At kpc-scales, it displays a highly polarized secondary component 1.3 arcsec off the core at P.A.200∘ (Perley per80 (1980), O’Dea et al. ode88 (1988)). MERLIN-VLBI images at 90 and 18 cm show a jet structure extending up to 150 mas in direction to the outer arcsecond lobe (Hummel et al. 1992b ). It shows a complex and wiggled one-sided core-jet structure along P.A.215∘ at pc-scales. The structure of the jet can be characterized by a sequence of kinks among which the jet follows a slightly curved path (Krichbaum et al. kri90 (1990)). Based on data at 8.4, 15, 22, and 86 GHz, Otterbein et al. (ott98 (1998)) reported the ejection of a new component at mas scales around epoch 1992.65, with an apparent superluminal motion of =0.260.03 mas/yr. The ejection of this component would be directly related to gamma-, X-ray, and optical activity observed in February 1992 (Otterbein et al. ott98 (1998)).
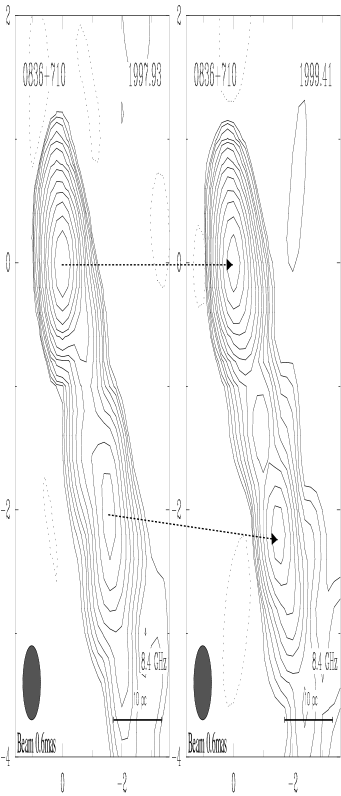
Although our maps (Fig. 8) are convolved with differently oriented beams, the features in the maps can be identified unambiguously. We detect emission up to 30 mas away of the core, although we plot the structure only extending 15 mas from the core to see more clearly the main features. We reproduce the emission up to 12 mas from the core with six components. We convolved our images with a circular beam of 0.6 mas size to better compare the inner structure changes, and show them in Fig. 9. We can neither confirm nor reject the superluminal motion reported by Otterbein et al. (ott98 (1998)), until an astrometric registration between our both images becomes available. Only from our model fitting it is difficult to establish proper motions between components from our model fitting (Table 2).
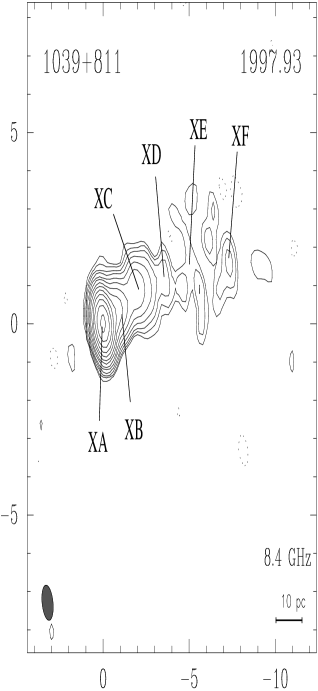
3.8 QSO 1039+811
The QSO 1039+811 has =16.5 and =1.264 (Stickel & Kühr sti96 (1996)). Eckart et al. (eck87 (1987)) reported a pc-scale core-jet structure with a jet oriented with P.A. at 5 GHz. This radio source displays misalignment between the pc-scale and the kpc-scale structure (Appl et al. app96 (1996)).
Our maps (Fig. 10) show extended jet structure up to 10 mas away of the core component. The multi-frequency flux density monitoring reported by Peng et al. (pen00 (2000)) shows a rise from 1997 to 1999. Our maps, however, have almost the same flux density for both epochs (0.888 and 0.886 Jy at 1997.93 and 1999.41, respectively). The model fitting (Table 2) reports an apparent backwards motion of the components XB (from 0.9 to 0.4 mas from XA), XC (2.1 to 1.8 mas), XD (3.1 to 2.5 mas), XE (5.3 to 4.8 mas), and XF (7.7 to 7.4 mas). This apparently contracting motion could be related to changes in the core region. The emergence of a component, in its early stage, can produce apparent backward motions of the rest of the jet components at cm-wavelengths (see, e.g., Guirado et al. (gui98 (1998)) and Ros et al. (ros99 (1999)) for QSO 1928+738). Those effects should be tested after the astrometric alignment of the images becomes available. Note that the moving components are very weak in comparison with the main feature (which contains more than the 80% of the mapped flux density in both cases), and also that the -sampling, and consequently the synthesized beams, differ substantially from the first epoch to the second.

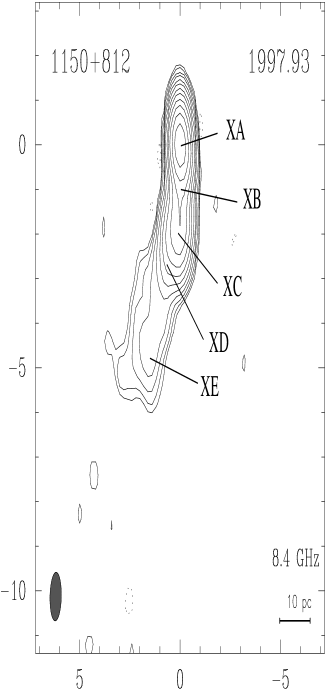
3.9 QSO 1150+812
The QSO 1150+812 has =18.5 and =1.250 (Stickel & Kühr sti96 (1996)). Its radio structure has been studied at pc and kpc scales, by Appl et al. (app96 (1996)), who reported a misalignment of the jet between both scales. At kpc scales, Murphy et al. (mur93 (1993)) reported a VLA map with a core and a fainter component at 6 arcsec and P.A.°. At pc scales, Eckart et al. (eck87 (1987)) reported a core-jet structure in the VLBI maps, with a faint jet emission oriented at P.A.178∘, and superluminal motion of about 0.12 mas/yr of the jet component between 1979.93 and 1983.25 epochs. Fey & Charlot (fey97 (1997)) published VLBI maps from epoch 1995.20 epoch at 8.4 and 2.3 GHz. Extended emission is detected up to 30 mas (P.A. of 135∘) in their 2.3 GHz maps. In their 8.4 GHz maps, the emission extends 7 mas (P.A.135∘). Pérez-Torres et al. (per00 (2000)) studied this radio source astrometrically referenced to BL 1803+784, and thus our observations constitute a second and third astrometric epochs for the pair QSO 1150+812/BL 1803+784. A comparison of the astrometric results will be published elsewhere.
Our maps (Fig. 11) display a jet oriented southwards, up to 5 mas away from the core component. We model fit the source (Table 2), with 5 components in both cases, up to 4.4 mas south of the radio brightest component XA (P.A. 160°). The source increased its total flux density by less than a 20% from one epoch to the other (Peng et al. pen00 (2000)), and the VLBA flux densities in our images are very similar. The radio source does not present important structural changes between our epochs, and the modelfitted components do not permit to report any significant proper motion.

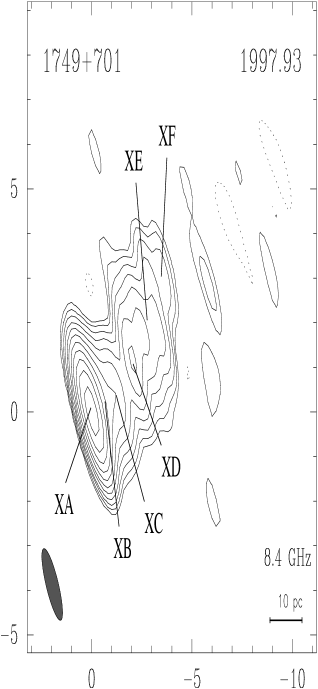
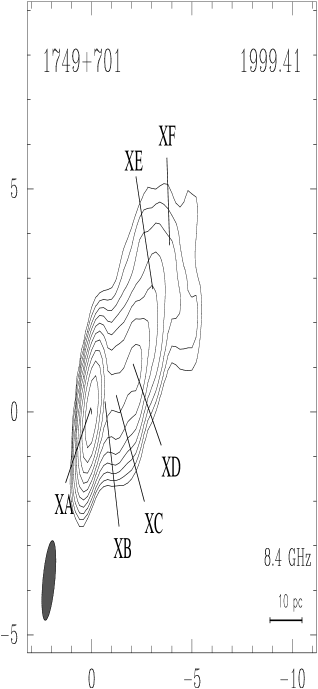
3.10 BL 1749+701
The object BL 1749+701 has =16.5 and =0.770 (Stickel & Kühr sti96 (1996)). VLA images at 5 GHz (Perley per82 (1982)) show a halo of 0.4 arcsec. O’Dea et al. (ode88 (1988)) reported two components at pc-scales at 15 GHz separated by 04 at a P.A. . Kollgaard et al. (kol92 (1992)) did not report extended emission, although they found evidence of emission to the north. VLBI observations from Eckart et al. (eck87 (1987)) show the core, and a component at 2.4 mas and P.A. –45°. Witzel et al. (wit88 (1988)) reported this component to be moving with a rate of 0.1 mas/yr. Bååth & Zhang (baa92 (1992)) reported a more complicated jet structure, with position angle of , and gave a three-component model for maps from 1980 to 1983. They found a maximum component motion of 0.18 mas/yr. Gabuzda et al. (gab92 (1992)) reported new results from epoch 1987, and give a 4-component model, at separations of 0.84, 1.93, and 3.41 mas of the core component (P.A. of , , and , respectively). These authors claimed that the radio source has an unusually low degree of polarization for BL Lacertae objects, and also questioned some of the proper motions reported above.
Our maps (Fig. 12) show a complex jet structure oriented to the northwest, and extended up to 7 mas from the core. We identify in our images more components than the reported by (Bååth & Zhang baa92 (1992)). We observe about the same structure for the two epochs ever being the beam perpendicular to the jet direction in the first epoch, and (unfortunately) more aligned to it for the second one. A Gaussian model of the visibilities (see Table 2) includes a compact, central component (XA), and 5 components, XB to XF, stretching up 5 mas from XA, and describing a slightly curved trajectory northwards. This source offers interesting prospects of study since not only the proper motions reported earlier will be unambiguously checked, but also the astrometry will provide insight of the nature of the XA component, and the possible effects of opacity.
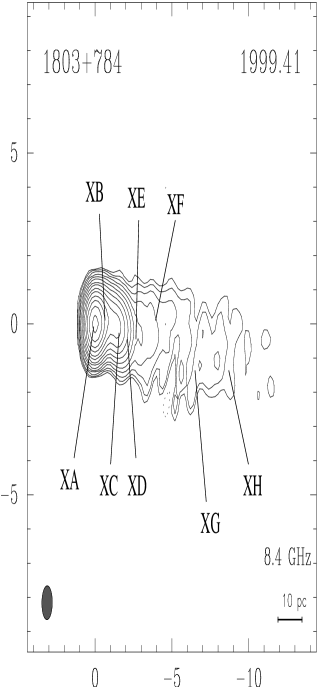
3.11 BL 1803+784
The object BL 1803+784 has =16.4 and =0.864 (Stickel & Kühr sti96 (1996)). It has been extensively studied in the past at different radio wavelengths. At kpc scales, the maps reveal components south of the core at 2, 37, and 45 arcsec (Antonucci et al. ant86 (1986), Strom & Biermann str91 (1991), Murphy et al. mur93 (1993)). Eckart et al. (eck87 (1987)) and Pearson & Readhead (pea88 (1988)) reported a core-jet structure at pc scales with a jet oriented westwards. Schalinski (sch90 (1990)) suggests the stationarity of a component at 1.2 mas of the core. Krichbaum et al. (kri93 (1993), kri94 (1994)) with 43 GHz observations reported the existence of some traveling components between the core and such component, now estimated to be at 1.4 mas separation. Steffen (ste94 (1994)) modeled the radio source as an homogeneous plasma jet of helical trajectory in adiabatic expansion. Fey et al. (fey96 (1996)) reported VLBA results at 8.5 and 2.3 GHz. At 8.5 GHz, the radio source displays a 12 mas jet. At 2.3 GHz, the radio source shows a jet up to 40 mas with P.A.. At this distance, the jet turns northwards, reaching the extended emission a P.A. up to . This radio source has been studied astrometrically by Ros et al. (ros99 (1999)) with reference to QSO 1928+738/BL 2007+777, and by Pérez-Torres et al. (per00 (2000)) with reference to QSO 1150+812.
Our maps (Fig. 13) show similar features to those obtained by Fey et al. (fey96 (1996)). The component at 1.2–1.4 mas of the strong core is present, as it has been for all VLBI observations during the last 20 years. A model fitting of the visibilities with 8 elliptical Gaussian components (Table 2) reproduces the structure of the radio source. The inner region has three main components: XA (with 1.5 Jy, the “core”), XB (at 0.5–0.6 mas with P.A. of °), corresponding to the component reported by Krichbaum et al. kri93 (1993)), and XC (1.2 mas, P.A. °). Those three components represent 95% of the flux density of the source. Further components range from 2 to 9 mas from XA. The jet bends to the south at 5 mas of the main feature. At lower frequencies, the source has more extended emission at P.A. °. Such extended emission is also present in our maps, though not shown in Fig. 13. We find no evidence for bona fide proper motions of the components from our two observing epochs.

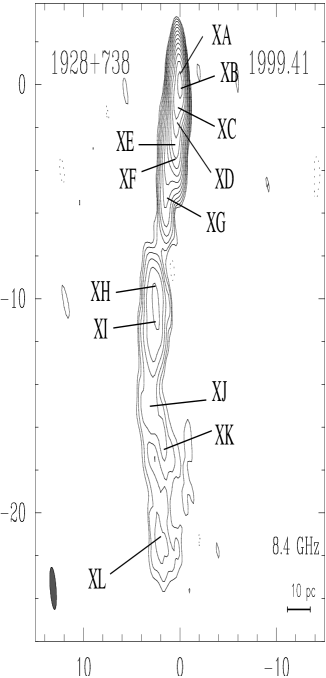
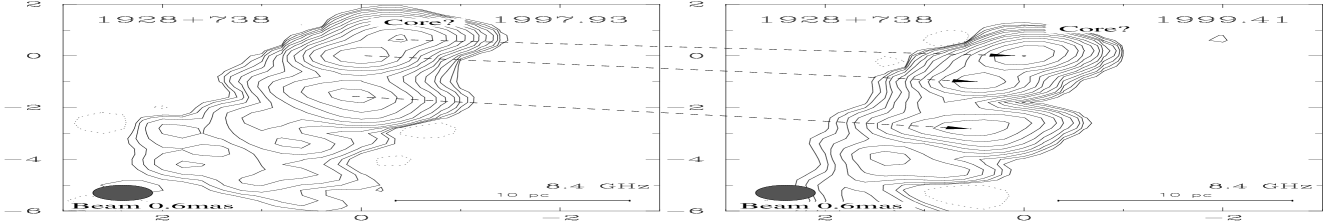
3.12 QSO 1928+738 (4C 73.18)
QSO 1928+738 has =15.5 and =0.3021 (Roos et al. roo93 (1993)), and displays superluminal motion in a jet oriented westwards. It is the best known and most extensively studied radio source of the complete S5 polar cap sample. At kpc scales, it displays extended emission in the north-south direction, with two lobes separated 40 arcsec (P.A.0°) (Rusk & Rusk rus86 (1986)). Johnston et al. (joh87 (1987)) and Murphy et al. (mur93 (1993)) detected emission up to 80 arcsec from the core. Based on kpc-scale images, Hummel et al. (1992a ) modeled the radio source as an object with a helical magnetic field attached to a rotating accretion disk. Eckart et al. (eck85 (1985)) reported a self-absorbed core and a pc-scale jet 17 mas long, whose components display superluminal motion. Roos et al. (roo93 (1993)) modeled the radio source as a binary black hole. Guirado et al. (gui95a (1995, 1998)) detected a shift in the peak of brightness between different epochs, based on an astrometric analysis. Ros et al. (ros99 (1999)) confirmed the results of Guirado et al., and also studied the proper motions of QSO 1928+738 by aligning astrometrically maps of 1985 and 1991.
Our maps (Fig. 14) show very elliptical synthesized beams, which nevertheless allow to distinguish perfectly different features of its pc-scale. The flux density of QSO 1928+738 at 8.4 GHz has not changed much from the first to the second epoch. Hummel et al. 1992a reported that the core of this radio source ejects a new component every 1.6 yr (approximately the time elapsed between our two observing epochs). If we convolve the cleaned components with a 0.6 mas circular beam (Fig. 15), structural changes are evident between the two epochs. The component XA (north of the brightest one in 1997.93), has 0.8 Jy, and XB (the brightest in 1997.93), has 1.3 Jy. In 1999.41 they have 0.9 and 0.6 Jy, respectively. Previous astrometric results (Guirado et al. gui98 (1998), Ros et al. ros99 (1999)) show that most likely none of those components corresponds to the true “core”, which should be northwards of them (shown as a question mark in Fig. 15) and whose radiation is probably very self-absorbed. If we take as reference component XB (Table 2), the rest of the components extend southwards in P.A. 165° to 4–8 mas distance and in 175° to 15–20 mas. Though we could try to identify the components seen in 1991.88 by Ros et al. (ros99 (1999)) with those reported for our first epoch (7.1 years later), such an attempt would be, at least, adventurous. Indeed, for an emergence rate of one component every 1.6 years, QSO 1928+738 should have emerged 4 or 5 components, making completely ambiguous any component identification. The comparison of these components with results from previous epochs by us and by other authors will be presented elsewhere.

3.13 BL 2007+777
The object BL 2007+777 has =16.5 and =0.342 (Stickel & Kühr sti96 (1996)). This radio source has been studied with different techniques and at different frequencies in the last 20 years. Its kpc scale has been studied, e.g., by Antonucci et al. (ant86 (1986)), Kollgaard et al. (kol92 (1992)), and Murphy et al. (mur93 (1993)). Those authors presented maps with compact emission, and extended components at 8.5 and 15.8 arcsec to the west, and another extended component at 11 arcsec to the east, of the brightest compact component. At pc scales, the radio source is also bright. All VLBI maps (Eckart et al. eck87 (1987), Pearson & Readhead pea88 (1988), Guirado et al. gui95a (1995), Xu et al. xu95 (1993), Fey & Charlot fey97 (1997), Guirado et al. gui98 (1998), Ros et al. ros99 (1999)) show emission west of the main component with the brightest features about 5–6 mas of the core, and emission extending out to 20 mas at 5 GHz for epoch 1992.47 (Xu et al. xu95 (1993)) and out to 40 mas at 2.3 GHz for epoch 1995.77 (Fey & Charlot fey97 (1997)). BL 2007+777 displays strong flux variability. Data from UMRAO at 8 GHz show that the source changed the total flux density from 0.8 Jy at 1996.5 to 1.8 Jy at 1997.2. Throughout 1997 the source maintained a total flux density of 1.7 Jy at 8.4 GHz, decreasing to 1.4 Jy for our second epoch in mid 1999.

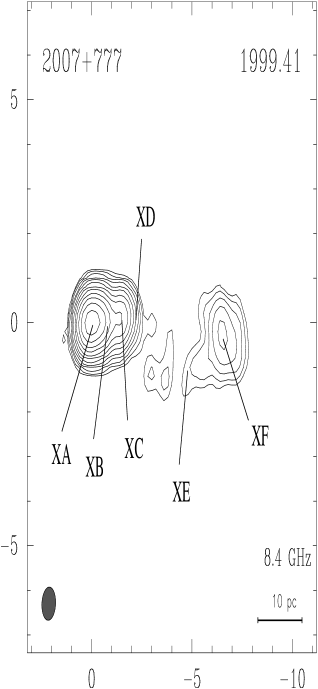
Our maps (Fig. 16) recover flux densities of 1.305 and 0.969 Jy for the first and second epochs, respectively. Changes in the structure are evident. A secondary component about 2 mas (labeled XC+XD in Fig. 16) west of the brightest feature (XA) appears at a different P.A., having moved northwards from the first to the second epoch. This is confirmed by the 5 GHz VLBI Space Orbiting Programme data from epochs close to ours (Krichbaum et al. 2000). A model fit with Gaussian components (Table 2) shows two components for the 2 mas feature, XC and XD, that change the P.A. from ° and ° in the first epoch to °and °, respectively. Their distances from the brightest feature change from 1.2 and 1.6 mas to 1.4 and 1.7 mas, respectively. Assuming that component XA is stationary, these position changes correspond to northward superluminal motion (not only from the core outwards). The core area is double, with XA with similar flux densities in both epochs, and XB decaying to a 30% of its previous flux densities in 1999.41. Guirado et al. (gui00 (2000)) report a changing double structure in this core area at 43 GHz, which questions any registration of this region without astrometric information.
There are also structural changes in the components labeled XE and XF. While XE decays strongly in emission, XF becomes more prominent (it doubles its flux density from the first to the second epoch). This is consistent with space VLBI observations from Krichbaum et al. (2000), which report changes in the blobs of BL 2007+777 within a month in the region 6–7 mas from the “core”. The forthcoming exact alignment of the features provided by the astrometry should constrain the proper motions of the components of the jet of this radio source.
4 Summary
We present 8.4 GHz VLBA maps of the thirteen extragalactic radio sources from the S5 polar cap sample. For two epochs, all sources of the sample have been imaged (Figs. 2-16) with mas-resolution to the mJy level (Table 1). In all cases, we have modeled the interferometric visibilities with elliptical Gaussian models (Table 2).
We can report some morphological changes for selected radio sources. The sources with more evident variations are QSO 0016+731, QSO 0836+710, QSO 1928+738 and BL 2007+777. For QSO 0016+731 the variations have been surprising, since the source is rather compact and does not show a prominent jet structure larger than 2–3 mas at 8.4 GHz. Its change in morphology is associated to the strong decrease in flux density of one of the components from the first to the second epoch. QSO 0836+710 and QSO 1928+738 show the familiar changes in structure produced by emerging components in a core-jet system, as reported by Otterbein et al. (ott98 (1998)) for the former and Hummel et al. (1992a ) for the latter. The BL Lac object 2007+777 displays an interesting, and hard to explain change in position angle towards north for components near to the core, fact also reported by Krichbaum et al. (kri00 (2000)) from 5 GHz VSOP observations.
The images are the result of first and second epochs of a phase-delay astrometric program intended to check the absolute kinematics of all radio sources of the sample with precisions better than 100 as. Such accurate results will be obtained after the mapping and astrometric reduction of more observing epochs is carried out. This multi-source astrometric approach provides a large number of constraints for all the relative source pairs, which allow a precise registration of the maps through the observing epochs (as shown by Ros et al. (ros99 (1999)) for triplets of radio sources).
We have recently extended our astrometric programme to 15 and 43 GHz. At these frequencies, and based on test observations, we expect to attain astrometric precisions of 50 and 20 as, respectively. The two-fold and five-fold improved resolution of those observations with respect to the observations presented here, combined with the expected astrometric precisions, will allow precise registrations of all the sources at each and all wavelengths for all epochs and will provide unprecedented spectral information of components of milliarcsecond sources. The determination of the detailed kinematics and spectral content of the compact components of a complete sample of radio sources should then turn out to be a decisive element in our understanding of the activity around the cores of these compact radio sources and in a definitive test of the standard jet model.
Acknowledgements.
This work has been partially financed by Grant PB96-0782 of the Spanish DGICYT. This research has made use of data from the University of Michigan Radio Astronomy Observatory which is supported by the National Science Foundation and by funds from the University of Michigan. NRAO is operated under license by Associated Universities Inc., under cooperative agreement with NSF.References
- (1) Antonucci, R. R. J., Hickson, P., Olszewski, E. W., Miller, J. S. 1986, AJ, 92, 1
- (2) Appl, S., Sol, H., Vicente, L. 1996, A&A, 310, 419
- (3) Bååth, L. B., Zhang, F. J. 1992, A&A, 262, 1
- (4) Bartel, N., Herring, T. A., Ratner, M. I., Shapiro, I. I., Corey, B. E. 1986, Nat, 319, 733
- (5) Blandford, R. D., Königl, A. 1979, ApJ, 232, 34
- (6) Charlot, P., 1990, AJ, 99, 1309
- (7) Eckart, A., Witzel, A., Biermann, P. et al. 1985, ApJ, 296, 23
- (8) Eckart, A., Witzel, A., Biermann, P., et al. 1986, A&A, 182, 17
- (9) Eckart, A., Witzel, A., Biermann, P., et al. 1987, A&AS, 67, 121
- (10) Fey, A., Charlot, P. 1997, AJS, 111, 95
- (11) Fey, A., Clegg, A. W., Fomalont, E. B. 1996, AJS, 105, 299
- (12) Gabuzda, D. C., Cawthorne, T. V., Roberts, D. H., Wardle, J. F. C. 1992, AJ, 388, 40
- (13) Guirado, J. C., Marcaide, J. M., Elósegui, P., et al. 1995, A&A, 293, 613
- (14) Guirado, J. C., Marcaide, J. M., Alberdi, A., et al. 1995, AJ, 110, 2586
- (15) Guirado, J. C., Marcaide, J. M., Ros, E., et al. 1998, A&A, 336, 385
- (16) Guirado, J. C., Marcaide, J. M., Pérez-Torres, M. A., Ros, E. 2000, A&A, 353, L37
- (17) Hummel, C. A., Schalinski, C. J., Krichbaum, T. P., Witzel, A., Johnston, K. J. 1988, A&A, 204, 68
- (18) Hummel, C. A., Schalinski, C. J., Krichbaum, T. P., et al. 1992a, A&A, 257, 489
- (19) Hummel, C. A., Muxlow, T. W. B., Krichbaum, T. P., et al. 1992b, A&A, 266, 93
- (20) Hummel, C. A., Krichbaum, T. P., Witzel, A., et al. 1997, A&A, 324, 857
- (21) Johnston, K. J., Simon, R. S., Eckart, A., et al. 1987, ApJ, 313, 85
- (22) Kollgaard, R. I., Wardle, J. F. C., Roberts, D. H., Gabuzda, D. C. 1992, AJ, 104, 1687
- (23) Krichbaum, T. P., Jin, C., Kraus, A., Witzel, A., Zensus, J. A. 2000. Observations of Intraday Variable Sources. In Astrophysical Phenomena Revealed by Space VLBI, ed. H. Hirabayashi, P. G. Edwards, & Murphy D. W. (Sagamihara, Japan: ISAS), 133
- (24) Krichbaum, T. P., Hummel, C. A., Quirrenbach, A., et al. 1990, A&A, 230, 271
- (25) Krichbaum, T. P., Witzel, A., Graham, D. A., Schalinski, C. J., Zensus, J. A. 1993. New Results from VLBI at 43 GHz. In Sub-arcsecond Radio Astronomy, ed. R. J. Davis, & R. S. Booth, (Melbourne: Cambridge University Press), 181
- (26) Krichbaum, T.P., Witzel, A., Standke, K.J., et al. 1994. mm-VLBI: Bending of Jets in the Vicinity of AGN. In Compact Extragalactic Radio sources, ed. J. A. Zensus & K. I. Kellermann (Green Bank, WV: NRAO), 39
- (27) Kühr, H., Witzel, A., Pauliny-Toth, I. I. K., Nauber, U. 1981, A&AS, 45, 367
- (28) Marcaide, J. M., Shapiro, I. I. 1983, AJ, 88, 1133
- (29) Marcaide, J. M., Elósegui, P., Shapiro, I. I. 1994, AJ, 108, 368
- (30) Murphy, D. W., Browne, I. W. A., Perley, R. A. 1993, MNRAS, 264, 298
- (31) O’Dea, C. P., Barvainis, R., Challis P. M. 1988, AJ, 96, 435
- (32) Otterbein, K., Krichbaum, T. P., Kraus, A., et al. 1998, A&A, 334, 489
- (33) Pearson, T. J. 1991, BAAS, 23, 991
- (34) Pearson, T. J., Readhead, A. C. S. 1988, AJ, 328, 114
- (35) Peng, B., Kraus, A., Krichbaum, T. P., Witzel, A. 2000, A&AS, 145, 1
- (36) Pérez-Torres, M. A., Marcaide, J. M., Guirado, J. C., et al. 2000, A&A, 360, 161
- (37) Perley R. A. 1982, AJ, 87, 859
- (38) Perley, R. A. 1980, AJ, 85, 649
- (39) Quirrenbach, A., Witzel, A., Wagner, S., et al. 1991, ApJ, 372, 71
- (40) Roos, N., Kaastra, J. S., Hummel, C. J. 1993, ApJ, 280, 542
- (41) Ros, E., Marcaide, J. M., Guirado, J. C., et al. 1999, A&A, 348, 381
- (42) Ros, E., Marcaide, J. M., Guirado, J. C., Sardón, E, Shapiro, I. I. 2000, A&A, 356, 357
- (43) Rusk, R., Rusk, A. C. M. 1986, Canadian Journal of Physics, 64, 440
- (44) Russell, J. L., Johnston, K. J., Ma, C., Shaffer, D., de Vegt, C. 1991, AJ, 101, 2266
- (45) Schalinski, C. J. 1990, Dissertation, Untersuchungen der Zentralregionen aktiver Galaxienkerne, Friedrich-Wilhelms-Universität zu Bonn, Germany
- (46) Shapiro, I. I., Wittels, J. J., Counselman, C. C., et al. 1979, AJ, 84, 1459
- (47) Shepherd, M. C., Pearson, T. J., Taylor, G. B. 1994, BAAS, 26, 987
- (48) Steffen, W., 1994, Dissertation, Helikale Strukturen in aktiven Galaxienkernen, Friedrichs-Wilhelms-Universität zu Bonn, Germany
- (49) Stickel, M., Kühr, H. 1996, A&AS, 115, 1
- (50) Strom, R. G., Biermann, P. L. 1991, A&A, 242, 313
- (51) Wagner, S. J., Witzel, A., Heidt, J., et al. 1996, AJ, 111, 2187
- (52) Witzel, A., Schalinski, C.J., Johnston, K. J., et al. 1988, A&A, 206, 245
- (53) Xu, W., Readhead, A. C. S., Pearson, T. J., Polatidis, A. G., Wilkinson, P. N. 1995, ApJSS, 99, 297