1]Max-Planck-Institut für Kernphysik Heidelberg, Postfach 103980, 69029 Heidelberg, Germany
M. Döring
(Michael.Doering@mpi-hd.mpg.de)
Measurement of the Cherenkov light spectrum and of the polarization with the HEGRA-IACT-system
Abstract
The HEGRA system of Imaging Atmospheric Cherenkov Telescopes (IACTs) detects Cherenkov light produced by air showers. The concept of stereoscopic observation with the five HEGRA telescopes allows the reconstruction of various shower parameters, for example the shower direction, the location of the shower core and the energy of cosmic rays. One of the telescopes was modified so that measurements of the spectrum and the polarization of Cherenkov light with the HEGRA system were possible. The experimental setup is described and preliminary results presented.
1 Introduction
Imaging atmospheric Cherenkov telescopes (IACTs) have emerged as the prime instruments to detect cosmic gamma rays in the TeV energy range. A key area of current research with IACTs are the precision measurements of energy spectra of AGNs, the study of cutoffs in the spectra (see, e.g. Kohnle 2001), and their interpretation in terms of interactions with infrared/optical background fields. For these investigations an absolute energy calibration is important, but lacking a “calibration beam”, this can only be done in indirect ways, highly depending on Monte Carlo simulations. The detected Cherenkov light yield from cosmic-ray induced air showers combines Cherenkov emission by the shower particles, the atmospheric extinction, the mirror reflectivity and photon detector efficiencies. With the significant uncertainties involved in the modeling, there is a clear need to test all aspects of the simulations to ensure reliability. Some properties, such as the distribution of IACT image shapes, have been studied extensively. The radial distribution of Cherenkov light in gamma-induced showers was measured by HEGRA [(Aharonian et al. 1999)]. In this work, we discuss measurements of two other key characteristics of Cherenkov light: its spectrum and its polarization. The measurements were performed with the HEGRA system of IACTs [(Daum et al. 1997)] . Four of the five telescopes were used to provide a trigger, to select air showers and to define the shower characteristics. The fifth telescope was equipped either with different optical filters or with a polarization filter and served to analyze the characteristics of the Cherenkov light. Since the fifth telescope is not participating in the selection or definition of events, the effect of adding filters or polarizers can be studied in a unbiased way, by comparing the average intensity detected in the image with and without the optical elements.
2 Cherenkov spectrum and polarization
The number of emitted Cherenkov photons per wavelength intervall is proportional to . Wavelength dependent attenuation in the atmosphere leads to the spectrum pictured in Fig.1.

Depending on the exact atmospheric model and the assumptions concerning the distribution of aerosols, in particular the short-wavelength end of the spectrum can vary considerably [(Bernlöhr 1999)]. To obtain the detected spectrum, this spectrum has to be folded with the PMT quantum efficiency, which again shows significant uncertainties and variations between production batches. Cherenkov radiation is naturally 100% linearly polarized. The polarization vector is perpendicular to the Cherenkov cone, pointing away from the particle’s path. Multiple scattering in the shower causes an angular distribution of secondaries relative to the shower axis, resulting in a dilution of the net polarization observed on the ground. One should expect that the degree of polarization exhibits a maximum near the Cherenkov radius of about 120 m, where radiation from the well-collimated upper part of the shower is collected, and decreases both for smaller core distances (for symmetry reasons, light observed on the shower axis has to be unpolarized) and for larger core distances, where heavily scattered particles contribute. Ideas concerning the use of the polarization information in the IACT technique as well as simulations of the polarization properties of Cherenkov light from air showers were presented by Hillas (1996), by Contreras et al. (98), and also by Gokhale et al. (2001). A significant degree of polarization was pointed out, with a peak at for primary gamma rays and core distances from 60 m to 140 m, and for protons in a similar distance range. Experimental results for cosmic rays with primary energies PeV were given by [(Tickoo et al. 1999)]. An average degree of polarization of 40% was reported, with little variation with the distance to the shower core.
3 Measurements
The measurements were realized with the HEGRA Cherenkov telescopes. The
HEGRA system of Imaging Cherenkov Telescopes (IACTs) is located on the
Canarian Island La Palma (at 45’ N, 53 W) at 2200m
a.s.l. It consists of five Cherenkov Telescopes (CT2 - CT6) , four in the
corners of a square with 100 m side length and one central telescope
(CT3). The stereoscopic detection of Cherenkov light produced by
cosmic-ray induced extensive air showers with an IACT system allows the
reconstruction of shower parameters such as the
location of the shower core, the shower direction and the energy of the
primary particle [(Daum et al. 1997)]. Each of the HEGRA telescopes has a
field of view of . The cameras consist of 271
photomultipliers, each with a field of view of
The measurements of the Cherenkov light spectrum were realized by using
optical glas filters. Two different sets of filters were used:
(a) bandpass filters with center wavelengths at 325 nm (80 nm FWHM),
380 nm (120 nm FWHM), 440 nm (100 nm FWHM) and 515 nm (65 nm FWHM),
see Fig.2.
(b) long pass edge filters with cut-off wavelengths at 350 nm, 370 nm, 408 nm,
450 nm and with an average transmission of 80-90% (see Fig.3.).


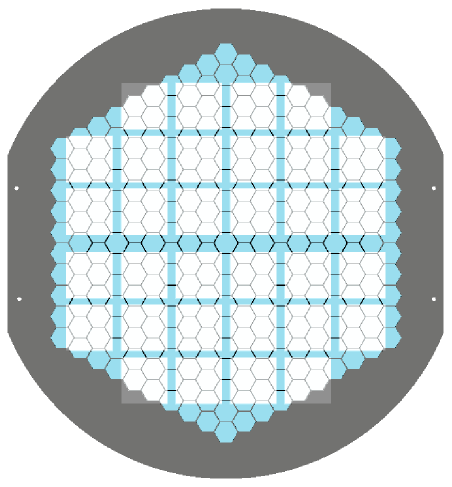
Since filters were only available as squares with 50 mm side length, many filter elements were mounted on an aluminum grid such as to cover the entire active area of the camera of the central telescope CT3. The grid partially obscures some of the camera pixels (see Fig.4.).
The different filters of type (a) or (b) were measured simultaneously by dividing the camera into four quadrants, and using a different filter wavelength in each quadrant. For the study of the spectrum, 14 hours of data were taken, with the telescopes pointing to a dark area of the sky near the zenith (). To test systematics, the filter plate was rotated between sets of measurements, and reference measurements were taken both with the empty filter holder, and with the unobscured camera. For the polarization measurements the linear polarizing filter Schott LP32 was used. Its transmission for light polarized in the filter direction varies between 20% and 75% depending on wavelength as measured in the laboratory; transmission for polarization perpendicular to the filter direction is less than 2% of the transmission in filter direction, for all wavelengths. For the polarization studies 5 h of data were taken, again pointing with the telescopes to the zenith.
4 Data Analysis: Spectrum
Since data were taken for cosmic rays near the zenith, without specifically aiming at a gamma-ray source, all results refer to nucleon showers. For the analysis, events were selected where all 4 of the outer telescope triggered and provide useful images. Based on these images, the shower direction and energy are reconstructed, and a prediction for the center of gravity and image orientation in the central telescope CT3 was derived. In CT3, pixels were then selected within a distance of from the predicted images axis. This cut keeps virtually all pixels illuminated by the air shower. Only those pixels were used in the analysis, which were not obscured by the filter support structure, and which were illuminated through filters of the same quadrant (i.e., of the same wavelength). Hence, only 92 out of 271 pixels were used in the spectrum analysis. Pixel signals were normalized to the reconstructed shower energy. For the current analysis, the light detected in all pixels with filters of a given wavelength was summed up, and the light yield was normalized to the yield without filters. In a future publication, the dependence on the location of a pixel within the image (in the head or tail end of the shower, on or off the shower axis) will be addressed. In Table 1. and Table 2. (preliminary) mean values of the amplitude for each filter are shown, normalized to the yield without filters. The quoted errors are statistical errors. They are compared with calculations, which include the atmospheric extinction, the mirror reflectivity, filter transmission and the wavelength dependent quantum efficiency of the photomultipliers. Here the errors were estimated through combining different aerosol models, namely navy maritime, maritime, and rural as well as slightly different tables for the quantum efficiency of the photomultipliers.
| center | measured | calculated |
| wavelength [nm] | intensity [%] | intensity [%] |
| 325nm | 28.5 0.5 | 28.2 2.9 |
| 380nm | 51.5 0.9 | 50.5 3.0 |
| 440nm | 22.0 0.4 | 19.0 1.0 |
| 515nm | 4.6 0.1 | 3.3 0.2 |
| cut-on | measured | calculated |
| wavelength [nm] | intensity [%] | intensity [%] |
| 350nm | 53.4 1.5 | 54.0 3.0 |
| 370nm | 51.7 1.5 | 53.7 3.1 |
| 408nm | 36.6 1.0 | 34.2 2.3 |
| 450nm | 20.1 0.6 | 18.2 1.5 |
5 Data Analysis: Polarization
The basic analysis procedure resembles the one for the spectral analysis; to determine the degree of polarization, the summed light yield of all image pixels is normalized to the shower energy, and is plotted as a function of the angle between the image of the shower axis and the transmission direction of the polarizer (note that the image of the shower axis points to the shower core). To study the dependence of the polarization on the distance between central telescope and shower core position, the distance was divided into intervals of 20 m, from 10 m to 170 m. Fig.5. shows the mean of the energy normalized amplitude as a function of for 50 m 70 m. For angles of and polarization axis of the filter and main axis of the ellipse are parallel. The degree of polarization is calculated as
| (1) |
where and are the maximum and minimum amplitudes, determined by fitting the -depedence with . The resulting polarization p(r) = b/a is shown in Fig.6. It shows the expected linear rise for core distances below 100 m, and decreases for core distances larger than 130 m.


6 Conclusion
The stereoscopic observation of hadron induced air showers allows the
measurement of the Cherenkov light spectrum and its polarization.
The first results of the spectrum measurements are in good agreement
with calculations, taking into account the atmospheric extinction, mirror
reflectivity, quantum efficiencies of the photomultipliers and
filter transmissions.
First results of the polarization analysis show the expected
dependance on the distance to the shower core.
A more detailed analysis is in progress.
Acknowledgements.
The support of the HEGRA experiment by the German Ministry for Research and Technology BMBF and by the Spanish Research Council CYCIT is acknowledged. We are greatful to the Instituto de Astrofisica de Canarias for the use of the site and for providing excellent working conditions. We thank the other members of the HEGRA CT group, who participated in the construction, installation, and operation of the telescopes. We gratefully acknowledge the technical support staff of Heidelberg, Kiel, Munich, and Yerevan.References
- [(Aharonian et al. 1999)] Aharonian,F.A. et al., 1999, Astrop. Phys. 10, 21
- [(Bernlöhr 1999)] Bernlöhr,K.,1999, Astrop. Phys. 12, 255
- [(Contreras 1998)] J.L. Contreras, I. de la Calle, J. Cortina, Proc. 16th European Cosmic Ray Symp., Alcala de Henares, 1998; I. de la Calle et al., Astropart. Phys., in press
- [(Daum et al. 1997)] Daum,A. et al., 1997, Astrop. Phys. 8,1
- [(Gokhale et al. 2001)] Gokhale,V.N. et al., 2001, High Energy Gamma-Ray Astronomy, International Symposium Heidelberg Germany 2000
- [] Hillas, A.M., 1996, Sp. Sci. Rev. 75, 17
- [(Kohnle 2001)] Kohnle,A., 2001, these proceedings
- [(Tickoo et al. 1999)] Tickoo,A.K. et al., 1999, Proc. 26th Int. Cosmic Ray Conf.