Chandra X-ray Sources in M101
Abstract
A deep (98.2 ks) Chandra Cycle-1 observation has revealed a wealth of discrete X-ray sources as well as diffuse emission in the nearby face-on spiral galaxy M101. From this rich dataset we have created a catalog of the 110 sources from the S3 chip detected with a significance of . This detection threshold corresponds to a flux of ergs cm-2 s-1 and a luminosity of ergs s-1 for a distance to M101 of 7.2 Mpc. The sources display a distinct correlation with the spiral arms of M101 and include a variety of X-ray binaries, supersoft sources, supernova remnants, and other objects of which only are likely to be background sources. There are only a few sources in the interarm regions, and most of these have X-ray colors consistent with that of background AGNs. The derived relation for the sources in M101 (background subtracted) has a slope of over the range of ergs s-1. The nucleus is resolved into 2 nearly identical X-ray sources, each with a 0.5 – 2.0 keV flux of ergs s-1. One of these sources coincides with the optical nucleus, and the other coincides with a cluster of stars 110 pc to the south. The field includes 54 optically identified SNR, of which 12 are detected by Chandra. Two of the SNR sources are variable and hence must be compact objects. In total, 8 of the X-ray sources show evidence for short term temporal variation during this observation. Two of these variable sources are now brighter than the ROSAT detection threshold, but they were not detected in the previous ROSAT observations taken in 1992 and 1996. There are also 2 variable sources previously seen with ROSAT that apparently have faded below the Chandra detection threshold. The brightest source in the field shows extreme long-term and short-term temporal variability. At it’s peak brightness it has a super-Eddington luminosity ergs s-1. There are 10 Supersoft sources (SSS) in the field which can be divided into 2 distinct subclasses: the brighter class (3 objects) has a luminosity of ergs s-1 and a blackbody temperature of eV whereas the other class (7 objects) is an order of magnitude fainter and has a blackbody temperature of only eV.
1 Introduction
M101 is a nearby (7.2 Mpc, Stetson et al. (1998)), face-on spiral galaxy that is ideal for studies of the X-ray source population in a galaxy similar to the Milky Way. Since M101 is viewed through a relatively small amount of obscuring foreground Galactic hydrogen gas ( cm-2, Stark et al. (1992)), it is especially well suited for surveying soft X-ray sources, without the observational biases introduced by the thick absorption in the Galactic plane when studying X-ray sources in our own Galaxy. Although M101 has a slightly later morphological type (Scd vs. Sbc) and a significantly larger D25 isophotal diameter (60 kpc vs. 23 kpc) than the Milky Way (de Vaucouleurs and Pence, 1978; de Vaucouleurs et al., 1991), one would expect that the properties of the X-ray source populations in these 2 galaxies should be quite similar.
M101 was previously observed with the Einstein X-ray observatory (McCammon and Sanders, 1984; Trinchieri et al., 1990), and later with ROSAT to study both the discrete sources (Wang et al., 1999) and the diffuse X-ray emission (Snowden and Pietsch, 1995). M101 was an obvious candidate for follow up studies with the Chandra X-ray observatory, and this paper presents the basic data and analysis of the population of discrete X-ray sources detected in a Cycle-1 Chandra observation. This paper is one in a series which analyze various aspects of this rich dataset. A previous paper (Snowden et al., 2001) reinvestigated some of the hypernova remnant candidates in M101, and 2 other papers currently in preparation will study the brighter black hole X-ray binary candidates in more detail and analyze the diffuse X-ray emission in M101.
2 Data Processing
The present data set consists of a 98.2 ks exposure taken on 26–27 March 2000 with the Chandra observatory ACIS imaging spectrometer with the nucleus of M101 centered near the “aim point” of the S3 CCD chip. The analysis in this paper is limited to the sources detected within the 84 x 84 (17.6 x 17.6 kpc) field of view of the S3 chip which has much better angular resolution and extended sensitivity to lower X-ray energies than the other chips. This chip covers the central region of M101 out to a minimum distance of 6.3 kpc from the nucleus towards the NW, and a maximum distance of 14.9 kpc at the east corner of the chip. By comparison, the prominent spiral arms extend out to about 14 kpc, and the isophotal radius (de Vaucouleurs et al., 1991) is 30.2 kpc, so the S3 chip covers about 50% and 11%, respectively, of these circular areas in M101.
The standard CIAO pipeline software system (“Rev 2” as of December 2000) was used to clean and calibrate the data set. In addition to the standard data cleaning, we also excluded the data during a 64 s interval of unusually high background count rate which reduced the exposure duration to 98180 s. Finally, we excluded all photon events which had a nominal pulse invariant (PI) channel energy greater than 8.0 keV where the S3 chip has virtually no sensitivity. The nominal lower energy cutoff in the data set is 0.125 keV.
3 Source Detection
The CIAO celldetect111 At the time that we received the Chandra data files the celldetect program appeared to produce the most reliable list of sources. Later, after the release CIAO v2.1, we repeated the source detection procedure using the wavdetect program, but concluded that the final list of sources presented in Table 1 would not change significantly. The analysis in §4 was based on the results from wavdetect. program was initially used with a threshold of to generate a preliminary candidate list of X-ray sources in the 0.125 – 8.0 keV band image. At this low threshold setting about 20% of the sources were clearly spurious, mainly located in the wings of brighter sources near the edges of the chip. These spurious sources were rejected by inspecting their positions on an adaptively smoothed image of the S3 chip field of view constructed from all the X-ray events in which sources with as few as 10 net counts are clearly visible. The final adopted set of sources have formal signal to noise ratios close to 3.0 or higher. Note that the detection threshold for faint point sources increases with distance from the “aim point” because of the decreased angular resolution, and as a result the faintest point sources (with ergs cm-2 s-1) are detectable only within a radius of about 2′ = 4 kpc from the nucleus of M101.
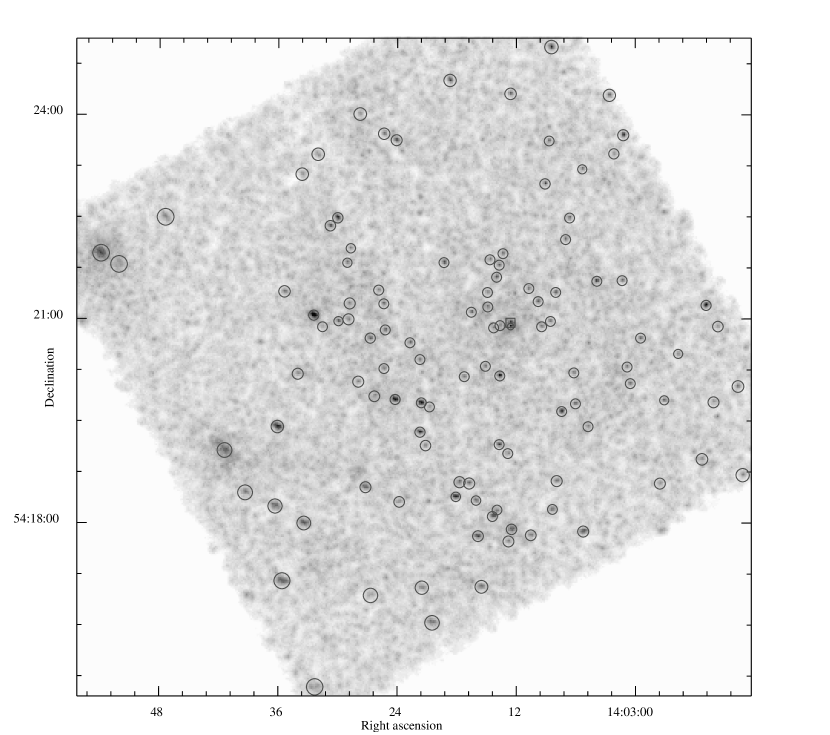
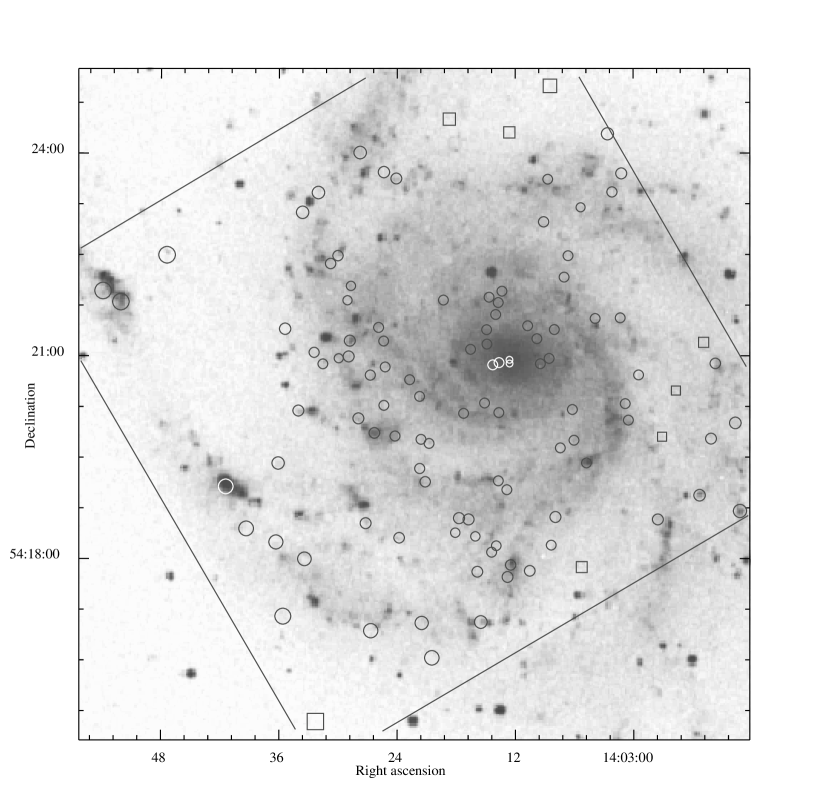
The positions of our final 110 Chandra X-ray sources in M101 are shown in Figures 1 and 2, and listed in Table 1. The source positions derived from the Chandra data are generally accurate to better than 1″. The mean difference between our X-ray positions and the astrometric optical positions of 12 previously identified supernovae remnants catalogued by Matonick and Fesen (1997) is only 047 020, about the size of one ACIS CCD pixel.
As can be seen in Figure 2, the X-ray sources are strongly correlated with the position of the optical spiral arms and bright HII regions in M101. There are relatively few X-ray sources in the interarm regions which indicates that most of the X-ray sources are associated with the young stellar population in M101. To quantify this association, we divided the area covered by the S3 chip into either “spiral arm” or “interarm” regions based on the appearance in the blue optical photograph of M101, with the result that 75% of the area of the chip was classified as covering spiral arm regions (also includes the nuclear region) and 25% as covering interarm regions. Using this spatial criteria, only 8 of the X-ray sources (sources 5, 7, 8, 19, 29, 39, 64, and 97) were found to be located in the interarm regions and not associated with optical emission in M101. This gives a mean surface density of 1.9 sources arcmin-2 in the spiral arms compared with only 0.45 sources arcmin-2 in the interarm regions (both before background subtraction).
We calculated the expected number of background sources in our field based on the point source luminosity function determined from a similar Chandra observation of a blank field by Mushotzky et al. (2000), the HI column density map of M101 by Kamphuis (1993), and the Hartmann and Burton (1997) measure of the Galactic HI column. Given that the Chandra response is rather hard and that the AGN spectra are also hard, the diminution of the surface density of AGNs due to the HI absorption in M101 is rather small, only about 8%. From this we estimate that about 27 of the detected sources, only a quarter of our total sample, are likely to be serendipitous background (or perhaps in a few cases, foreground) sources. Based on the above division of the chip area into “spiral arm” and “interarm” regions, about 20 of these background sources should appear to be located in the spiral arm and nuclear regions. This corresponds to a mean background surface density of 0.38 sources arcmin-2 which is remarkably close to the measured density of sources in the “interarm” regions of 0.45 sources arcmin-2. This suggests that most of these interarm sources are background AGNs, and indeed, 6 of the 8 interarm sources do have relatively hard SR1 and HR1 colors (see §6 and Fig. 6) which are consistent with the expected power law spectrum of an AGN. Furthermore, the brightest of these sources (#5) was previously identified as an AGN by Wang et al. (1999). The other 2 sources located in the interarm regions (#7 and #8) have very soft spectra and thus are more likely to be physically associated with M101. Source #8 in fact is one of the Supersoft sources discussed in §9.
4 The log N–log S Relation
To create a relation for the point sources towards M101 that would be more easily comparable to relations derived for other galaxies, we applied somewhat more restrictive criteria than for the catalogue of sources. We chose all sources where the effective exposure was greater than 75% of the maximum and having a significance greater than 4.5 in the 0.5-2.0 keV energy band (the M2 band defined in §6), where the source counts were measured within the elliptical PSF region containing 75% of the encircled energy, and the background was measured from an annular region 2 to 4 times the size of the 95% encircled energy ellipse. The source rates were corrected for vignetting. (This choice of energy range balances the need to detect the most numerous types of objects in M101, which are soft, with the desire to detect hard objects as well.) The object catalogue was binned into bins, and each bin was divided by the number of square arcminutes over which such a flux could have been detected.222The point source detection limit is spatially variable, as both the size of the PSF and the background rate vary. Although the variation of the size of the PSF dominates, since some point sources are embedded in diffuse emission, the background rate can be significant in determining the point source detection limit. Both effects, as well as the effect of the vignetting, were included in this analysis. The relation is shown in Figure 3 along with the relation due to background AGN seen through the disk of M101 (as calculated from the relation of Mushotzky et al. (2000)). A flux conversion factor equivalent to ergs cm-2 s-1 = counts s-1, which is appropriate for a background AGN with a power-law X-ray spectrum, was used in these calculations. The resulting relation for the sources not due to the background AGN is nearly linear with . Excluding the 8 interarm sources identified in the previous section from the analysis only makes a slight difference, resulting in a slope of . The uncertainty of the slope was calculated following the Lampton et al. (1976) criteria, and is larger than the bootstrap uncertainty () or the variation produced by changing the flux range of the fit (). The relatively flat slope derived here implies that the amount of diffuse emission due to unresolved faint point sources will be small.
Figure 4 shows the surface density of point sources as a function of radius from the nucleus. The optical bulge of M101 is visible out to (Okamura et al., 1976), and we do indeed see an increase in the point source surface density in the bulge region. Because the total number of sources within the bulge region is small () it is difficult to determine whether the “bulge sources” follow a different relation than the “disk sources”. However, to within the uncertainties, we do not observe a difference in the shapes of the relations between bulge () and disk sources ().
The above analysis could be repeated for the 2.0–8.0 keV band using the 2-10 keV band AGN luminosity function found by Mushotzky et al. (2000), but in this energy range only of the objects detected with are not background AGN. The slope of the relation is quite uncertain (, where the quoted uncertainty is no more than a formal uncertainty); to within the uncertainties, the 2.0–8.0 keV band is consistent with the 0.5–2.0 band.
That the slope of our 0.5–2.0 keV luminosity function does not agree with that of Wang et al. (1999) () is hardly surprising; the HRI data was over an order of magnitude less sensitive, many of the sources detected are actually composed of several point sources, and some of the brighter sources are embedded in diffuse emission that would have fallen within the HRI PSF. Further, the Wang et al. (1999) luminosity function was formed over a much larger area (a radius of compared to our ) and thus may be composed of a different population of sources.
5 Source Identification
About 1/4 of the Chandra X-ray sources can be cross-identified with previously observed X-ray sources or are positionally coincident with other catalogued objects as listed in Table 2. The previous ROSAT HRI and PSPC observations of M101 (Wang et al., 1999) detected 19 sources within our field of view, and all but 3 of these are detected in the Chandra observation. A 20th source (their source H42) is just visible on the edge of the field, but it is too highly distorted and affected by the edge of the detector to be included in our final list of sources. Of the 3 non-detected sources, 2 of them were classified as variable by Wang et al. (1999) (their sources H28 and H31) so they may have been in a low flux state during our observation. The other non-detected object (their H41 source) is located near the East corner of the S3 chip, where our detection threshold is relatively high.
The nuclear source seen in the ROSAT HRI image (source H23), is resolved into 2 nearly identical point sources in the Chandra image. The northern component (source #40) appears to coincide with the nucleus at , ′565 but is otherwise unremarkable compared to the other X-ray sources in the field. The other nuclear component is 31 ( pc) to the south and coincides with a loose cluster of bright stars as seen in an HST WFPC-I optical image (after applying a ″ offset to the nominal HST coordinates to co-align the nucleus in both images). The nuclear X-ray source is slightly brighter than the southern component (they are ranked 9th and 12th in relative X-ray count rate in Table 1), and has a slightly softer spectrum, although both sources have fairly neutral X-ray hardness ratios.
Matonick and Fesen (1997) identified 54 optical SNRs within the Chandra field of view and 9 of these were detected in the X-ray band and listed in Table 2. Another 3 SNR sources (their SNR numbers 24, 32, and 43) are faintly visible on the adaptively smoothed Chandra image, but the detections were not significant enough to be included in our final list of 110 sources. All 9 of the X-ray detected SNRs sources have soft X-ray spectra, as would be expected from a hot plasma. The 2 brightest SNR sources (our #85 and #104) were variable during the Chandra observation, so in at least these cases the X-ray flux must be coming from a compact source and not from from the extended SNR itself. In a companion paper (Snowden et al., 2001) we present a more detailed investigation into the properties of several of these SNRs.
To complete the Table 2 list of cross identifications, 2 of the 5 giant HII regions in M101 (Williams and Chu, 1995) are located near the edge of the S3 chip (source #107 is NGC 5461 and source #110 is NGC 5462). The supernova SN1951H was located about SE of NGC 5462 (Israel et al., 1975), but it is not detected in the Chandra observation. Finally, 7 of the Chandra sources are coincident with near-IR objects in the 2MASS catalog and 2 of these are also cross identified with sources in the HST Guide Star Catalog (one being the nucleus, the other being NGC 5458, a bright HII region).
About 10% of globular clusters in our Galaxy and other nearby galaxies contain X-ray emitting neutron stars, so a population of globular clusters might account for some of the X-ray sources in M101. The only published list of globular type clusters in M101 (Bresolin et al., 1996) contains 41 visually identified clusters within one relatively small (2′ square) HST WFPC II observation. It turns out, however, that most of these clusters are very blue and hence presumably young, like those observed in the Magellanic Clouds. Out of the 14 X-ray sources in this same region of M101, only one of them (source #80, one of the Supersoft sources discussed in §9) is located within 2″ of any of the optical clusters, which has a % probability of occurring by chance.
6 X-ray Colors
The X-ray events located within a circular region around each of the 110 X-ray sources were used to calculate the count rate within standard energy bands and to generate spectra and light curves for each source. The radius of the region was chosen as a function of the distance of the source from the optical axis so as to enclose % of the source flux as predicted from the model PSFs and verified by numerical experiments on the brightest sources. The area of each source region is given by the “Area” column in Table 1, in units of the 049 Chandra CCD pixels.
Since most of the sources are too faint for detailed spectral analysis, we have characterized the general spectral properties of the sources by using the ratios of the X-ray count rates in 2 sets of soft, medium, and hard energy X-ray bands. The energy ranges for the first set of bands (S1, M1, and H1) were selected to produce roughly equal count rates in each band for the typical sample of sources seen in M101. For the second set of bands (S2, M2, and H2) a more standard set of astrophysically relevant energy ranges were used to facilitate the comparison of our results with those from previous X-ray missions. The adopted energy range for each of these bands is given in Table 3 along with the observed mean background flux level in each band. (The slight variation in background level and diffuse emission across the field is not significant for these purposes). The net counts, after background subtraction, for each source in each of these 6 bands is listed in Table 1. A pair of soft and hard X-ray flux ratios (or X-ray colors) were then calculated from the net counts in the three bands, where SR1 = (M1 - S1) / (S1 + M1), HR1 = (H1 - M1) / (M1 + H1), and similarly for the SR2 and HR2 ratios. In principle, the measured colors will depend on the position of the source in the field because the sensitivity of the ACIS instrument (i.e., the effective area of the telescope) decreases with distance from the aimpoint at slightly different rates depending on the energy band. This effect is small over the area covered by the S1 chip, however, and would cause the apparent X-ray colors to shift by only about 0.01 as the source is moved from the aim point to the far corner of the chip.
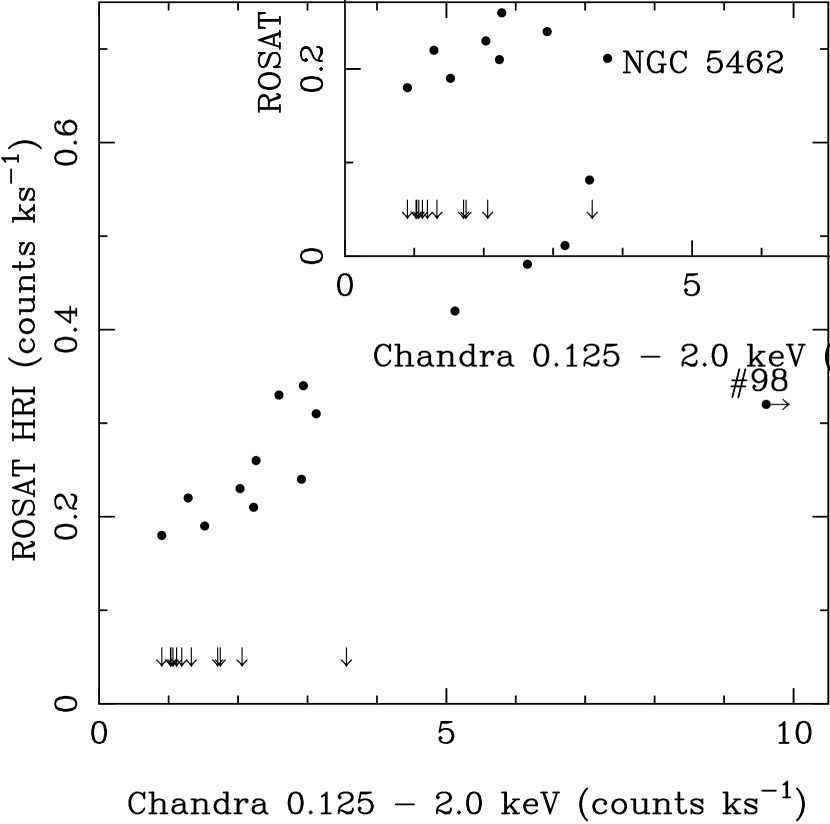
We compared the Chandra 0.125-2.0 keV (S2 + M2 band) count rates with the ROSAT HRI count rates as measured by Wang et al. (1999). Figure 5 shows that there is a very good correlation between the HRI and Chandra count rates for 15 of the 16 sources in common, which indicates that they have not varied significantly between the epochs of the observations (80% of the HRI data were obtained in 1996 and 20% in 1992). The one very discrepant point is source #98 which is highly variable (see §7) and is now about 25 times brighter in mean flux level than during the ROSAT observations. It has been plotted at 1/10 of its actual meanChandra count rate in order to fit onto the scale of Figure 5. The other bright source in Figure 5 (NGC 5462) has a slightly higher ROSAT count rate than would be predicted by the relation defined by the other points, but the comparison is complicated because the higher resolution Chandra image shows that it is a blend of several sources. Also shown at the bottom of Figure 5 are the Chandra count rates for 11 sources which were not detected in the ROSAT observations. The brightest 2 of these sources (#93 and #71) were variable during the Chandra observation (and hence could have been in a low state during the HRI observations), and the other sources are close to the ROSAT detection threshold, so it is not particularly surprising that these sources were not previously detected the ROSAT data.
The SR1 and HR1 X-ray colors provide a sensitive discriminator between sources with different types of X-ray spectra as shown in Figure 6. (Note that the SR2 and HR2 colors are less useful for this purpose because most of the flux lies in the M2 band and hence most of the points end up crowded into the lower right quadrant of the HR2 vs. SR2 diagram). The 45 brightest sources, which have more than 40 net X-ray counts, have been plotted with their calculated error bars. The fainter sources have been omitted for clarity. Any points which have a SR1 or HR1 value lying outside the physically allowed range of -1 to +1 (due to uncertain background subtraction) have been plotted at the limiting value. It can be seen that most of the points in Figure 6 lie within a broad diagonal band ranging from the softest sources in the lower left to the hardest sources in the upper right.
The calculated SR1 and HR1 flux ratios for several model X-ray source distributions are also plotted in Figure 6. The upper 3 curves show models with power law flux distributions with photon index slopes of 1.5, 2.0, and 4.0 respectively, and the 2 lower curves show blackbody models with temperatures of kT = 0.1 and 0.2 keV. In each case the lines connect the calculated SR1 and HR1 values for 4 hydrogen column densities of, from left to right, , , , and atoms cm-2. These models show that the SR1 color is most sensitive to the parameter such that the more heavily obscured sources lie towards the right hand side of the figure. The HR1 color, on the other hand, is a better indicator of the intrinsic shape of the spectral flux distribution such that the flatter spectrum sources lie towards the top of the figure.
The representative models that are plotted in Figure 6, while not unique, provide an indication of the physical nature of the objects that lie in different areas of the color – color diagram. The very soft sources in the lower left corner form a distinct subpopulation which are discussed further in §9. The expected population of obscured background AGNs seen through the disk of M101 will generally have power law spectra with photon index slope in the range and total HI columns . There are more than enough sources within this range of Figure 6 to account for the expected number of AGNs in the field and the remainder are likely to be low mass X-ray binaries in M101 itself. The 6 AGN candidates located in the interarm regions of M101, previously discussed in §3, fall within this region of the figure (although one of them, source #39, lies quite close to the 4.0 slope limit) and are plotted with open triangles. The sources below the = 4.0 powerlaw model line are inconsistent with the spectrum of a typical AGN and are therefore more likely to be physically associated with M101.
7 Temporal Variability
Out of the 37 brightest sources which have more than 60 net counts, 4 of them (sources 85, 93, 98, and 104) showed definite intensity variability during the Chandra observation ( probability of being a constant source based on the Kolmogorov-Smirnov test), and 4 others (sources 51, 66, 71, and 108) are probably variable (with probabilities ranging from 0.01 – 0.06 of being a constant source). The flux curves for these sources are shown in Figure 7. Two of these variable sources (#93 and #71) are now brighter than the ROSAT detection threshold, but they were not detected in the previous ROSAT observations taken in 1992 and 1996. In addition to these 8 variable sources, there were also 2 variable sources previously observed with ROSAT (sources H28 and H31) which apparently have now faded below the Chandra detection limit.
Object #98 is currently the brightest and also the most dramatically variable source in M101. It has increased by about a factor of 25 in mean flux level from when it was previously observed by ROSAT and the count rate varied by more than a factor of 6 during the Chandra observation alone.
8 X-ray Models and Fluxes
The 29 brightest sources have enough flux ( counts) to perform at least crude spectral modeling using the HEASARC XSPEC (Arnaud, 1996) model fitting program. Most of the sources could be satisfactorily fit with a simple absorbed power law spectrum model, however 8 of the softest sources were better fit by an absorbed blackbody model. Table 4 lists the best fitting model parameters for these 29 sources. Also tabulated are the apparent X-ray fluxes calculated by integrating the model spectrum over the energy range of the S2 (0.125 – 0.5 keV), M2 (0.5 – 2.0 keV), and H2 (2.0 – 8.0 keV) energy bands as well as the intrinsic X-ray luminosity of the source in each of the 3 bands, correcting for the model absorption and assuming a distance of 7.2 Mpc to M101. In general the models provided a satisfactory fit to the observed spectra, as shown by the reduced values given in the table. The main exception to this is the brightest variable source #98 whose integrated spectrum could not be well fit by any simple model. The X-ray flux from this source is generally very soft, but the spectrum changes significantly with the flux level. As a consequence, the flux and luminosity values given for this object are only representative of its true nature. This unusual object will be studied in more detail in a separate paper, but it is already apparent that this is a super-Eddington source with an maximum instantaneous luminosity in the range of to ergs s-1
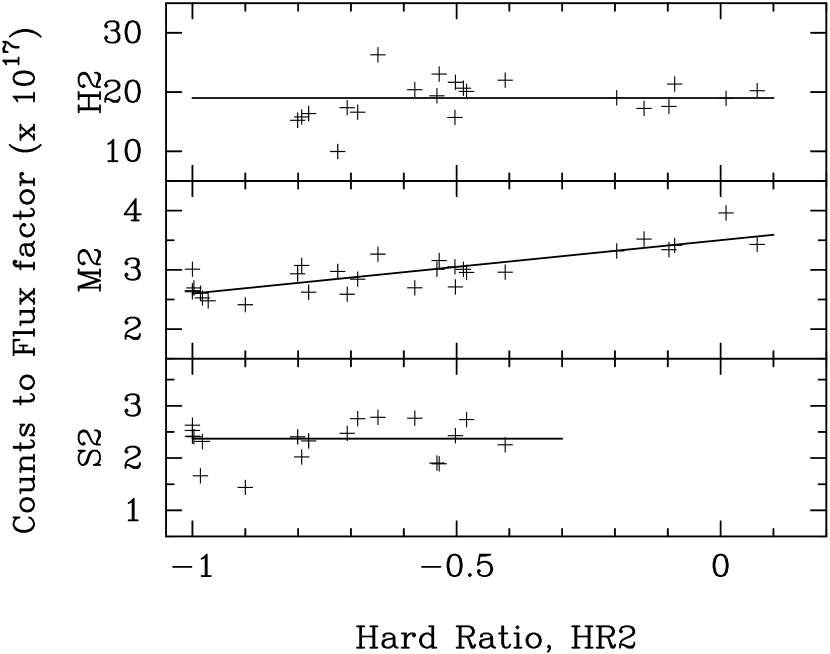
The ratio between the total net X-ray counts and the model X-ray flux in the S2, M2, and H2 bands for the 29 brightest sources was used to derive a mean counts-to-flux conversion factor which could be applied to the fainter sources to estimate their fluxes. Figure 8 shows the flux-per-count ratio plotted as a function of the hardness ratio, HR2, for each source. The adopted multiplication factors, which convert from total net counts in our 98.2 ks exposure into units of ergs cm-2 s-1 are
and
where the M2 band conversion factor has a slight dependence on the hardness ratio of the source. These conversion factors were used to compute the X-ray flux values given in Table 1 for all the sources. Note that all the X-ray flux and luminosity values (but not the net counts values) quoted in this paper have been corrected for several instrumental effects. Every flux and luminosity value has been multiplied by a nominal factor of 1.02 (or 1.05 in the case of the slightly smaller apertures that were used for the 2 nuclear sources) to correct for the flux that was excluded by the circular integration apertures. In addition, 6 of the sources needed a % correction factor because they were projected near one of the “warm” columns next to the CCD readout amplifier which were excluded during the initial data cleaning procedure. Finally, 2 of the sources were located near the edge of the chip and required an additional vignetting correction factor because the deliberate wobbling of the telescope pointing axis during the exposure caused the source to periodically move on and off the chip.
Figure 9 shows the distribution of for all 110 sources (using the values from Table 1), and Figure 10 shows the distribution of for the 29 brightest sources from Table 4. Note that it is not possible to reliably compute the luminosity for the fainter sources because the individual values are unknown. Several of the sources, especially in the softest band, appear to have luminosities greater than the Eddington limit of ergs s-1 for a one solar mass object, but the uncertainties in the calculated luminosities are sometimes quite large. The brightest S2 band source, #93, for example, has a high luminosity mainly because the best fitting model has a very steep spectrum and a large hydrogen column density of cm-2 which leads to a large correction factor to the apparent flux. The next most luminous S2 band source is #98 which, as mentioned previously, is highly variable and it’s spectrum is not well fit by simple flux models. It has been plotted at it’s mean Chandra flux level, but it’s instantaneous luminosity has been observed to vary by at least 2 orders of magnitude.
In principle, the observed color dependence of the counts-to-flux conversion factor for the M2 band (Fig. 8) could affect the analysis of the relation in §4. In that analysis we assumed a constant conversion factor between counts and flux, but if the mean X-ray color of the sources changes with count rate (i.e., if the fainter sources are significantly harder or softer in the mean than the brighter sources) then this would cause a systematic difference between the slope of the and the relations. This difference could be important because most observational source population studies have used , whereas most theoretical interpretation is done in terms of .
In order to judge the importance of this effect, we computed the mean HR2 color of sources as a function of count rate, as shown in Figure 11. The fact that there is no significant trend in the figure (the best fitting line has a slope of ) means that our assumption of a constant counts-to-flux conversion factor has not biased the derived slope of the relation.
9 Super Soft Sources
Ten of the Chandra X-ray sources have very soft spectra similar to the Supersoft sources (SSS) that have been seen in other nearby galaxies. These M101 sources can be divided into 2 distinct subclasses: the brighter class consists of 3 sources (13333 The only source detected in M101 in the Einstein IPC ultrasoft survey, at , ′25″(Thompson et al., 1998) may coincide with our source #13. The positions differ by 13, which is about twice the typical error in the Einstein source positions, but is still well within the 3′ integration radius that was used to extract the Einstein source counts. , 45, and 99) and the fainter and softer class consists of 7 sources (8, 16, 30, 72, 80, 96, and 101). The brighter class of SSS have a mean count rate of 2.0 counts ks-1 and have a S2 band (0.125 – 0.5 keV) to M2 band count ratio of 3:1. The fainter class of SSS, on the other hand, are an order of magnitude fainter with a mean flux of 0.26 counts ks-1, and have such a soft spectrum that essentially all the flux is emitted in the S2 band.
The 3 brighter SSS have very similar spectra as demonstrated by the good agreement between the blackbody model fits given in Table 4 for the sources: the best fitting model temperatures range from 60 to 100 eV (equivalent to 0.7 to 1.1 million degrees K) and the hydrogen column densities lie in the range of 1.0 to cm-2, which is consistent with the Galactic column density of cm-2 in the direction of M101 (Stark et al., 1992; Hartmann and Burton, 1997) plus an additional absorption component local to the sources in M101. Because the spectra are so similar, we combined the counts from the 3 sources to obtain the better signal to noise spectrum shown in Figure 12. The best fitting blackbody model to this combined spectrum has a temperature of eV (equivalent to K) and atoms cm-2. Note that the formal errors on the model parameters are unrealistically small, and do not take into account the unknown systematic errors in the calibration of the instrumental response below 0.3 kev. The mean luminosity of these 3 sources over the 0.125 to 2.0 keV band is ergs s-1 with most of this flux emitted below 0.5 keV. None of these 3 sources showed any obvious signs of variability, either during the Chandra exposure or between the epochs of the ROSAT and Chandra observations.
The combined spectrum of the 7 fainter SSS in M101 is shown in Figure 13. In spite of the statistically large uncertainties in the count rates and the large systematic uncertainties in the energy calibration of the Chandra detector at these low energies, it is clear that this fainter class of SSS has a much softer spectrum than the brighter class shown in Figure 12. Since the value is not well constrainted by the model fits, we assumed a conservative value equal to the Galactic column of cm-2. Under this assumption the best fitting blackbody model to the mean spectrum has a temperature of eV and a 0.125 to 2.0 keV luminosity of erg s-1 (85% of this flux is emitted below 0.3 keV). Assuming a larger value decreases the best fitting model temperature only slightly, but it greatly increases the calculated luminosity (by a factor of 7 for = cm-2) because even a small increase in column density produces a large increase in extinction for these soft sources.
The SSS were first detected in other nearby galaxies by Einstein (Long et al., 1981), and later studied more extensively with ROSAT (Trumpler et al., 1991; Greiner et al., 1991). Supper et al. (1997) classified 3.8% (15 out of 396) of the ROSAT PSPC sources in M31 as being Supersoft sources, This is not necessarily inconsistent with the higher rate of SSS we found in M101 (9%), however, because the higher Galactic absorption towards M31 ( cm-2) compared to M101 will absorb much of the soft flux from these sources. For this same reason, the SSS are difficult to detect in our Galaxy if they are more than kpc away in the plane of the disk. Clearly, it will be of great interest to see how the properties of the SSS population vary between different types of galaxies as more data from the Chandra and XMM observatories become available in the near future.
While the diversity of observed properties argues against lumping all SSS into a single class of object, the generally accepted model for the classical SSS is that they are white dwarf stars with steady nuclear burning in their envelopes (Van den Heuvel, et al., 1992). It is thought that high accretion rates ( yr-1) from a low mass secondary onto the white dwarf primary fuels the burning of the hydrogen near the surface of the white dwarf. The predicted luminosities range from ergs s-1 to ergs s-1, with peak energy fluxes in the 30 – 50 eV range, in good agreement with the sources seen in M101. The steep drop in flux above about 0.8 keV seen in Figure 12 is typical of most SSS; recent high signal to noise ASCA observations (Asai et al., 1998) have shown that this break can be explained by an absorption edge feature probably due to O VIII at about 0.87 keV. This and other edges originating from hydrogen-like or helium-like ions of carbon, nitrogen and oxygen would be expected for the emission from a hot white dwarf with a stable hydrogen burning envelope.
The SSS are also related to classical novae (CNe) in that SSS are quasi-steady nuclear burning, whereas CNe are the result of thermonuclear runaways. Indeed, many CNe go through a SSS phase several months after the peak of optical outburst. In one case, the SSS phase lasted for nearly a decade (Shanley et al., 1995). We looked for a similar correlation in M101 by comparing the positions of the 7 known optical novae that occurred within our M101 field between 1994 and 1997 (Shafter et al., 2000) with our X-ray source catalog and with the position of even fainter possible sources seen in the adaptively smoothed X-ray image, but found no matches. Thus, at least none of these novae had a long-lasting, bright, SSS phase after their optical outburst.
10 Conclusions
This paper provides a preview of what the studies of the X-ray source populations in external galaxies will reveal and what they will teach us about the X-ray sources in our own Galaxy. The main result of this paper is the catalog of 110 X-ray sources seen in the Chandra observation of the face-on spiral galaxy M101. The detection threshold is about ergs s-1, but depends on position because of the variable angular resolution of the X-ray telescope across the field of view. Since this flux threshold is several orders of magnitude higher than the level of coronal X-ray emission expected from normal stars, most of these sources must be more exotic objects, including X-ray binaries, supersoft sources (SSS), and supernovae remnants. The field of view of the current observation only covers about 50% of the prominent spiral arms in M101, so a complete census of all the X-ray sources visible with Chandra in M101 at this flux limit could contain twice as many objects.
Only about 1/4 of the sources are estimated to be background AGNs, so most of our sources are physically associated with M101. The bulk of the point sources are related to spiral arms, suggesting that the population of X-ray sources is derived from young objects in regions of active star formation, and thus may be dominated by High-Mass X-ray Binaries. Conversely, spiral arms have higher stellar densities for all stellar types, so there may not be an over-abundance of High-Mass X-ray Binaries. Most of the sources seen in the interarm regions are probably AGNs because their surface density is close to the expected number of background sources, and because the X-ray colors of most of the interarm sources are consistent with that from a power law spectrum usually seen in AGNs.
At a distance of 7.2 Mpc Chandra can provide a luminosity function down to ergs s-1, so measuring the luminosity functions for the nearby galaxies will do much to explore the link between the X-ray source populations and the star-formation history, and will help to interpret the X-ray source luminosity functions being developed for the Milky Way. The derived relation for the sources in M101 is nearly linear with a slope of over the flux range ergs s-1. We observed no difference in the slope of the relations between bulge () and disk sources (), however, there are few sources in the bulge so the uncertainties in the bulge slope are relatively large. Another recently published study similar in scope to the present work is that of Tennant et al. (2001) for the galaxy M81 (NGC 3031) at a distance of 3.63 Mpc (Freedman et al., 1994). M81 is an Sab galaxy with a substantially larger bulge than M101. For the 0.2–8.0 keV band Tennant et al. (2001) find the of the disk sources to have a slope of -0.50 over the flux range ergs s-1, somewhat flatter than our relation. Given the difference in energy range, as well as possible differences in the slope of the AGN luminosity functions used, the two values are consistent with each other. At a limiting flux of ergs s-1, however, the surface density of X-ray sources is nearly four times greater for M81 (0.2 kpc-2) than for M101 (0.05 kpc-2), presumably reflecting the differences in the star formation rate between the two galaxies.
Eight of the brighter sources show evidence for short term temporal variation over the 98.2 ks period of our observation, and 2 other sources previously observed with ROSAT are no longer visible with Chandra. The brightest Chandra source is also the most variable source, varying by more than a factor of 6 during the observation. The current mean flux level is about 25 times higher than when previously observed with ROSAT. This source has a soft spectrum which varies significantly with the flux level. Simple spectral models do not provide a very good fit to the spectrum, but it is clear that it has a super-Eddington luminosity which sometimes exceeds ergs s-1. This unusual source will be studied in more detail in a subsequent paper.
The nuclear X-ray source is non-exceptional and looks very much like the other sources in the field. It is not spatially resolved, although there is evidence for enhanced diffuse X-ray emission near the nucleus (to be studied in a separate paper). While this source may well be a weak AGN similar to that detected in most other nearby galaxies (Ho et al., 2001), it could also simply be a typical X-ray binary located in the dense stellar environment close to the nucleus. There is another nearly identical X-ray source just 31 to the south of the nucleus which coincides with a loose cluster of bright stars. A power-law spectral model gives a resonable fit to both the nuclear source and the southern companion, resulting in photon indices of 2.02 and 1.56, and luminosities of ergs s-1 and ergs s-1 in the 0.5 – 2.0 keV band, respectively.
About 9% of the M101 sources have extremely soft spectra similar to the SSS seen in other nearby galaxies. The 10 SSS in M101 can be naturally divided into 2 classes: the 3 brightest SSS have a mean luminosity of ergs s-1 and a model blackbody temperature of eV. The other 7 SSS have an order of magnitude smaller X-ray count rate, most of which is emitted below 300 eV. The model temperature and luminosity of these fainter sources is dependent on the assumed hydrogen column density, but is in the neighborhood of 50 eV and erg s-1 respectively. The observed luminosities and temperatures of both these classes of SSS are within the range predicted by the standard models of a white dwarf star with steady nuclear burning in its envelope fueled by accretion from a low mass secondary.
References
- Arnaud (1996) Arnaud, K. A. 1996, in Astronomical Data Analysis Software and Systems V, ASP Conf Ser, Vol. 101, eds. Jacoby G., and Barnes, J., 17
- Asai et al. (1998) Asai, K., Dotani, T., Nagase, F, Ebisawa, K., Mukai, K., Smale, A. P., and Kotani, T. 1998, ApJ, 503, L143
- Bresolin et al. (1996) Bresolin, F., Kennicutt, R. C., Jr., and Stetson, P. B. 1996, AJ, 112, 1009
- de Vaucouleurs et al. (1991) de Vaucouleurs, G., de Vaucouleurs, A., Corwin, H., Jr., Buta, R., Paturel, G., and Fouque, P. 1991, Third Reference Catalogue of Bright Galaxies (Berlin:Springer)
- de Vaucouleurs and Pence (1978) de Vaucouleurs, G. and Pence, W. D. 1978, AJ83, 1163
- Greiner et al. (1991) Greiner, J., Hasinger, G., and Kahabka, P. 1991, A&A, 246, L17
- Freedman et al. (1994) Freedman, W. L., et al. 1994, ApJ, 427, 628
- Hartmann and Burton (1997) Hartmann, D. and Burton, W. B. 1997, Atlas of Galactic Neutral Hydrogen (Cambridge University Press)
- Ho et al. (2001) Ho, L. C., et al. 2001, ApJ, 549, L51
- Israel et al. (1975) Israel, F. P., Goss, W. M., and Allen, R. J. 1975, A&A, 40, 421
- Kamphuis (1993) Kamphuis, J. J. 1993, Ph.D. thesis, Rijksuniversiteit, Groningen
- Lampton et al. (1976) Lampton, M., Margon, B., and Bowyer, S. ApJ, 208, 177
- Long et al. (1981) Long, K. S., Helfand, D. J., and Grabelsky, D. A. 1981, ApJ, 248, 925
- Matonick and Fesen (1997) Matonick, D. M., and Fesen, R. A. 1997, ApJS, 112, 49
- McCammon and Sanders (1984) McCammon, D. and Sander, W. T. 1984, ApJ, 287, 167
- Mushotzky et al. (2000) Mushotzky, R. F., Cowie, L. L., Barger, A. J., and Arnaud, K. A. 2000, Nature, 404, 459
- Okamura et al. (1976) Okamura, S., Kanazawa, T., and Kodaira, K. 1976, PASJ, 28, 329
- Shafter et al. (2000) Shafter, A. W., Ciardullo, R., and Pritchet, C. 2000, ApJ, 530, 193
- Shanley et al. (1995) Shanley, L., Ögelman, H., Gallagher, J. S., Orio, M., and Krautter, J. 1995, ApJ, 438, L95
- Snowden et al. (2001) Snowden, S. L., Mukai, K., Pence, W., and Kuntz, K. D. 2001, AJ, 121, 3000
- Snowden and Pietsch (1995) Snowden, S. L., and Pietsch, W. 1995, ApJ, 452, 627
- Stark et al. (1992) Stark, A. A., et al. 1992, ApJS, 79, 77
- Stetson et al. (1998) Stetson, P. B., et al. 1998, ApJ, 290, 449
- Supper et al. (1997) Supper, R., Hasinger, G., Pietsch, W., Trumper, J., Jain, A., Magnler, E. A., Lewin, W. H. G., and van Paradijs, J. 1997, A&A, 317, 328
- Tennant et al. (2001) Tennant, A. F., Wu, K., Ghosh, K. K., Kolodziejczak, J. J., and Swartz, D. A. 2001, ApJ, 549, L43
- Thompson et al. (1998) Thompson, R. J. Jr, Shelton, R. G., and Arning, C. A. 1998, AJ, 115, 2587
- Trinchieri et al. (1990) Trinchieri, G., Fabbiano, G., and Romaine, S. 1990, ApJ, 356, 110
- Trumpler et al. (1991) Trumpler, J., Hasinger, G., Aschenbach, B., et al., 1991, Nature, 349, 579
- Van den Heuvel, et al. (1992) Van den Heuvel, E. P. J., Bhattacharya, D., Nomoto, K., Rappaport, S. A. 1992, A&A, 262, 97
- Wang et al. (1999) Wang, Q. D., Immler, S., and Pietsch, W. 1999, ApJ, 523, 121
- Williams and Chu (1995) Williams, R., and Chu, Y.-H. 1995, ApJ, 439, 132


| Net | Net | log() | ||||||||||
|---|---|---|---|---|---|---|---|---|---|---|---|---|
| R.A. | Decl. | Area | Counts | Counts | (ergs cm-2 s-1) | |||||||
| S | (J2000) | (J2000) | (pix) | S1 | M1 | H1 | S2 | M2 | H2 | S2 | M2 | H2 |
| 1 | 14 02 49.15 | 54 18 42.1 | 344 | 9 | 5 | 3 | 2 | 18 | -4 | -16.26 | -15.27 | |
| 2 | 14 02 49.61 | 54 20 00.2 | 261 | 6 | 12 | 6 | -4 | 27 | 0 | -15.13 | ||
| 3 | 14 02 51.63 | 54 20 53.1 | 199 | 4 | 3 | 9 | 2 | 8 | 5 | -16.23 | -15.57 | -15.01 |
| 4 | 14 02 52.08 | 54 19 46.3 | 224 | 10 | 5 | -0 | 3 | 11 | 1 | -16.16 | -15.49 | -15.57 |
| 5 | 14 02 52.82 | 54 21 11.8 | 185 | 160 | 164 | 355 | 52 | 441 | 185 | -14.90 | -13.85 | -13.45 |
| 6 | 14 02 53.25 | 54 18 56.1 | 255 | 4 | 10 | 7 | 4 | 15 | 3 | -16.00 | -15.37 | -15.30 |
| 7 | 14 02 55.64 | 54 20 29.0 | 144 | 12 | 1 | 1 | 3 | 9 | 2 | -16.19 | -15.55 | -15.33 |
| 8 | 14 02 57.05 | 54 19 48.1 | 142 | 31 | -1 | -2 | 32 | -3 | -1 | -15.12 | ||
| 9 | 14 02 57.49 | 54 18 34.7 | 223 | -5 | 6 | 14 | -4 | 8 | 11 | -15.49 | -14.64 | |
| 10 | 14 02 59.43 | 54 20 43.0 | 90 | 19 | 12 | 1 | 7 | 25 | 1 | -15.78 | -15.17 | |
| 11 | 14 03 00.47 | 54 20 02.9 | 94 | 24 | 10 | 2 | 9 | 25 | 3 | -15.67 | -15.16 | -15.29 |
| 12 | 14 03 00.79 | 54 20 17.5 | 88 | 19 | 1 | -1 | 12 | 8 | -0 | -15.54 | -15.68 | |
| 13 | 14 03 01.17 | 54 23 42.0 | 229 | 169 | 0 | -4 | 124 | 44 | -3 | -14.52 | -14.93 | |
| 14 | 14 03 01.29 | 54 21 33.7 | 90 | 8 | 10 | 1 | 2 | 18 | -0 | -16.33 | -15.33 | |
| 15 | 14 03 02.12 | 54 23 25.5 | 192 | -4 | 9 | 5 | -1 | 8 | 3 | -15.59 | -15.21 | |
| 16 | 14 03 02.57 | 54 24 17.1 | 280 | 43 | -1 | -3 | 46 | -2 | -4 | -14.82 | ||
| 17 | 14 03 03.84 | 54 21 33.2 | 95 | 5 | 26 | 102 | 3 | 61 | 70 | -16.17 | -14.66 | -13.87 |
| 18 | 14 03 04.73 | 54 19 24.9 | 88 | 7 | 9 | 2 | 4 | 14 | 1 | -16.02 | -15.42 | |
| 19 | 14 03 05.22 | 54 17 52.4 | 221 | 40 | 31 | 55 | 16 | 91 | 19 | -15.41 | -14.57 | -14.43 |
| 20 | 14 03 05.31 | 54 23 11.9 | 143 | 7 | 8 | 0 | -1 | 16 | 0 | -15.35 | ||
| 21 | 14 03 06.00 | 54 19 45.1 | 92 | 4 | 0 | 22 | 2 | 10 | 15 | -16.34 | -15.44 | -14.55 |
| 22 | 14 03 06.16 | 54 20 12.3 | 94 | 1 | 1 | 12 | 2 | 2 | 11 | -16.35 | -16.15 | -14.69 |
| 23 | 14 03 06.59 | 54 22 28.9 | 91 | 4 | 7 | 15 | 4 | 14 | 9 | -16.02 | -15.34 | -14.77 |
| 24 | 14 03 06.99 | 54 22 09.9 | 95 | 1 | 1 | 25 | -1 | 13 | 16 | -15.33 | -14.52 | |
| 25 | 14 03 07.39 | 54 19 38.3 | 95 | 9 | 62 | 230 | 2 | 163 | 137 | -16.36 | -14.25 | -13.58 |
| 26 | 14 03 07.89 | 54 18 36.9 | 137 | 12 | 9 | 17 | 7 | 24 | 8 | -15.78 | -15.14 | -14.84 |
| 27 | 14 03 07.99 | 54 21 23.3 | 93 | 28 | 9 | -1 | 15 | 23 | -1 | -15.42 | -15.19 | |
| 28 | 14 03 08.32 | 54 18 12.0 | 170 | 4 | 2 | 38 | 3 | 6 | 35 | -16.13 | -15.61 | -14.17 |
| 29 | 14 03 08.42 | 54 24 59.7 | 359 | 18 | 51 | 100 | 9 | 119 | 41 | -15.67 | -14.43 | -14.10 |
| 30 | 14 03 08.52 | 54 20 57.7 | 95 | 29 | 0 | -0 | 27 | 2 | 1 | -15.19 | -16.29 | |
| 31 | 14 03 08.65 | 54 23 36.8 | 168 | 18 | 3 | 1 | 12 | 10 | -0 | -15.53 | -15.59 | |
| 32 | 14 03 09.07 | 54 22 59.0 | 104 | 3 | 6 | 20 | 1 | 21 | 7 | -15.17 | -14.85 | |
| 33 | 14 03 09.41 | 54 20 53.0 | 92 | 4 | 11 | 8 | 4 | 15 | 5 | -16.03 | -15.34 | -15.04 |
| 34 | 14 03 09.76 | 54 21 15.2 | 95 | 11 | 11 | 35 | 5 | 38 | 15 | -15.93 | -14.92 | -14.55 |
| 35 | 14 03 10.50 | 54 17 49.1 | 209 | 6 | 6 | 16 | 3 | 15 | 10 | -16.09 | -15.28 | -14.70 |
| 36 | 14 03 10.70 | 54 21 26.7 | 94 | 15 | 3 | -0 | 5 | 14 | -0 | -15.93 | -15.44 | |
| 37 | 14 03 12.44 | 54 17 54.3 | 198 | 82 | 31 | 16 | 27 | 96 | 5 | -15.18 | -14.58 | -15.01 |
| 38 | 14 03 12.54 | 54 20 53.2 | 60 | 95 | 83 | 119 | 38 | 204 | 54 | -15.03 | -14.19 | -13.97 |
| 39 | 14 03 12.55 | 54 24 18.4 | 250 | 8 | 18 | 14 | 4 | 31 | 6 | -15.99 | -15.04 | -14.96 |
| 40 | 14 03 12.55 | 54 20 56.5 | 60 | 143 | 95 | 76 | 68 | 208 | 38 | -14.77 | -14.20 | -14.12 |
| 41 | 14 03 12.75 | 54 17 43.7 | 222 | 7 | 3 | 6 | 2 | 15 | -1 | -16.34 | -15.39 | |
| 42 | 14 03 12.82 | 54 19 01.2 | 88 | 12 | 3 | 0 | 6 | 9 | 1 | -15.84 | -15.61 | |
| 43 | 14 03 13.31 | 54 21 57.5 | 93 | 26 | 4 | 1 | 13 | 17 | 2 | -15.51 | -15.33 | -15.49 |
| 44 | 14 03 13.61 | 54 20 54.0 | 88 | 7 | 3 | 8 | 2 | 12 | 5 | -16.32 | -15.43 | -15.03 |
| 45 | 14 03 13.63 | 54 20 09.6 | 94 | 216 | 2 | -2 | 170 | 48 | -1 | -14.39 | -14.90 | |
| 46 | 14 03 13.69 | 54 21 47.3 | 95 | 5 | 1 | 30 | 2 | 12 | 23 | -16.36 | -15.35 | -14.36 |
| 47 | 14 03 13.69 | 54 19 09.1 | 93 | 32 | 62 | 22 | 3 | 112 | 2 | -16.16 | -14.52 | -15.49 |
| 48 | 14 03 13.90 | 54 18 11.4 | 165 | 23 | 14 | 1 | 11 | 26 | 1 | -15.57 | -15.15 | |
| 49 | 14 03 13.95 | 54 21 36.7 | 88 | 24 | 19 | 21 | 12 | 46 | 7 | -15.54 | -14.88 | -14.88 |
| 50 | 14 03 14.25 | 54 20 52.0 | 93 | 8 | 5 | 2 | 1 | 12 | 3 | -15.46 | -15.29 | |
| 51 | 14 03 14.37 | 54 18 05.7 | 180 | 63 | 47 | 58 | 21 | 126 | 22 | -15.30 | -14.44 | -14.38 |
| 52 | 14 03 14.62 | 54 21 52.1 | 92 | 14 | 7 | -1 | 8 | 13 | -0 | -15.72 | -15.47 | |
| 53 | 14 03 14.84 | 54 21 10.5 | 92 | 13 | 7 | 6 | 3 | 20 | 4 | -16.16 | -15.24 | -15.15 |
| 54 | 14 03 14.87 | 54 21 23.2 | 94 | 2 | 7 | 5 | -0 | 14 | 1 | -15.43 | ||
| 55 | 14 03 15.08 | 54 20 18.1 | 94 | 19 | 1 | 1 | 7 | 14 | 1 | -15.78 | -15.43 | |
| 56 | 14 03 15.47 | 54 17 03.7 | 320 | 39 | 26 | 4 | 9 | 60 | 0 | -15.68 | -14.80 | |
| 57 | 14 03 15.82 | 54 17 48.4 | 219 | 6 | 30 | 146 | -1 | 101 | 83 | -14.46 | -13.80 | |
| 58 | 14 03 16.02 | 54 18 19.8 | 158 | 14 | 25 | 11 | 0 | 46 | 3 | -14.89 | -15.23 | |
| 59 | 14 03 16.50 | 54 21 05.8 | 94 | 12 | 2 | 14 | 6 | 13 | 10 | -15.85 | -15.36 | -14.73 |
| 60 | 14 03 16.71 | 54 18 34.8 | 133 | 17 | 9 | 7 | 8 | 23 | 3 | -15.72 | -15.19 | -15.29 |
| 61 | 14 03 17.21 | 54 20 09.0 | 94 | 15 | 1 | 4 | 7 | 9 | 5 | -15.78 | -15.55 | -15.05 |
| 62 | 14 03 17.68 | 54 18 35.9 | 138 | 4 | 5 | 47 | 1 | 21 | 35 | -15.11 | -14.18 | |
| 63 | 14 03 18.06 | 54 18 23.0 | 157 | 105 | 103 | 157 | 40 | 240 | 84 | -15.01 | -14.12 | -13.79 |
| 64 | 14 03 18.66 | 54 24 30.2 | 293 | 15 | 41 | 53 | 1 | 81 | 27 | -16.49 | -14.58 | -14.26 |
| 65 | 14 03 19.26 | 54 21 49.6 | 93 | 16 | 24 | 29 | 7 | 43 | 20 | -15.78 | -14.86 | -14.42 |
| 66 | 14 03 20.44 | 54 16 31.9 | 427 | 0 | 11 | 88 | 2 | 48 | 49 | -16.26 | -14.74 | -14.00 |
| 67 | 14 03 20.72 | 54 19 42.3 | 94 | 6 | 10 | 2 | 1 | 16 | 2 | -15.35 | -15.50 | |
| 68 | 14 03 21.11 | 54 19 08.2 | 110 | 16 | 3 | -1 | 2 | 17 | -1 | -16.22 | -15.34 | |
| 69 | 14 03 21.47 | 54 17 02.9 | 349 | 1 | 10 | 32 | -1 | 22 | 21 | -15.10 | -14.39 | |
| 70 | 14 03 21.54 | 54 19 45.9 | 88 | 174 | 275 | 423 | 40 | 640 | 193 | -15.01 | -13.71 | -13.43 |
| 71 | 14 03 21.67 | 54 19 20.0 | 102 | 70 | 73 | 113 | 25 | 173 | 57 | -15.22 | -14.27 | -13.96 |
| 72 | 14 03 21.68 | 54 20 24.0 | 94 | 21 | -1 | -2 | 20 | 1 | -2 | -15.32 | ||
| 73 | 14 03 22.69 | 54 20 38.9 | 93 | 29 | 8 | 2 | 11 | 28 | 1 | -15.58 | -15.13 | |
| 74 | 14 03 23.76 | 54 18 18.5 | 207 | -0 | -1 | 20 | -1 | 9 | 11 | -15.49 | -14.68 | |
| 75 | 14 03 24.05 | 54 23 37.5 | 227 | 50 | 19 | -1 | 16 | 54 | -2 | -15.42 | -14.84 | |
| 76 | 14 03 24.18 | 54 19 48.9 | 94 | 53 | 228 | 704 | 10 | 584 | 392 | -15.62 | -13.70 | -13.12 |
| 77 | 14 03 25.18 | 54 20 50.2 | 94 | 8 | 11 | 21 | 3 | 27 | 11 | -16.16 | -15.07 | -14.69 |
| 78 | 14 03 25.31 | 54 23 43.2 | 246 | -1 | 5 | 21 | -4 | 14 | 15 | -15.30 | -14.54 | |
| 79 | 14 03 25.31 | 54 20 16.1 | 91 | 3 | 8 | 13 | 3 | 15 | 7 | -16.15 | -15.32 | -14.89 |
| 80 | 14 03 25.33 | 54 21 13.2 | 92 | 29 | 0 | 3 | 28 | 1 | 4 | -15.17 | -15.15 | |
| 81 | 14 03 25.85 | 54 21 25.2 | 98 | 15 | 4 | -1 | 3 | 17 | -1 | -16.18 | -15.36 | |
| 82 | 14 03 26.28 | 54 19 51.6 | 119 | 14 | 5 | -1 | 1 | 17 | 0 | -16.52 | -15.34 | |
| 83 | 14 03 26.64 | 54 16 56.0 | 414 | 18 | 4 | -1 | 8 | 16 | -3 | -15.69 | -15.38 | |
| 84 | 14 03 26.69 | 54 20 42.9 | 102 | 41 | 14 | 5 | 14 | 41 | 4 | -15.48 | -14.93 | -15.07 |
| 85 | 14 03 27.16 | 54 18 31.4 | 223 | 51 | 36 | 24 | 26 | 76 | 9 | -15.20 | -14.66 | -14.74 |
| 86 | 14 03 27.73 | 54 24 00.5 | 308 | 1 | 4 | 11 | -1 | 5 | 11 | -15.68 | -14.66 | |
| 87 | 14 03 27.90 | 54 20 04.5 | 130 | 2 | 2 | 14 | -1 | 11 | 8 | -15.43 | -14.83 | |
| 88 | 14 03 28.66 | 54 22 02.1 | 155 | 8 | 6 | 2 | 1 | 12 | 2 | -16.46 | -15.45 | -15.39 |
| 89 | 14 03 28.77 | 54 21 13.5 | 130 | 15 | 6 | 5 | 5 | 17 | 4 | -15.92 | -15.30 | -15.14 |
| 90 | 14 03 28.89 | 54 20 59.5 | 137 | 12 | 14 | 2 | 5 | 25 | -1 | -15.93 | -15.19 | |
| 91 | 14 03 29.01 | 54 21 49.4 | 152 | 8 | 11 | 2 | -1 | 19 | 3 | -15.25 | -15.21 | |
| 92 | 14 03 29.90 | 54 20 57.9 | 143 | 78 | -0 | 0 | 46 | 32 | 0 | -14.96 | -15.06 | |
| 93 | 14 03 29.98 | 54 22 29.0 | 193 | 38 | 170 | 189 | 3 | 340 | 54 | -16.21 | -14.01 | -13.98 |
| 94 | 14 03 30.73 | 54 22 22.0 | 205 | 0 | 13 | 47 | 1 | 35 | 24 | -16.51 | -14.93 | -14.34 |
| 95 | 14 03 31.51 | 54 20 52.9 | 169 | 6 | 4 | 3 | 5 | 5 | 3 | -15.91 | -15.80 | -15.27 |
| 96 | 14 03 31.97 | 54 23 25.0 | 303 | 21 | 2 | -7 | 19 | 2 | -6 | -15.29 | -16.14 | |
| 97 | 14 03 32.25 | 54 15 35.3 | 736 | 8 | 12 | 30 | 6 | 27 | 18 | -15.83 | -15.05 | -14.47 |
| 98 | 14 03 32.40 | 54 21 03.1 | 187 | 6723 | 2210 | 375 | 2828 | 6417 | 62 | -13.17 | -12.77 | -13.92 |
| 99 | 14 03 33.37 | 54 17 59.8 | 371 | 215 | -1 | -5 | 145 | 69 | -4 | -14.45 | -14.74 | |
| 100 | 14 03 33.58 | 54 23 07.4 | 301 | 3 | -0 | 12 | -2 | 3 | 13 | -15.85 | -14.59 | |
| 101 | 14 03 34.00 | 54 20 11.4 | 227 | 20 | -1 | -1 | 22 | -4 | 0 | -15.28 | ||
| 102 | 14 03 35.35 | 54 21 24.1 | 244 | 4 | 5 | 20 | 2 | 20 | 7 | -16.24 | -15.21 | -14.88 |
| 103 | 14 03 35.56 | 54 17 08.9 | 534 | 67 | 58 | 123 | 23 | 173 | 53 | -15.26 | -14.27 | -13.99 |
| 104 | 14 03 36.05 | 54 19 24.8 | 300 | 303 | 227 | 174 | 117 | 528 | 58 | -14.55 | -13.82 | -13.95 |
| 105 | 14 03 36.27 | 54 18 14.8 | 401 | 8 | 23 | 120 | -0 | 87 | 65 | -14.52 | -13.90 | |
| 106 | 14 03 39.29 | 54 18 26.7 | 446 | 14 | 16 | 39 | 7 | 44 | 18 | -15.79 | -14.86 | -14.46 |
| 107 | 14 03 41.37 | 54 19 04.0 | 437 | 140 | 136 | 27 | 23 | 278 | 2 | -15.26 | -14.13 | -15.40 |
| 108 | 14 03 47.36 | 54 22 29.6 | 581 | 23 | 24 | 12 | 8 | 45 | 6 | -15.73 | -14.88 | -14.90 |
| 109 | 14 03 52.05 | 54 21 48.0 | 755 | 54 | 37 | 8 | 23 | 76 | 0 | -15.26 | -14.69 | |
| 110 | 14 03 53.86 | 54 21 57.8 | 756 | 271 | 283 | 223 | 80 | 625 | 72 | -14.72 | -13.75 | -13.86 |
| S | ROSATaaROSAT source ID from Wang et al. (1999) | MFbbSNR ID from Matonick and Fesen (1997) | Other IDs |
|---|---|---|---|
| 5 | H18(AGN) | ||
| 6 | 2MASS | ||
| 11 | MF33 | ||
| 15 | MF34 | ||
| 37 | H22 | NGC5458, 2MASS, GSC | |
| 38 | H23 | S of nucleus | |
| 40 | H23 | Nucleus, 2MASS, GSC | |
| 42 | MF46 | ||
| 43 | MF49 | ||
| 45 | H24 | ||
| 51 | H25 | ||
| 52 | MF50 | ||
| 63 | H26 | ||
| 64 | H27 | ||
| 67 | MF54 | ||
| 70 | H29 | ||
| 76 | H30 | ||
| 81 | MF61 | ||
| 85 | MF65 | ||
| 95 | 2MASS | ||
| 98 | H32(var) | ||
| 99 | H33 | ||
| 103 | H35 | ||
| 104 | H36 | MF83 | |
| 107 | H37 | NGC5461, 2MASS | |
| 108 | 2MASS | ||
| 110 | H40 | NGC5462, 2MASS |
| Band | Low | High | Background |
|---|---|---|---|
| keV | keV | cts pixel-1 | |
| S1 | 0.125 | 0.8 | 0.034 |
| M1 | 0.8 | 1.3 | 0.007 |
| H1 | 1.3 | 8.0 | 0.032 |
| S2 | 0.125 | 0.5 | 0.023 |
| M2 | 0.5 | 2.0 | 0.025 |
| H2 | 2.0 | 8.0 | 0.025 |
| log() | log() | |||||||||
|---|---|---|---|---|---|---|---|---|---|---|
| S | Pow | BB | (ergs cm-2 s-1) | (ergs s-1) | ||||||
| kT | () | S2 | M2 | H2 | S2 | M2 | H2 | |||
| 5 | 1.29 | 0.65 | 1.46 | -14.92 | -13.88 | -13.38 | 37.56 | 37.99 | 38.41 | |
| 13 | 0.10 | 0.10 | 2.06 | -14.50 | -14.87 | -20.06 | 37.48 | 36.95 | 31.74 | |
| 17 | 1.06 | 3.66 | 1.00 | -17.06 | -14.67 | -13.84 | 36.83 | 37.40 | 37.96 | |
| 19 | 1.73 | 0.62 | 1.40 | -15.35 | -14.52 | -14.28 | 37.19 | 37.35 | 37.51 | |
| 25 | 1.51 | 5.97 | 0.75 | -17.19 | -14.25 | -13.53 | 37.70 | 37.99 | 38.29 | |
| 29 | 2.07 | 4.56 | 1.13 | -16.65 | -14.44 | -14.06 | 37.84 | 37.79 | 37.75 | |
| 37 | 0.13 | 1.92 | 1.74 | -15.40 | -14.63 | -17.75 | 37.68 | 37.58 | 34.07 | |
| 38 | 1.56 | 0.35 | 1.30 | -14.97 | -14.25 | -13.95 | 37.32 | 37.58 | 37.85 | |
| 40 | 2.02 | 0.34 | 1.30 | -14.72 | -14.22 | -14.19 | 37.63 | 37.62 | 37.61 | |
| 45 | 0.06 | 0.78 | 1.34 | -14.34 | -14.89 | -23.68 | 38.50 | 37.14 | 28.12 | |
| 47 | 0.15 | 4.96 | 1.39 | -16.35 | -14.55 | -16.67 | 37.95 | 38.04 | 35.20 | |
| 51 | 2.08 | 0.84 | 1.13 | -15.28 | -14.48 | -14.42 | 37.47 | 37.42 | 37.38 | |
| 57 | 2.08 | 10.14 | 0.76 | -18.46 | -14.47 | -13.83 | 38.10 | 38.06 | 38.01 | |
| 63 | 1.44 | 0.39 | 0.58 | -14.95 | -14.14 | -13.76 | 37.36 | 37.70 | 38.03 | |
| 64 | 2.16 | 3.11 | 1.57 | -16.26 | -14.58 | -14.34 | 37.66 | 37.56 | 37.46 | |
| 66 | 2.71 | 19.56 | 1.24 | -21.25 | -14.69 | -14.00 | 38.76 | 38.33 | 37.90 | |
| 70 | 1.88 | 2.02 | 1.54 | -15.11 | -13.71 | -13.42 | 38.24 | 38.31 | 38.38 | |
| 71 | 1.38 | 0.47 | 1.59 | -15.21 | -14.32 | -13.90 | 37.15 | 37.53 | 37.90 | |
| 76 | 1.64 | 4.60 | 1.11 | -16.13 | -13.70 | -13.12 | 38.26 | 38.48 | 38.69 | |
| 85 | 2.31 | 0.54 | 1.14 | -15.21 | -14.69 | -14.80 | 37.37 | 37.18 | 36.99 | |
| 93 | 4.00 | 7.57 | 1.38 | -16.30 | -13.99 | -14.26 | 40.01 | 38.80 | 37.60 | |
| 98 | 0.14 | 0.53 | 4.11 | -13.17 | -12.78 | -15.77 | 39.11 | 39.12 | 36.03 | |
| 99 | 0.08 | 0.63 | 1.81 | -14.44 | -14.73 | -21.32 | 38.11 | 37.24 | 30.48 | |
| 103 | 1.61 | 1.04 | 0.75 | -15.36 | -14.26 | -13.91 | 37.42 | 37.65 | 37.89 | |
| 104 | 2.70 | 1.23 | 1.19 | -14.54 | -13.80 | -14.04 | 38.60 | 38.18 | 37.76 | |
| 105 | 2.21 | 9.74 | 0.73 | -18.31 | -14.51 | -13.94 | 38.15 | 38.02 | 37.90 | |
| 107 | 0.13 | 3.75 | 1.12 | -15.41 | -14.13 | -16.89 | 38.46 | 38.38 | 34.96 | |
| 109 | 0.20 | 0.20 | 0.98 | -15.25 | -14.68 | -16.56 | 36.75 | 37.15 | 35.24 | |
| 110 | 2.90 | 2.27 | 1.39 | -14.79 | -13.71 | -13.93 | 38.96 | 38.42 | 37.87 | |