Multiwavelength Observations of the Low Metallicity Blue Compact Dwarf Galaxy SBS 0335-05211affiliation: Based in part on observations obtained at the W.M. Keck Observatory which is operated as a scientific partnership among the California Institute of Technology, the University of California and the National Aeronautics and Space Administration.
Abstract
New infrared and millimeter observations from Keck, Palomar, ISO, and OVRO and archival data from the NRAO66affiliation: The National Radio Astronomy Observatory is a facility of the National Science Foundation operated under cooperative agreement by Associated Universities, Inc. VLA and IRAS are presented for the low metallicity blue compact dwarf galaxy SBS 0335-052. Mid-infrared imaging shows this young star-forming system is compact (031; 80 pc) at 12.5 m. The large Br equivalent width (235 Å) measured from integral field spectroscopy is indicative of a 5 Myr starburst. The central source appears to be optically thin in emission, containing both a warm ( K) and a hot ( K) dust component, and the overall interstellar radiation field is quite intense, about times the intensity in the solar neighborhood. CO emission is not detected, though the galaxy shows an extremely high global H I gas-to-dust mass ratio, high even for blue compact dwarfs. Finally, the galaxy’s mid-infrared-to-optical and mid-to-near-infrared luminosity ratios are quite high, whereas its far-infrared-to-radio and far-infrared-to-optical flux ratios are surprisingly similar to what is seen in normal star-forming galaxies. The relatively high bolometric infrared-to-radio ratio is more easily understood in the context of such a young system with negligible nonthermal radio continuum emission. These new lines of evidence may outline features common to primordial galaxies found at high redshift.
1 Introduction
The blue compact dwarf galaxy SBS 0335-052 is an extremely metal-poor galaxy (; Izotov et al. 1997), with only I Zw 18 known to have a lower metal abundance. At a radial velocity c km s-1, SBS 0335-052 is at a distance of 53 Mpc for (1″ corresponds to 258 pc). Recent observations have highlighted several interesting characteristics of SBS 0335-052 and its fainter companion 80″ (22 kpc) to the west. In addition to showing very low metallicity, the bright starburst region of SBS 0335-052 is situated in an extensive H I envelope, has an extremely large Br equivalent width, and appears unexpectedly bright in the mid-infrared, with a 12 m-to--band luminosity ratio greater than two (Pustilnik et al. 2001; Vanzi et al. 2000; Thuan, Sauvage & Madden 1999). The last property is particularly intriguing since the galaxy exhibits anemic levels of metals. Moreover, Thuan, Sauvage & Madden found that the mid-infrared spectrum lacks the standard mid-infrared dust emission features, is dominated by a strong continuum, and peaks at a surprisingly short wavelength, suggestive that the radiating dust is embedded in an extremely intense interstellar radiation field. optical observations by Papaderos et al. (1998) indicate an underlying stellar population of mass and an age younger than 100 Myr. Near-infrared data on the handful of bright super star clusters that dominate the galaxy’s optical luminosity suggest that the central star-forming region is even younger, of order 5 Myr (Vanzi et al. 2000).
The unusual mid-infrared properties of SBS 0335-052 merit high spatial resolution studies: is the opacity at mid-infrared wavelengths consistent with mag (Thuan, Sauvage & Madden 1999) or mag (Izotov et al. 1997)? Can the emission source be resolved? What fraction of the mid-infrared light is associated with the brightest star clusters? For example, Soifer et al. (2000) and Soifer et al. (2001) find that nearly all of the luminous and ultraluminous infrared galaxies in their samples emit a substantial fraction () of their mid-infrared luminosity in compact pc-sized cores. Similar information on dwarf galaxies in general, and SBS 0335-052 in particular, does not exist; mid-infrared data from IRAS and ISO have an angular resolution of several to tens of arcseconds, precluding detailed studies of compact mid-infrared emission. In this paper we present diffraction limited mid-infrared imaging using the Keck telescope to investigate the innermost regions of SBS 0335-052. Additional near-infrared integral field spectroscopy, and far-infrared, radio and millimeter data are presented to further constrain the energetics of the interstellar medium.
While the physics of the interstellar medium in low-metallicity dwarf galaxies is interesting in its own right, this relatively nearby system allows us to study in detail a truly young galaxy and thus could be a useful template for understanding galaxy formation at high redshifts. This comparison would be especially relevant if normal galaxies are assembled from a collection of small systems (e.g. van Dokkum et al. 1999; Cole et al. 2000). For example, 25 m observations with of galaxies, some of which may be in their earliest stages of development, may be usefully compared to (similar rest wavelength) mid-infrared observations of SBS 0335-052.
2 Observations and Data Reduction
2.1 Keck Near- and Mid-Infrared Imaging
The mid-infrared observations of SBS 0335-052 were made using the imaging mode of the Long Wavelength Spectrograph (LWS; Jones et al. 1993) at the /25 forward Cassegrain focus of the Keck I Telescope. The object was centered in the LWS field of view by first imaging in -band with the Near-InfraRed Camera (NIRC; Matthews & Soifer 1994), and then offsetting the position of the brightest peak at to the center of the LWS field.
The principal observations were made on the night of 7 December 2000 although observations of variable quality were made on 24 November 1999, 26 January 2000, and 10 September 2000. The December and September runs were photometric. A chopper was set to a north-south chopping amplitude of 5″ at a frequency 5 Hz. The telescope was nodded 5″ in the north-south direction. The data were reduced by differencing the two images obtained within the chop pairs at each nod location, and then coadding the resulting positive images. Because of the chopper and telescope nod spacings employed for the observations, the flux outside a 5″ diameter region is suppressed. The pixel scale is 008 pixel-1 for the mid-infrared data and 015 pixel-1 for the near-infrared data. No flat-field corrections were performed.
Photometric data were obtained at 12.5 m ( m). The photometry was calibrated based on observations of the bright stars HR 1457 ( Tau; [12.5 µm] mag) and HR 8775 ( Peg; [12.5 µm] mag) whose magnitudes, in turn, were based on IRAS photometry and previous Keck mid-infrared photometry. The systematic uncertainties in the photometry, based on the internal consistency of the observations, is estimated to be 5%. However, the absolute calibration of standard star magnitudes and the photometric zero points each night limit the overall photometric accuracy to 15-20%. The flux density corresponding to 0.0 mag was taken as 26.2 Jy, following the prescription given in the Explanatory Supplement to the IRAS Catalogs and Atlases (Beichman et al. 1985).
On the night of 7 December 2000, the total mid-infrared on-target observation time was 25 minutes. The observations of SBS 0335-052 were interleaved with six observations of the star IRC-10 046 in order to determine a contemporaneous point spread function (PSF).
2.2 Palomar Near-Infrared Integral Field Spectroscopy
Near-infrared observations of the Br line were carried out on the night of 14 October 2000 using the Palomar Integral Field Spectrograph (PIFS; Murphy, Matthews & Soifer 1999) on the Palomar 200-inch Telescope. PIFS provides a 5496 field of view using eight separate 06796 slits to feed two independent spectrographs within the same liquid N2-cooled dewar. Each slit is four pixels wide and 58 pixels long (0167 pixel-1). The high resolution mode was used, providing a spectral resolution of ( km s-1) near the observed center wavelength of 2.195 m.
The PIFS observations consisted of a set of eight five-minute on-off integrations. Thus 40 minutes were spent integrating on source, and an equal amount of time off source (using a 30″ nod to the north). For these observations, the 5496 field of view was oriented with the long axis at a position angle of 90° (the effect of differential atmospheric refraction is minimal for integral field spectroscopy). A positional dithering pattern was employed for the sequence of observations to recover seeing-limited spatial sampling in the cross-slit direction. Spectral calibration lamp data were taken immediately afterwards; wavelength calibration is provided through a combination of these data and the available OH airglow lines (Oliva & Origlia 1992). The observations were taken under photometric conditions. Spectrophotometric calibration was performed via spectral imaging of the Persson et al. (1998) standard star 9101, thereby establishing the continuum flux density at 2.195 m; the 2.195 m flux density of the standard star was estimated from an extrapolation of its -band ( m) and -band ( m) flux density trend. Corrections for atmospheric opacity and spectral flat-fielding are derived from observations of HR 1232, a 5.8 magnitude G9V star. Details of the calibration technique and the PIFS data reduction process are given in Murphy et al. (2000).
An estimate of the near-infrared PSF was obtained after the first 20 minutes of on-source integration and after the second 20 minutes of on-source integration, with each measurement comprised of four dithered ten-second exposures in band of a nearby field star using the PIFS imaging mode. An azimuthally averaged radial profile of the PSF target in the first case yields a full width at half maximum (FWHM) of approximately 08. After refocusing, our second measurement was FWHM05, indicating that the observations were performed in generally good seeing conditions.
2.3 Owens Valley CO Maps
SBS 0335-052 was observed using the Owens Valley Millimeter Array between February and May of 1999. The source was observed in two configurations of the six 10.4 m telescopes with baselines ranging from 15 m to 119 m. The lines 12CO() and 12CO() were simultaneously observed assuming a redshift of 4076 km s-1 (Thuan, Izotov & Lipovetsky 1997). The CO(1-0) data were recorded using a digital correlator configured with 642 MHz channels centered on 113.2750 GHz, while the CO(2-1) line was observed with 594 MHz channels centered on 227.4456 GHz. Both spectrometer setups provided approximately 300 km s-1 of bandwidth coverage, which is more than adequate for SBS 0335-052. In addition to the spectral line data, the 3 mm continuum and 1 mm continuum were observed with a 1 GHz bandwidth for both the lower and upper sidebands. Typical single-sideband system temperatures were approximately 800 K, corrected for telescope losses and the atmosphere. The nearby quasar PKS B was observed every 20 minutes for gain and phase calibration. Absolute flux calibration was determined from observations of Uranus, Neptune, and 3C 273. The absolute calibration uncertainty for the data is approximately 15% at 3 mm and 25% at 1 mm. After data editing, we obtained effectively 20.6 hours of on-source integration time at 3 mm and 6.6 hours of good integration time at 1 mm. The beam sizes computed using natural weighting to minimize the noise are 538 and 2920 for the 113.2750 GHz and the 227.4456 GHz maps, respectively, providing spatial resolution of 1.4 kpc 1.0 kpc and 750 pc 520 pc.
2.4 Very Large Array Radio Continuum Maps
VLA archival data are available at 1.49 GHz from the B configuration. The data processing includes the primary-beam correction and results in an image with a 6″ FWHM Gaussian beam and an rms noise level of 0.13 mJy beam-1. The point source sensitivity is about a factor of three better than the NRAO VLA Sky Survey (NVSS; Condon et al. 1998), but the surface brightness sensitivity is about 20 times poorer (the NVSS has a 45″ FWHM beam).
2.5 Infrared Space Observatory Far-Infrared Photometry
Results from ISOPHOT observations were kindly provided by M. Sauvage. SBS 0335-052 was detected with the PHT-C C100 camera system and the 50 m filter ( m, m, m), with a far-infrared flux density of m)=112 mJy for .
2.6 Data from the Infrared Astronomical Satellite
SBS 0335-052 was not detected by IRAS, but robust estimates of the 12, 25, 60 and 100 m rms levels can be estimated from the (seven to ten) separate scans made by IRAS at this location. The SCANPI software has been used to determine the median rms levels.
3 Results
3.1 Mid-Infrared Properties
The 12.5 m image of SBS 0335-052 is presented in Figure 1. From the Keck observations the 12.5 m magnitude of SBS 0335-052 is 7.20.2 mags which corresponds to 356 mJy (6% statistical and 15% systematic uncertainties). The statistical uncertainty is the standard deviation based on six differences from the average value. This flux density over a bandpass spanning approximately 12.0 to 13.0 m is consistent with the ISO mid-infrared data obtained by Thuan, Sauvage & Madden (1999), from which they estimate m) mJy and m) mJy from ISOCAM photometry using the LW10 ( m) and LW9 ( m) filters, respectively (30% uncertainties have been attached to the ISO fluxes, reflecting the typical calibration uncertainty in such data). Moreover, the ISOCAM CVF spectrum suggests a 12.5 m flux level near 30 mJy. At a distance of 53 Mpc, the mid-infrared luminosity of SBS 0335-052 is and the far-infrared luminosity is . Table 1 summarizes the main results and general properties of SBS 0335-052.
As pointed out by Thuan, Sauvage & Madden (1999), the IRAS-equivalent 12 m-to-blue ratio for SBS 0335-052 is several times greater than found for spiral galaxies and more than twice as large as the typical value for blue compact dwarf galaxies. The mean ratio for the Thuan & Martin (1981) catalog of 115 blue compact dwarfs is , and for the 69 normal star-forming galaxies described in Helou et al. (1996) and Dale et al. (2000), whereas SBS 0335-052 shows . The mid- to near-infrared and mid-to-far-infrared luminosity ratios are likewise elevated: and , high compared with the average values and for normal star-forming galaxies (Dale et al. 2000). Thus in spite of the galaxy’s depressed metallicity, hot dust is one of the energetically dominant features of its interstellar medium.
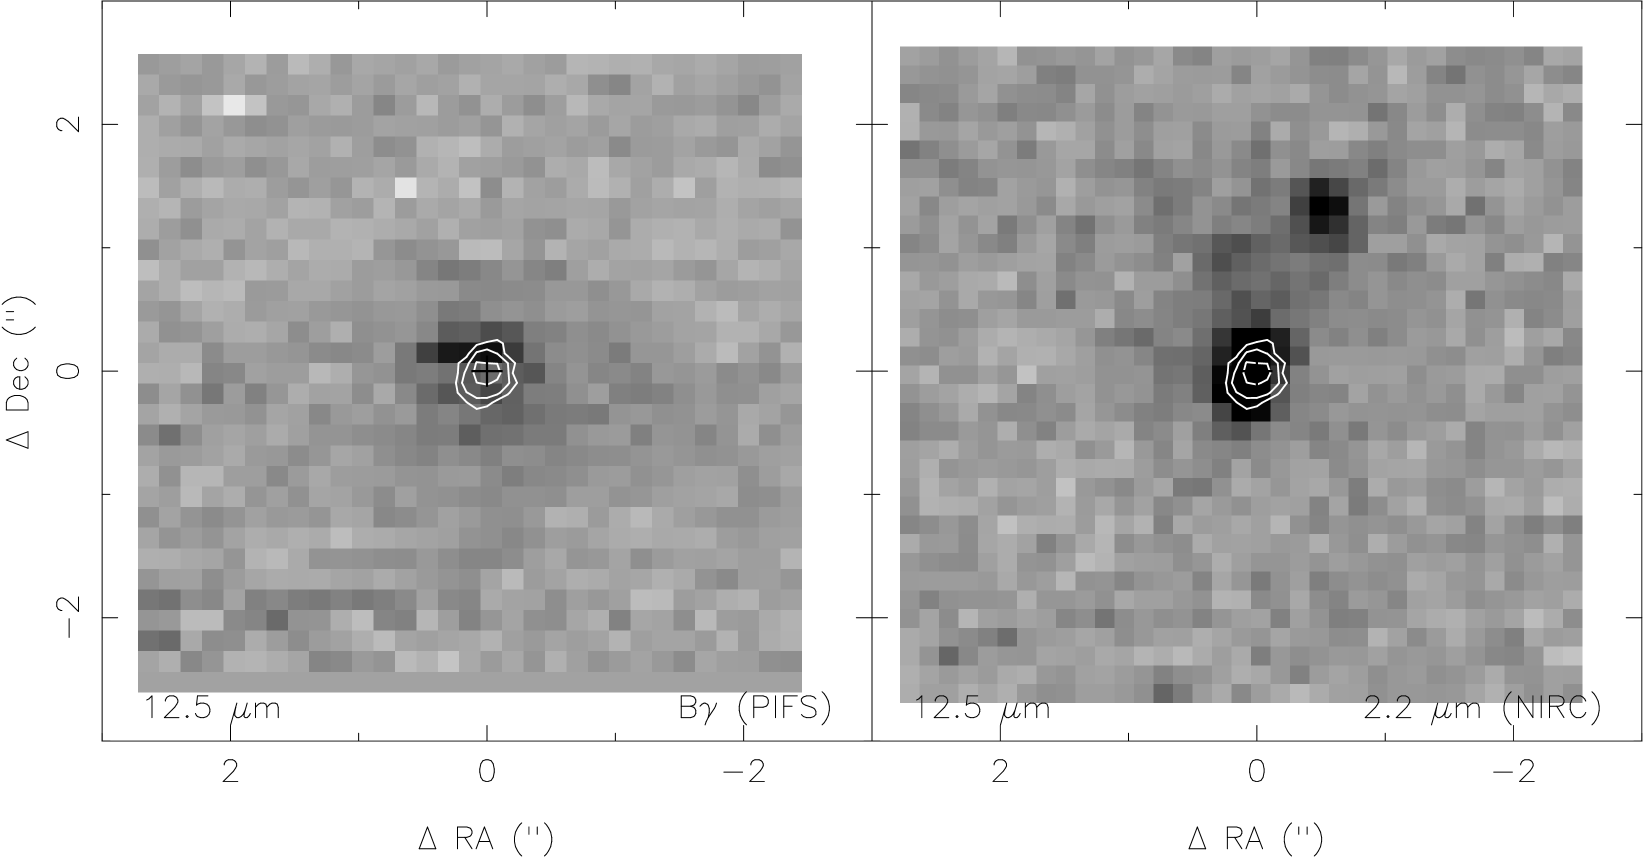
The 12.5 m source is compact (see Figure 1), and the morphology at this wavelength is consistent with a circularly symmetric distribution of warm dust. The average observed FWHM of SBS 0335-052 was 048002, whereas the average FWHM of seven separate PSF observations was 037001. Thus we conclude that SBS 0335-052 is slightly resolved; the intrinsic FWHM after deconvolution of the individual PSFs is 031002 ( pc). The uncertainty is statistical and is based on six differences from the FWHM of the PSF. A Richardson-Lucy deconvolution (Lucy 1974) gives a slightly smaller intrinsic size and likewise shows no significant departures from azimuthal symmetry. The Keck Telescope and LWS do not provide absolute positions to an accuracy 1″ and so two independent measurements were made to give the position of the 12.5 m image relative to the images at other wavelengths. NIRC shares a common focal plane with LWS and it is possible to accurately move the telescope from NIRC to LWS. At 2.2 m SBS 0335-052 is dominated by a bright nucleus; measurements of SBS 0335-052 at 12.5 m were thus made by offsetting the telescope from this bright nucleus as seen at 2.2 m to the LWS array. To the 05 accuracy of these offsets, the compact source at 12.5 m coincides with the bright peak at 2.2 m. The second relative position measurement is described below.
3.2 Near-Infrared Integral Field Spectral Data
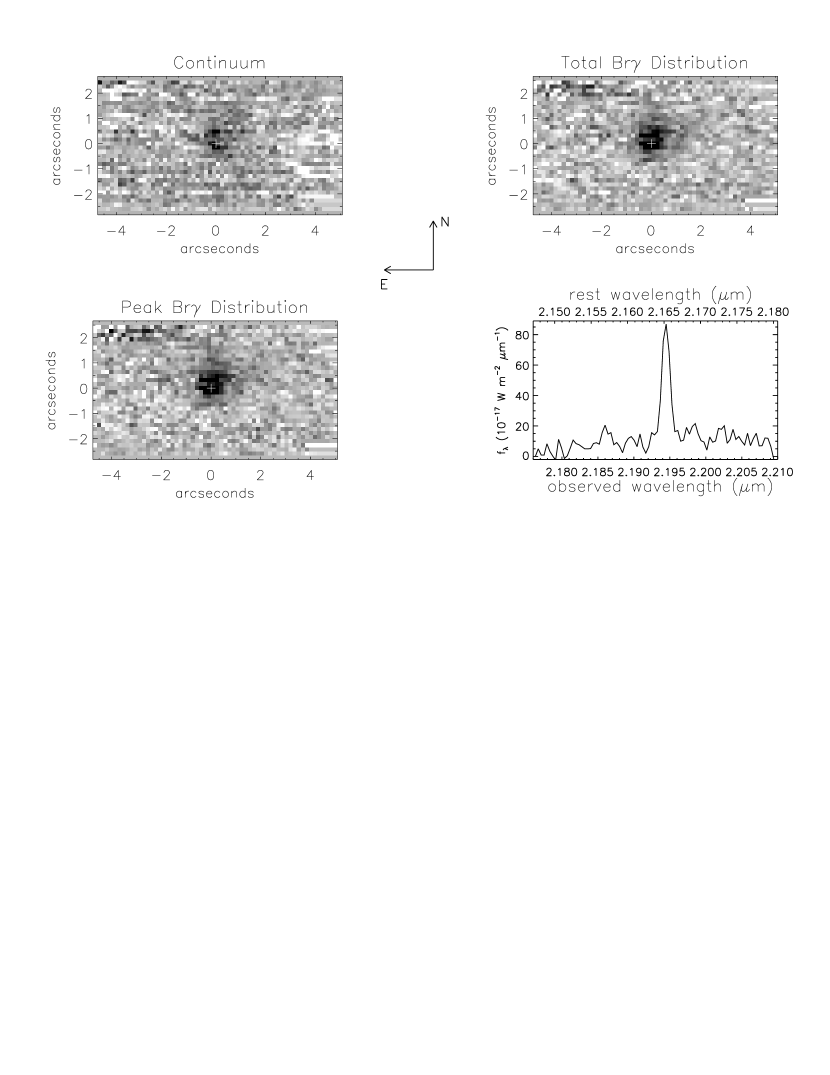
The PIFS observations presented in Figure 2 show that the Br emission is apparently spatially extended: the line emission spans 1″ FWHM (260 pc) compared with the 05-08 seeing at that wavelength. Whereas the signal-to-noise ratio of the PIFS continuum data is too low for us to accurately gauge by eye the center of the continuum distribution, a central moment analysis of the continuum and line emission maps yields a negligible (003; pc) continuum-line offset; there is no evidence in the integral field spectroscopy data for the 60 pc offset between the Br and 2 m continuum peaks claimed by Vanzi et al. (2000). By the design of the PIFS (Murphy, Matthews & Soifer 1999), the Br and 2.2 m continuum images are spatially tied together. If the ad hoc assumption is made that the 12.5 m emission coincides with the Br emission, this ties the 12.5 m emission and the 2.2 m continuum emission of SBS 0335-052 together. Figure 3 illustrates this assumption, and thus orients the 12.5 m emission of SBS 0335-052 relative to that at Br and 2.2 m. Both this and the offsetting measurements previously described are consistent with the 12.5 m emission of SBS 0335-052 coinciding with the bright peak in the 2.2 m continuum. Using 033 resolution imaging, Vanzi et al. (2000) note a 15 separation between two distinct components along the southeast-northwest direction, and WFPC2 and imaging show several distinct clumps spanning 4″ along a southeast-northwest orientation (Papaderos et al. 1998). Such substructure is seen in the Keck NIRC image, but the PIFS near-infrared data give only a faint hint of the multiple peaks, presumably due to the limited spatial resolution and sensitivity of the integral field spectroscopy data.
No velocity structure is resolved for the Br emission. This is not surprising since the resolution is of order 200 km s-1 and the VLA H I data of Pustilnik et al. (2001) only show 40 km s-1 solid-body rotation for the eastern H I peak that is centered on SBS 0335-052. Furthermore, the lack of significant velocity structure of the Br line is consistent with the small velocity dispersion ( km s-1) of the optical emission lines (Izotov et al. 1997).
Measures of the starburst timescale can be inferred from near-infrared continuum data. However, Vanzi et al. (2000) find that the combined helium, H2, and Br emission lines contribute about 50% of the -band flux (within their 1″08 spectroscopy slit), and that Br alone accounts for 6-7%. To within 10% certainty, the integrated Br flux from the PIFS data is W m-2, or approximately 4% of the global -band flux. The Br equivalent width is also indicative of the starburst age (§ 4.3) and is not contaminated by other nebular emission lines. From the PIFS data the Br equivalent width is 23533Å. A cursory review of the literature did not find a larger extragalactic Br equivalent width.
3.3 Radio Continuum Results
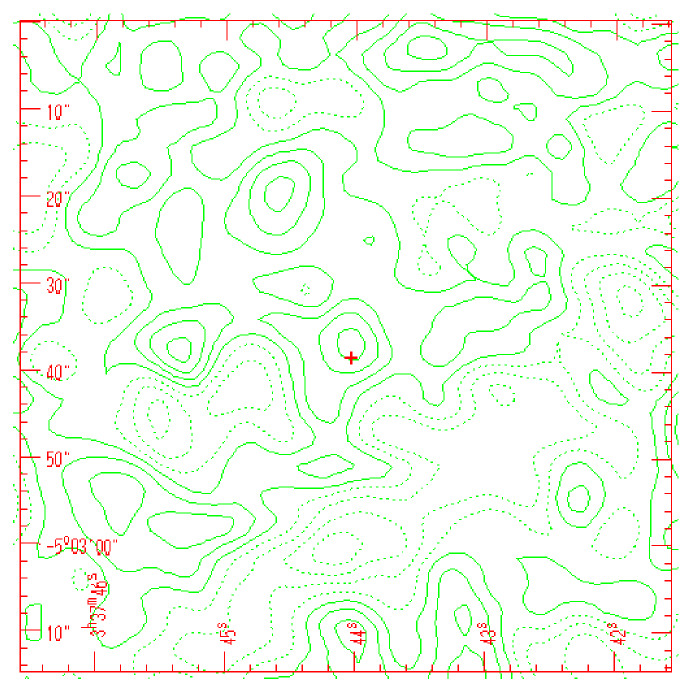
SBS 0335-052 is unresolved in the high resolution map (FWHM=6″ beam) at 1.49 GHz (Figure 4). There is a 3 source with a peak brightness of at the nominal optical position of SBS 0335-052; the radio source has a flux density of 0.40 mJy. Each coordinate has an rms error of about 1″ due to noise, but this is much better than the NVSS positional uncertainty of 7″ for faint sources like SBS 0335-052. No extended radio continuum emission is visible, but a mJy source (the NVSS total flux) smooth source 30″ in size would have a brightness of only and be completely undetectable. Indeed, no 20 cm continuum emission is detected in a VLA survey with 1 mJy beam-1 (4) sensitivity and a 20514″ beam (Pustilnik et al. 2001). On the other hand, the offset of the NVSS source from the optical position (12″ at a position angle of 50° east of north) is large enough that the NVSS source may well be a blend of SBS 0335-052 and two other faint sources to the northeast visible in the contour plot. In short, the flux of the nearby NVSS source probably overestimates the total flux of SBS 0335-052, but the 0.40 mJy component probably corresponds to the compact part of SBS 0335-052, particularly since they agree well in position. The chance that this is a non-detection and is instead a random 3 noise bump coincidentally close to the nominal position of SBS 0335-052 is low. The probability of finding an unrelated radio source with flux mJy within 6″ is less than (Langston et al. 1990).
3.4 CO Results
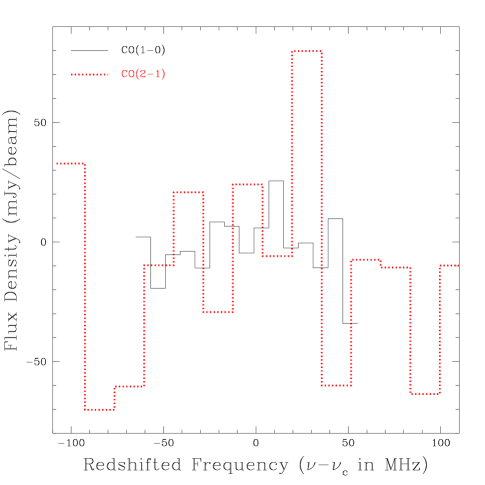
As seen in Figure 5, neither CO nor millimeter continuum emission was detected. The rms limits of 12 mJy and 30 mJy were achieved for the CO(1-0) and CO(2-1) observations, respectively, from an average over four spectral channels (Figure 5). No significant emission or absorption features were detected anywhere in the field. Since the synthesized beams are larger than the bright central starburst regions, it is not expected that the interferometer has resolved out the CO emission. Given that the CO line widths are typically only half the H I line widths in metal-poor galaxies (Sage et al. 1992), a CO line width of approximately 50 km s-1 would be expected for SBS 0335-052. With this adopted line width, the upper limits are Jy km s-1 and Jy km s-1 for the integrated CO line fluxes. For the continuum data, the 1 GHz bandwidths in both the upper and lower side bands were averaged, resulting in upper limits of mJy and mJy.
Given the observational limits, the CO(1-0) data provide a more stringent constraint on the molecular hydrogen gas mass than the CO(2-1) data—blue compact galaxies typically have brightness temperature ratios of (Sage et al. 1992). We thus concentrate on the CO(1-0) data for the remainder of this section. The integrated CO(1-0) flux in Jy km s-1 is related to the molecular hydrogen gas mass by , where is the Galactic CO to H2 conversion factor (Wilson 1995). Adopting the Galactic conversion factor results in . However, the Galactic conversion factor is thought to significantly underestimate the molecular hydrogen gas mass in the metal-poor galaxies. Estimating the proper value of for SBS 0335-052 is somewhat problematic since CO has yet to be detected in such a metal-deficient system. For galaxies with metallicities between solar and 0.1 solar, Wilson (1995) finds . Extrapolating this relationship to a metallicity of 1/41 solar yields and for SBS 0335-052. However, these estimates are only applicable for dense regions where the CO molecules could survive the intense ultraviolet radiation field. In regions of low extinction ( mag), the global CO/H2 abundance ratio is expected to be extremely non-linear with metallicity (Maloney & Black 1988).
4 Discussion
4.1 Dust and The Infrared Spectral Energy Distribution
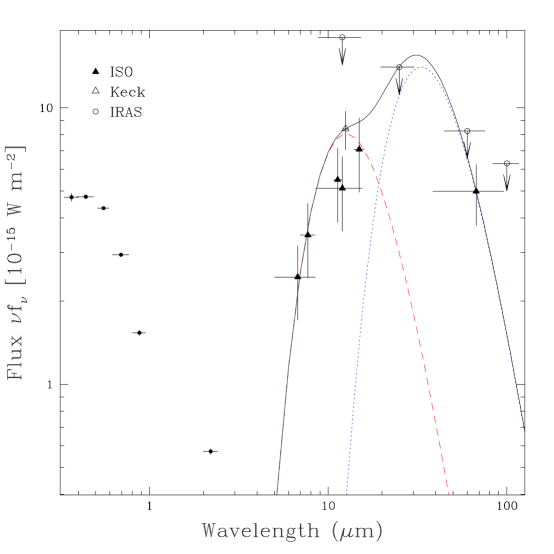
Thuan, Sauvage & Madden (1999) fit the observed mid-infrared spectrum with the profile for a 250 K extincted blackbody with emissivity where is the assumed dust emissivity index. Data at longer wavelengths can help better constrain the infrared spectral energy distribution: in addition to the new flux measurement at 67 m, there are upper limits available from IRAS at 12, 25, 60, and 100 m. These limits are compatible with the levels detected at similar wavelengths (see Figure 6). With the infrared picture of SBS 0335-052 now more fully developed, it is clear that the data suggest multiple dust components. A fit of the superposition of two blackbodies with emissivity , with variable normalizations and dust temperatures, to the 6.7, 7.7, 12.5, 25, and 67 m broadband data results in dust temperatures for the two components of K and 210 K.111IRAS marginally detected (2) SBS 0335-052 at 25 m. If a 2 25 m flux is used in the fit instead of a 3 upper limit, the resulting dust temperatures are 70 K and 207 K. Varying the emissisivity from to changes the dust temperatures by a maximum of 20%. Two relatively warm dust components are also evident in Seyfert galaxies (Pérez García, Rodríguez Espinosa & Santolaya Rey 1998) and luminous galaxies such as Arp 220, NGC 6240 and NGC 4038/39 (Klaas et al. 1997). More far-infrared data are needed to verify whether SBS 0335-052 has an additional colder ( K) dust component.
The density and total amount of dusty material in the core of SBS 0335-052 determines the central opacity. A simple estimate of the optical depth is the ratio of the observed surface brightness to the intensity of the expected blackbody profile, , where is the solid angle of the object. The mid-infrared opacity for SBS 0335-052 is less than at 12.5 m for a wide range of hot dust temperatures ( K). Such an opacity corresponds to mag, in agreement with the result of Izotov et al. (1997). Furthermore, the total ionizing luminosity computed from the number of UV photons per second (§4.3) is of order , similar to the mid-infrared luminosity (Table 1). These results suggest , in contrast to the claim for mag by Thuan, Sauvage & Madden (1999), and argue that the model of a hot blackbody affected by a large column of extinction is invalid.
Since the infrared radiation is optically thin in emission, dust masses can be directly computed using the infrared fluxes. The infrared flux density may be expressed in terms of the number of grains of size , density , and emissivity radiating at temperature at distance : And since the dust mass can be expressed as , one finds
| (1) |
(e.g. Hildebrand et al. 1977). In other words, the dust mass is a function of the observed flux density and the estimated dust temperature, and does not depend on the size of the emitting region. If the dust temperature is 210 K for the hot dust component and the opacity coefficient m) (Li & Draine 2001), the dust mass computed from the 12.5 m flux is . The mass of the cooler dust may be computed from the dust emission at 67 m, radiation which is more likely to arise from steady state processes compared to the mid-infrared emission from very small grains and polycyclic aromatic hydrocarbons (PAHs). The total mass of the presumably larger and cooler dust grains in SBS 0335-052, if K and m) (Li & Draine), is . Thus the warm dust mass is much larger than the hot dust mass in a simple two-component model. We will henceforth use it to represent the total dust mass in SBS 0335-052. Considering that the long wavelength end of the spectral energy distribution is poorly constrained, the warm dust temperature estimate, and thus the overall dust mass, is highly uncertain. Any cold dust, which is unconstrained by the measurements reported here, would likely dominate the total dust mass.
ISO observations show a mid-infrared spectrum with none of the standard PAH features (Thuan, Sauvage & Madden 1999). For a two-component dust model, the hotter dust in SBS 0335-052 is 400 times less massive than the warm dust. Unless it can be explained by sensitivity arguments, it seems peculiar then that there are no obvious PAH features in its mid-infrared spectrum—typically only regions with very energetic interstellar radiation fields, through destruction and/or ionization processes, lack the ubiquitous mid-infrared aromatic emission features (e.g. the core of M 17; Cesarsky et al. 1996). Conversely, emission from merely warm dust should be replete with aromatic features. A possible explanation is that PAHs are thought to condense out of the outflows of carbon-rich red giants (Allamandola, Tielens & Barker 1989), but the starburst in SBS 0335-052 is too young ( Myr) for stars to have reached this phase—only stars more massive than are expected to spend less than 10 Myr on the main sequence (e.g. Bressan et al. 1993).
4.2 The Gas-to-Dust Ratio
The global gas-to-warm dust mass ratio is relatively straightforward to compute. From the H I measurement of Pustilnik et al. (2001) of and the molecular hydrogen mass limit of ,
| (2) |
This value lies on the high end of the expected range for a compact dwarf galaxy compared with the range typically seen for blue compact dwarfs (Lisenfeld & Ferrara 1998), and to that usually found in more mundane regions, like the disks of spiral galaxies where (see Mayya & Rengarajan 1997 and references therein).
However, a global gas-to-dust ratio for SBS 0335-052 is a misleading quantity since the dust and gas are not measured in the same volume. A more sensible constraint on the gas-to-dust mass ratio is derived from the ionized gas mass. The ionized gas density within the Strömgren sphere is (§3.2). The central 80 pc therefore contains approximately of gas, and
| (3) |
representing a lower limit on the central gas-to-dust mass ratio. This estimate is limited by the assumption that the entire dust mass falls within the inner 80 pc.
4.3 Clues from the Br Emission
The near-infrared broadband fluxes of starbursts can be dominated by nebular emission lines that unduly influence stellar age estimates (Leitherer & Heckman 1995). An alternative indicator of the starburst age is the Br equivalent width, a parameter that reflects the ratio of young blue massive stars to the evolved red stellar population. For a plausible range of initial mass function parameters, the Starburst99 models (Leitherer et al. 1999) indicate that (Br for metallicity material corresponds to a stellar age of years. This age holds for both an instantaneous and a continuing star formation model, consistent with the age estimate from other near-infrared spectroscopic and broadband data (Vanzi et al. 2000).
If the central H II region is modeled as a Strömgren sphere, it is possible to use the size of the Br emission and the Br luminosity to infer the density of the ionized gas . For an intrinsic Br-to-Br luminosity ratio of 2.9, the Br luminosity for SBS 0335-052 corresponds to ionizing photons per second (see Ho, Beck & Turner 1990), or approximately 2800 O5 stars (e.g. Panagia 1973). Since the volume of the Strömgren sphere can be expressed as , for a measured pc the inferred density is , reasonable for H II regions (Osterbrock 1989). Here we have assumed Case B recombination (with ) for a nebula at temperature K, but the same electron density is found to within a factor of two for a wide temperature range.
Inasmuch as Br emission is associated with H II regions, it is indicative of the heating input to the interstellar medium; the Br flux can be related to the thermal radio flux density . Following Ho et al. (1989) and assuming a radio spectral slope of appropriate for optically thin free-free emission from ionized gas, we estimate the expected thermal radio continuum flux at 20 cm from . The number of ionizing photons per second inferred from the integrated Br flux for SBS 0335-052 predicts mJy, approximately the observed value for . Since the prediction is at least as large as the observed 20 cm flux density, the straightforward interpretation is that there is little or no evidence for nonthermal radio contributions—there has been, at most, a low level of supernova activity in the short star-formation history of SBS 0335-052. A quick 5 GHz C-array observation with the VLA could easily verify whether the radio source has a flat spectrum indicative of H II regions or a steep spectrum produced by supernova remnants. For comparison, the global thermal fraction of the flux density at 20 cm in normal star-forming galaxies is about 10% (Condon 1992). According to Matteucci & Recchi (2001), the peak in the supernovae rate (and thus the maximum metal enrichment rate) for an instantaneous starburst episode does not occur until 40-50 Myr after the onset of star formation. Such an upper limit to the age of the starburst in SBS 0335-052 agrees with the constraints placed by the Br data. Furthermore, a scenario of modest prior supernova activity would also be consistent with the interpretation laid out in Section 4.4 for the high infrared-to-radio ratio for SBS 0335-052.
4.4 The Infrared-to-Radio Ratio
The radio continuum flux for SBS 0335-052 spatially coincides with its emission at 12.5 m. Thus, if the emission in the mid- and far-infrared is spatially coincident, the far-infrared-to-radio ratio is . This flux density ratio is compatible with the typical ratio for normal star-forming galaxies, which is approximately . Note, however, that in the absence of IRAS detections for SBS 0335-052 an ISO-based has been used as a proxy for the typical IRAS-based definition for the far-infrared “FIR” flux (Helou et al. 1988), which effectively recovers the entire 42-122 m far-infrared flux; the ISOPHOT filter used here, on the other hand, has a shorter central wavelength and an overall narrower profile (§2.5) and thus does not provide as robust an estimate of the bolometric infrared flux. The FIR 42-122 m flux for SBS 0335-052 computed from the model spectral energy distribution shown in Figure 6 is , and thus the logarithmic measure defined by Helou, Soifer & Rowan-Robinson (1985) is . The 20% uncertainty is conservatively derived from the full range of FIR model fluxes found after invoking different combinations of the 25 m flux upper limit (2 to 3) and the dust emissivity index (). In other words, the far-infrared-to-radio ratio estimated from the model spectral energy distribution is , slightly outside the range for normal star-forming galaxies.
Given its youth, small size, and the inferred lack of nonthermal radio flux, it is surprising that SBS 0335-052 exhibits a fairly ‘normal’ infrared-to-radio ratio. In resolved sources, the radio continuum emission is usually more diffuse than the infrared light (Marsh & Helou 1998), and is explained by the spreading of cosmic rays as they decay and are trapped in magnetic field lines (Helou & Bicay 1993). The smearing scalelength in normal galaxies is many hundreds of parsecs (Marsh & Helou 1998), much larger than the 80 pc mid-infrared size of SBS 0335-052. Moreover, the relatively small disk scale heights for dwarf galaxies may result in cosmic rays escaping comparatively easily (Helou & Bicay 1993). Finally, the youth of SBS 0335-052 means that relatively few supernovae have occurred, resulting in low cosmic ray production and weak interstellar magnetic fields. All these lines of reasoning predict a low nonthermal radio continuum flux for SBS 0335-052 compared to the far-infrared flux, consistent with the findings using the Br data. In short, since the canonical far-infrared-to-radio ratio presumably hinges on a typically strong (%) nonthermal contribution to the radio flux, the apparently negligible nonthermal radio emission of SBS 0335-052 should result in an extremely high far-infrared-to-radio ratio.
Given the elevated mid- to far-infrared ratio and the unusual infrared spectral energy distribution of SBS 0335-052, perhaps it is more appropriate to instead compute a total infrared-to-radio ratio. In normal galaxies the far-infrared flux is a useful measure of the total infrared flux (TIR), with FIR typically half of the 3-1100 m bolometric infrared flux (Dale et al. 2001): TIR/radio . But the conspicuously intense interstellar radiation field of SBS 0335-052 results in an unusually strong contribution at mid-infrared wavelengths—the FIR flux for SBS 0335-052 computed from the model spectral energy distribution shown in Figure 6 (and all plausible variations) is less than one fourth the model’s bolometric infrared flux, resulting in TIR/radio . In short, the total infrared to radio flux for SBS 0335-052 is about four times that in normal star-forming galaxies, and is likely due to a relative lack of trapped interstellar cosmic rays, resulting in comparatively weak radio emission.
4.5 The Intensity of the Interstellar Radiation Field
In a detailed study of the N 4 complex of H II regions in the Large Magellanic Cloud, Contursi et al. (1998) show how the mid-infrared color strongly varies as a function of interstellar radiation field intensity, with the highest ratios () corresponding to ultraviolet radiation densities approaching times the interstellar radiation field in the solar neighborhood. Though the distance to SBS 0335-052 precludes such a spatially-detailed analysis, the average interstellar heating intensity can be estimated from where and is the flux of the local interstellar far-ultraviolet radiation field (Hollenbach & Tielens 1999 and references therein). This result is consistent with the findings of Contursi et al. (1998; 2000): an unusually high mid-infrared color, in the case of SBS 0335-052 (Thuan, Sauvage & Madden 1999), corresponds to an interstellar radiation field at least four orders of magnitude greater than the local value. Moreover, a reasonable dust temperature is found for SBS 0335-052 if it is assumed that . Scaling from the 17.5 K dust temperature found for diffuse Galactic cirrus (Boulanger et al. 1996), an order of magnitude estimate for the interstellar dust temperature for such a radiation field is K K. Though this result is compatible with the dust temperature predicted for the bulk of the interstellar medium in SBS 0335-052 (Section 4.1), it is the hot dust that is primarily emitting at 12.5 m. One interpretation of this discrepancy is that the small grain emission at mid-infrared wavelengths results from a semi-stochastic process; the small grain emission is perhaps not well-represented by a hot blackbody (e.g. Draine & Anderson 1985).
4.6 The Compact Nature of the Starburst Region
The mid-infrared data presented here, with angular resolution better than 04, represent the highest spatial resolution achieved to date in probing the blue compact dwarf galaxy SBS 0335-052. SBS 0335-052 is compact at 12.5 m compared with its stellar and gaseous constituents. In normal star-forming galaxies the extent of the mid-infrared, far-infrared, and submillimeter emission is comparable to the optical size (Dale et al. 2000; Rice et al. 1988; Chini et al. 1995), and detailed modelling of the optical and near-infrared emission from normal late-type spiral galaxies shows that dust scalelengths typically are larger than that of the stars and that dust radially extends to larger distances than stars in the disk (Xilouris et al. 1999). On the other hand, the high angular resolution studies of Soifer et al. (2000) and Soifer et al. (2001) show that it is common for both ultraluminous and starburst galaxies to be particularly compact at 12 m compared with their optical distributions, especially for ULIRGs, with typically more than 50% of the mid-infrared emission arising from pc-sized regions. Thus perhaps it is relatively common for actively star-forming systems to produce the bulk of their thermal mid-infrared emission in small volumes surrounding a handful of bright super star clusters. This may be especially true for dwarf systems like SBS 0335-052, where a relatively small stellar population may be dominated by a few extremely bright stars or star clusters.
The lack of extended hot dust emission in SBS 0335-052 is most easily attributed to geometry: the relatively small number of bright stars in SBS 0335-052 heat to high temperatures only the most proximate dust. As outlined in Section 4.1, the mass of this hot dust is . The bulk of the of dust spread throughout the rest of the interstellar medium is located significantly farther from the hottest stars, and is thus only warmed to K on average. Balancing the radiation absorbed and reemitted by dust grains yields the following simple relation for the approximate temperature of dust grains in thermal equilibrium with the surrounding interstellar radiation field:
| (4) |
where and are the absorption and emission coefficients in the ultraviolet and infrared, respectively. If the dust emission is optically thin and distributed in a circularly symmetric fashion centered on the ionizing luminosity source (e.g. the brightest super star cluster), then the hot dust is pc from the ionizing source and the warm dust lies at a characteristic distance of pc (assuming ). A substantial portion of the ionizing photons from the star clusters, on the other hand, encounter neutral gas at much larger distances, and that is why the central H II region in SBS 0335-052 spans more than 1 kiloparsec (Izotov et al. 1997). Needless to say, the angular resolution of the extant infrared data is at least an order of magnitude too low to corroborate this scenario.
In many respects, SBS 0335-052 resembles NGC 5253: it is a low metallicity dwarf galaxy dominated by a 10 Myr old compact and strong mid-infrared emitting star-forming region for which the radio continuum emission is almost entirely thermal (Beck et al. 1996; Gorjian, Turner & Beck 2001). Can a useful comparison be made between the star-forming regions in NGC 5253 and SBS 0335-052? Probably not, in that the mid-infrared size of SBS 0335-052 is truly extended and is not confined to an ultracompact 1-2 pc super star cluster containing several thousand O stars as in NGC 5253 (Turner et al. 2000)—the stellar component of SBS 0335-052 is comprised of multiple star clusters spread throughout the inner 520 pc (Thuan, Izotov & Lipovetsky 1997). Moreover, even though its mid-infrared emission appears to originate from a quite compact region, the corresponding volume and stellar density in the core of SBS 0335-052 are much less extreme than for the super star cluster in NGC 5253. Finally, the potential for future star formation is substantially more promising for SBS 0335-052: the galaxy has a large H I reservoir that spans 66 kpc by 22 kpc (covering both the eastern and western optical components of SBS 0335-052), an order of magnitude larger in linear extent than the optical emission.
5 Summary
The previous work on SBS 0335-052 and our new results suggest that SBS 0335-052 is a galaxy observed early in its formative years, and is likely experiencing its first burst of star formation. We find that:
1. SBS 0335-052 has a very compact distribution of hot dust, which suggests that significant star formation has not occurred for long nor over large spatial scales. A more extended dust distribution presumably requires more red giant stars processing dust grains for a longer time.
2. The rough spectral shape mapped out by the available mid- and far-infrared fluxes suggests that the global distribution of dust is in the form of at least one warm (80 K) component with a mass of and one hot (210 K) component; more longer-wavelength data are needed to verify the presence of a substantial cold dust component.
3. In spite of the depressed global metallicity, hot dust is one of the energetically dominant features of the galaxy’s interstellar medium, resulting in the mid-infrared emission being remarkably comparable to that in the far-infrared. An important conclusion may be reached here: young systems that are characterized by a few pockets of active star formation and an overall metal-poor interstellar medium will show elevated mid- to far-infrared ratios. Perhaps normal characteristics are achieved only after a certain amount of time has passed, after large dust grains have had time to form or build up. Only then will the more extended, cooler far-infrared dust emission come to dominate the pockets of hot dust emission.
4. The mid-infrared flux coupled with the mid-infrared size and dust temperature indicate that the dust in the star-forming region is optically thin in emission and mag. Since CO molecules likely need to be self-shielding and thus optically thick to be found in appreciable amounts (Meier et al. 2001), it is not surprising that CO emission was not detected for SBS 0335-052.
5. The galaxy has a bolometric infrared-to-radio ratio that is four times what is expected for normal star-forming galaxies. This is presumably due to a lack of cosmic rays trapped by interstellar magnetic field lines, as evidenced by the galaxy’s negligible nonthermal radio emission. The dearth of trapped cosmic rays is explained by a combination of two effects: i) the relatively short star-formation history of this galaxy—the starburst is so young that its luminosity is still dominated by extremely massive, luminous stars. The infrared luminosity output per star is high, but the number of supernova remnants is low, assuming the radio power per supernova remnant is independent of progenitor mass; ii) the compact size of SBS 0335-052—dwarf galaxies are known to exhibit low trapping of cosmic rays (Condon, Anderson & Helou 1991).
6. SBS 0335-052 has an extremely large Br equivalent width that is indicative of a vigorous star-forming region only 3–6 Myr old. The distribution of the Br hydrogen recombination line appears to be more extended than the mid-infrared continuum.
7. The estimated average interstellar heating intensity is times the intensity found in the solar neighborhood. Comparable heating intensities are not typically seen globally in galaxies; only H II regions show such elevated heating intensities.
References
- (1) Allamandola, L.J., Tielens, A.G.G.M. & Barker, J.R. 1989, ApJS, 71, 733
- (2) Beck, S.C., Turner, J.L., Ho, P.T.P., Lacy, J.H. & Kelly, D.M. 1996, ApJ, 457, 610
- (3) Beichman, C.A., Neugebauer, G., Habing, H.J., Clegg, P.E. & Chester, T.J. 1985, Infrared Astronomical Satellite Catalog and Atlases, Explanatory Supplement, Washington, DC, Government Printing Office
- (4) Bessel, M.S. 1979, PASP, 91, 589
- (5) Boulanger, F., Abergel, A., Bernard, J.-P., Burton, W.B., Desert, F.-X., Hartmann, D., Lagache, G. & Puget, J.-L. 1996, A&A, 312, 256
- (6) Bressan, A., Fagotto, F., Bertelli, G. & Chiosi, C. 1993, A&AS, 100, 647
- (7) Cesarsky, D., Lequeux, J., Abergel, A., Pérault, M., Palazzi, E., Madden, S. & Tran, D. 1996, A&A, 315, L309
- (8) Chini, R., Kruegel, E., Lemke, R. & Ward-Thompson, D. 1995, A&A, 295, 317
- (9) Cole, S., Lacey, C.G.,Baugh, C.M. & Frenk, C.S. 2000, MNRAS, 319, 168
- (10) Condon, J.J., Anderson, M.L. & Helou, G. 1991, ApJ, 376, 95
- (11) Condon, J.J. 1992, ARA&A, 30, 575
- (12) Condon, J.J., Cotton, W.D., Greisen, E.W., Yin, Q.F., Perley, R.A., Taylor, G.B. & Broderick, J.J. 1998, AJ, 115, 1693
- (13) Contursi, A., Lequeux, J., Hanus, M., Heydari-Malayeri, M., Bonoli, C., Bosma, A., Boulanger, F., Cesarsky, D., Madden, S., Sauvage, M., Tran, D. & Vigroux, L. 1998, A&A, 336, 662
- (14) Contursi, A., Lequeux, J., Cesarsky, D., Boulanger, F., Rubio, M., Hanus, M., Sauvage, M., Tran, D., Bosma, A., Madden, S. & Vigroux, L. 2000, A&A, 362, 310
- (15) Dale, D.A., Silbermann, N.A., Helou, G., Valjavec, E., Malhotra, S., Beichman, C.A., Brauher, J., Contursi, A., Dinerstein, H.L., Hollenbach, D.J., Hunter, D.A., Kolhatkar, S., Lo, K.Y., Lord, S.D., Lu, N.Y., Rubin, R.H., Stacey, G.J., Thronson, H.A. Jr., Werner, M.W. & Corwin, H.G. Jr. 2000, AJ, 120, 583
- (16) Dale, D.A., Helou, G., Contursi, A., Silbermann, N.A. & Kolhatkar, S. 2001, ApJ, 549, 215
- (17) van Dokkum, P.G., Franx, M., Fabricant, D., Kelson, D.D. & Illingworth, G. 1999, ApJ, 520, L95
- (18) Draine, B.T. & Anderson, N. 1985, ApJ, 292, 494
- (19) Gorjian, V., Turner, J.L. & Beck, S.C. 2001, astro-ph/0103101
- (20) Helou, G., Soifer, B.T. & Rowan-Robinson, M. 1985, ApJ, 298, L7
- (21) Helou, G., Khan, I.R., Malek, L. & Boehmer, L. 1988, ApJS, 68, 151
- (22) Helou, G. & Bicay, M.D. 1993, ApJ, 415, 93
- (23) Helou, G., Malhotra, S., Beichman, C.A., Dinerstein, H., Hollenbach, D.J., Hunter, D.A., Lo, K.Y., Lord, S.D., Lu, N.Y., Rubin, R.H., Stacey, G.J., Thronson, Jr., H.A. & Werner, M.W. 1996, A&A, 315, L157
- (24) Hildebrand, R.H., Whitcomb, S.E., Winston, R., Stiening, R.F., Harper, D.A. & Moseley, S.H. 1977, ApJ, 216, 698
- (25) Ho, P.T.P., Turner, J.L., Fazio, G.G. & Willner, S.P. 1989, ApJ, 344, 135
- (26) Ho, P.T.P., Beck, S.C. & Turner, J.L. 1990, ApJ, 349, 57
- (27) Hollenbach, D.J. & Tielens, A.G.G.M. 1999, Reviews of Modern Physics, 71, 173
- (28) Izotov, Y.I., Lipovetsky, V.A., Chaffee, F.H., Foltz, C.B., Guseva, N.G. & Kniazev, A.Y. 1997, ApJ, 476, 698
- (29) Jones, B. & Puetter, R.C. 1993, Proc. SPIE, 1946, 610
- (30) Klaas, U., Haas, M., Heinrichsen, I. & Schulz, B., 1997, A&A, 325, L21
- (31) Langston, G.I., Conner, S.R., Heflin, M.B., Lehar, J., Burke, B.F. 1990, ApJ, 353, 34
- (32) Leitherer, C. & Heckman, T.M. 1995, ApJS, 96, 9
- (33) Leitherer, C., Schaerer, D., Goldader, J.D., Delgado, R.M.G., Robert, C., Kune, D.F., de Mello, D.F., Devost, D. & Heckman, T.M. 1999, ApJS, 123, 3
- (34) Li, A. & Draine, B.T. 2001, ApJ, in press (astro-ph/0011319)
- (35) Lisenfeld, U. & Ferrara, A. 1998, ApJ, 496, 145
- (36) Lucy, L.B. 1974, AJ, 79, 745
- (37) Maloney, P. & Black, J.H. 1988, ApJ, 325, 389
- (38) Marsh, K.A. & Helou, G. 1998, ApJ, 493, 121
- (39) Matteucci, F. & Recchi, S. 2001, ApJ, in press, astro-ph/0105074
- (40) Matthews, K. & Soifer, B.T. 1994, Experimental Astronomy, 3, 77
- (41) Mayya, Y.D. & Rengarajan, T.N. 1997, AJ, 114, 946
- (42) Meier, D.S., Turner, J.L., Crosthwaite, L.P. & Beck, S. 2001, AJ, 121, 740
- (43) Murphy, T.W. Jr., Matthews, K. & Soifer, B.T. 1999, PASP, 111, 1176
- (44) Murphy, T.W. Jr., Soifer, B.T., Matthews, K. & Armus, L. 2000, AJ, 120, 1675
- (45) Oliva, E. & Origlia, L. 1992, A&A, 254, 466
- (46) Osterbrock, D. 1989, in Astrophysics of Gaseous Nebulae and Active Galactic Nuclei, University Science Books
- (47) Panagia, N. 1973, AJ, 78, 929
- (48) Papaderos, P., Izotov, Y.I., Fricke, K.J., Thuan, T.X. & Guseva, N.G. 1998, A&A, 338, 43
- (49) Pérez García, A.M., Rodríguez Espinosa, J.M. & Santolaya Rey, A.E. 1998, ApJ, 500, 685
- (50) Pustilnik, S.A., Brinks, E., Thuan, T.X., Lipovetsky, V.A., Izotov, Y.I. 2001, ApJ, in press (astro-ph/0011291)
- (51) Rice, W., Lonsdale, C.J., Soifer, B.T., Neugebauer, G., Kopan, E.L., Lloyd, L.A., de Jong, T. & Habing, H.J. 1988, ApJS, 68, 91
- (52) Sage, L.J., Salzer, J.J., Loose, H.-H. & Henkel, C. 1992, A&A, 265, 19
- (53) Schlegel, D.J., Finkbeiner, P.F. & Davis, M. 1998, ApJ, 500, 525
- (54) Soifer, B.T., Neugebauer, G., Matthews, K., Egami, E., Becklin, E.E., Weinberger, A.J., Ressler, M., Werner, M.W., Evans, A.S., Scoville, N.Z., Surace, J.A. & Condon, J.J. 2000, AJ, 119, 509
- (55) Soifer, B.T., Neugebauer, G., Matthews, K., Egami, E., Weinberger, A.J., Ressler, M., Scoville, N.Z., Stolovy, S.R., Condon, J.J. & Becklin, E.E. 2001, submitted
- (56) Thuan, T.X. & Martin, G.E. 1981, ApJ, 247, 823
- (57) Thuan, T.X., Izotov, Y.I. & Lipovetsky, V.A. 1997, ApJ, 477, 661
- (58) Thuan, T.X, Sauvage, M. & Madden, S. 1999, ApJ, 516, 783
- (59) Turner, J.L., Beck, S.C. & Ho, P.T.P. 2000, ApJ, 532, L109
- (60) Vanzi, L., Hunt, L.K., Thuan, T.X. & Izotov, Y.I. 2000, A&A, 363, 493
- (61) Wilson, C.D. 1995, ApJ, 448, L97
- (62) Xilouris, E.M., Byun, Y.I., Kylafis, N.D., Paleologou, E.V. & Papamastorakis, J. 1999, A&A, 344, 868
| Parameter | Value | Source |
|---|---|---|
| optical position (J2000) | 440 | NED |
| c | 4043 km s-1 | NED |
| distanceaaComputed in the Local Group reference frame and assuming km s-1 Mpc-1. | 53.3 Mpc | |
| bbCorrected for Galactic extinction (Schlegel, Finkbeiner & Davis 1998). | 16.76 mag | Papaderos et al. (1998) |
| bbCorrected for Galactic extinction (Schlegel, Finkbeiner & Davis 1998). | 15.43 mag | Vanzi et al. (2000) |
| ccComputed assuming Jy and Jy (Bessel 1979). | 0.840.02 mJy | Papaderos et al. (1998) |
| ccComputed assuming Jy and Jy (Bessel 1979). | 0.420.01 mJy | Vanzi et al. (2000) |
| 356 mJy | this work | |
| 11228 mJy | this work | |
| (Br | W m-2 | this work |
| dd upper limit. | mJy | IRAS |
| dd upper limit. | mJy | IRAS |
| dd upper limit. | mJy | IRAS |
| dd upper limit. | mJy | IRAS |
| dd upper limit. | Jy km s-1 | this work |
| dd upper limit. | Jy km s-1 | this work |
| GHz) | 0.40.1 mJy | this work |
| ee where is the power per octave. The solar luminosity is taken to be W. | Papaderos et al. (1998) | |
| ee where is the power per octave. The solar luminosity is taken to be W. | this work | |
| ee where is the power per octave. The solar luminosity is taken to be W. | this work | |
| ffComputed assuming a Galactic CO to H2 conversion factor. | this work | |
| ggComputed assuming a CO to H2 conversion factor equal to twelve times the Galactic value. | this work |
| Wavelength | Size | Size |
|---|---|---|
| ″ | kpc | |
| 2.166 m (Br) | 11 | 0.260.26 |
| 2.2 m | 21 | 0.520.26 |
| 12.5 m | 0.310.31 | 0.080.08 |
| 20 cmaaunresolved | 66 | 1.551.55 |