Angular Momentum Evolution of Stars in the Orion Nebula Cluster
Abstract
We present theoretical models of stellar angular momentum evolution from the Orion Nebula Cluster (ONC) to the Pleiades and the Hyades. We demonstrate that observations of the Pleiades and Hyades place tight constraints on the angular momentum loss rate from stellar winds. The observed periods, masses and ages of ONC stars in the range 0.2–0.5 M⊙, and the loss properties inferred from the Pleiades and Hyades stars, are then used to test the initial conditions for stellar evolution models. We use these models to estimate the distribution of rotational velocities for the ONC stars at the age of the Pleiades (120 Myr). The modeled ONC and observed Pleiades distributions of rotation rates are not consistent if only stellar winds are included. In order to reconcile the observed loss of angular momentum between these two clusters, an extrinsic loss mechanism such as protostar-accretion disk interaction is required. Our model, which evolves the ONC stars with a mass dependent saturation threshold normalized such that at 0.5 M⊙, and which includes a distribution of disk lifetimes that is uniform over the range 0–6 Myr, is consistent with the Pleiades. This model for disk-locking lifetimes is also consistent with inferred disk lifetimes from the percentage of stars with infrared excesses observed in young clusters. Different models, using a variety of initial period distributions and different maximum disk lifetimes, are also compared to the Pleiades. For disk-locking models that use a uniform distribution of disk lifetimes over the range 0 to , the acceptable range of the maximum lifetime is Myr. We also use the ONC period data combined with infrared excess data of the ONC stars to test this model directly on the pre-main-sequence. At present, the sample of data is not large enough to make strong conclusions based upon this test.
1 Introduction
A fundamental problem in the study of stellar evolution is the loss of angular momentum in stars as they evolve from the birthline to the main-sequence. Early observations of T Tauri stars showed rotation rates of of their breakup velocity (Vogel & Kuhi 1981; Bouvier et al. 1986; Hartmann et al. 1986). New observations of the ONC (Herbst et al. 2001; Stassun et al. 1999, hereafter SMMV), which increased the statistical sample of young stars, showed that the majority of lower mass stars in this cluster rotate at rates approaching 30% of breakup. Studies of main sequence stars (Stauffer & Hartmann 1986) and older clusters like the Hyades (Stauffer et al. 1987; Terndrup et al. 2000) have shown that late-type stars are mostly slow rotators ( km s-1). These observations are not consistent with strict angular momentum conservation as the stars contract during their evolution from the birthline to the main sequence (Stauffer & Hartmann 1987; Sills, Pinsonneault, & Terndrup 2000, and references therein). If the young clusters, such as the ONC and NGC 2024, represent an earlier evolutionary stage of older clusters such as the Pleiades and Hyades, then significant angular momentum loss must occur during the pre-main-sequence (pre-MS) in order to produce the slow rotation rates seen at later times.
It has long been known that stars lose angular momentum through stellar winds (Schatzman 1962; Weber & Davis 1967), and this has been used to explain observed rotation rates at the MS for different mass stars. Much theoretical work has been done to explain the angular momentum loss in stars in the pre-MS (see Krishnamurthi et al. 1997 for a review). Theoretical models of the interaction between a rotating central star and a circumstellar accretion disk have been put forth (Königl 1991; Shu et al. 1994). According to these models, the star’s circumstellar disk truncates at an inner radius and material is accreted onto the surface of the star through magnetic field lines. Magnetic torques then transfer angular momentum away from star and into the disk, causing the disk and star to corotate at a period that does not change as the star evolves on the pre-MS. This “disk-locking” model naturally produces the slow rotators seen in observations of young clusters (Collier Cameron & Campbell 1993; Keppens et al. 1995).
Observations of the ONC, with an age of Myr, are an important test for these theoretical models. Attridge & Herbst (1992) claimed a distribution of observed rotational periods that was bimodal, with a group of slow rotators at an average period of days, and another group of rapid rotators near 2 days. This bimodality was supported by further studies which increased the number of measured photometric periods (Choi & Herbst 1999; Herbst et al. 2000, hereafter HRHC; Herbst et al. 2001). HRHC used magnetic disk locking to interpret their distribution of periods, stating that the slow rotators are stars that are currently locked to their disks, while the rapid rotators had been released from their disks and were allowed to spin up. The disk-locking model yields a rotation period of 8 days for reasonable values of the mass accretion rate, magnetic field strength and inner truncation radius of the disk (Shu et al. 1994). Their observations are consistent with previous observations of the distribution of rotational velocities of T Tauri stars, which showed a peak at slow rotation and a long tail to higher velocities (Hartmann et al. 1986). The tail in the velocity distribution would lead to a peak at rapid rotation in a histogram of periods, creating a bimodal distribution like that seen by HRHC.
Recent observations of the ONC by SMMV have challenged both the claim of a bimodal period distribution and the role of stellar accretion disks. Their sample of rotation periods was statistically consistent with a distribution of periods which is uniform from 0.5–8 days (see §2.2 for a brief comparison of the HRHC and SMMV data). They identified stars which are actively accreting (and should therefore be disk-locked) by identifying stars with H and Ca II triplet emission in their spectra. The distribution of periods in this subset of stars was found to be statistically indistinguishable from the sample of stars without emission. As another test, near-IR photometry from Hillenbrand et al. (1998) was used to determine which stars had circumstellar disks. No correlation was found between near-IR excess111i.e. (I-K), where (I-K) is the difference between the observed I-K value and that expected for a star of a given temperature. and rotational period. Since there appeared to be no connection between the observational signatures of accretion disks and the slow rotation expected in disk-locking theories, SMMV challenged the idea that disk-locking is the prime mover of angular momentum in pre-MS stars.
Comparisons between theoretical models of stellar rotational evolution and observations of open clusters (Allian et al. 1996; Krishnamurthi et al. 1997; Allain 1998; Barnes, Sofia, & Pinsonneault 2001) have focused on solar-mass stars. These studies have demonstrated that there is a core-envelope decoupling in these stars at an age Myr, and that the saturation threshold of the angular momentum loss from stellar winds has a dependence on mass. But solar analogues have proved difficult to model theoretically. In addition to the initial conditions, the predictions of the models are sensitive to the treatment of internal angular momentum transport and angular momentum loss.
Lower mass stars (M M⊙) rotate as solid bodies since they are nearly fully convective up to the time of the Pleiades (120 Myr). Beyond this age, stars greater than 0.35 M⊙ develop a radiative core, but most of the moment of inertia is still in the convection zone. Solid body models can be used to constrain the initial conditions of open clusters, such as the range of disk lifetimes and initial rotation periods, with less ambiguity. Low-mass open cluster stars exhibit less angular momentum loss than do high-mass stars, which reduces the influence of angular momentum loss rates on the inferred initial conditions. Stars below 0.5 M⊙ show a wide range of rotational velocities in the Pleiades. In the Hyades (600 Myr), rapid rotation persists for low-mass stars, but those stars between 0.5–1.2 M⊙ rotate at speeds below 10 km s-1 (Stauffer et al. 1987; Terndrup et al. 2000). Since a range of speeds can still be detected at this age for low-mass stars, comparisons can be made between a number of clusters over a wide age span. Thus, we can empirically constrain the angular momentum loss of pre-MS stars.
In this paper we will present results of models that take the observed periods for low-mass stars (0.2–0.5 M⊙) in the ONC and evolve these stars forward using theoretical stellar evolution models and different angular momentum loss rates. In §2 we present the theoretical framework of these models and how they were applied to to the observational data. In §3 we will apply these models to data from both the Pleiades and the ONC. These calculations will constrain the two parameters of the angular momentum loss mechanisms, the saturation threshold and the disk-locking lifetime, leading to a single preferred model. Infrared excess data for stars in the ONC is also used as an additional initial condition to test this model. In §4 we discuss the implications of these results, including the uniqueness of our model and how it can be applied to further observational data in the pre-MS.
2 Constructing Theoretical Models
2.1 Angular Momentum Loss Mechanisms
To construct models of low-mass stars, we used the Yale Rotating Evolution Code (YREC, Guenther et al. 1992). YREC is a Henyey code which solves the equations of stellar structure in one dimension. YREC uses the nuclear reaction rates of Gruzinov & Bahcall (1998) and the equation of state from Saumon, Chabrier & van Horn (1995). Our models have a metallicity of = 0.0176 and a mixing length of = 1.845, calibrated such that a 1.0 M⊙ model will reproduce the solar radius and luminosity at the solar age. The input physics for these models is discussed in Sills, Pinsonneault, & Terndrup (2000).
Although the theoretical models for magnetic star-disk interaction discussed in §1 are sophisticated and complex in their formulation, the treatment of disk-locking for our angular momentum models is quite simple, since the disk and star corotate at a fixed angular velocity. When the star is disk-locked, its period is held constant over the lifetime of the disk, , and the angular momentum change is then a function of star’s moment of inertia. When the age of the stellar model reaches , the star is released from disk-locking and evolves under equations (1) and (2) below. The disk lifetime, , is relative to the birthline (0 Myr) and not to the observed age of the star, . We use the birthline of Palla & Staller (1991), which is the deuterium-burning main sequence and corresponds to the upper envelope of T Tauri stars in the H-R diagram. The time evolution of the stellar moment of inertia was taken from the YREC stellar models, in which solid-body rotation was enforced. Stellar models of this mass range that included internal angular momentum transport were nearly identical to solid body models (Sills, Pinsonneault, & Terndrup 2000).
Rotating stars that lose mass through magnetized stellar winds will also lose angular momentum. To quantify this loss rate, we used a prescription for angular momentum loss adopted from Kawaler (1988) and MacGregor & Brennan (1991), and described in Krishnamurthi et al. (1997). We write
| (1) |
| (2) |
where is the angular rotation rate of the star, is a normalization parameter fixed such that a solar model rotates at the observed solar period at the age of the Sun, and is the threshold at which the angular momentum loss rate saturates (i.e. rather than , for ). The constant is calculated from Kawaler (1988) to be s.
The value of the saturation threshold for solar mass stars with a solar convective overturn time has been shown to lie in the range 5–20 (Patten & Simon 1996). The value of scales as the inverse of the stellar convective overturn time scale (the Rossby scaling), which is a function of stellar mass. Sills, Pinsonneault, & Terndrup (2000) demonstrated that this scaling breaks down for stars lower than 0.5 M⊙. These authors empirically measured the mass dependence of for low-mass stars by comparing models to observations of the rapidly rotating stars in open clusters.
Since more data from the Hyades has become available (Terndrup et al. 2000; Reid & Mahoney 2000), we will take only the relative values of as a function of mass found by Sill, Pinsonneault, & Terndrup, and allow the zero point of the relation to vary to determine the best values (see §3.1). In our presentation of results, we will show models for four different zero points. To distinguish between these different normalizations, they will always be referred to by the value of at 0.5 M⊙(see column 1 in Table 1 for these values). For M⊙ , the values of for 0.4, 0.3, and 0.2 M⊙ are 2.7, 1.9, and 1.2 respectively. The numbers for these masses scale linearly with the values of M⊙ shown in Table 1.
Since the convective time scale of the stars in our mass range remains nearly constant between the ages of the Pleiades and Hyades, our assumption that is a constant for a given mass is valid. During the pre-MS phase, convective overturn time scales are longer, and our method will tend to overestimate the effect of stellar winds, since longer convective times will lower and stars at this stage of evolution should spend more time in the saturated regime. This will not significantly affect our results, but places tighter limits on the ability of stellar winds to reduce angular momentum in pre-MS stars.
2.2 Incorporating Observational Data
The initial conditions for our model are the masses, ages, and periods of the stars in the ONC, and a distribution of disk-locking lifetimes. We used the photometric periods listed in HRHC. We chose the periods in this paper because the stars have been observed over multiple seasons (the total range of the observations is from 1990–1999), which reduces the probability of falsely detecting a period to a negligible value. Also, as discussed by HRHC, some of the data in SMMV were outside the dynamical boundaries of the ONC, possibly including stars of different ages than the ONC. The HRHC observations were made continuously within each observing season (weather permitting), which permits the reliable detection of periods longer than 8 days. At periods below this value, there is significant overlap between these data and SMMV. In the overlap, there is good agreement between the two sets of data. For comparison, we also considered several analytic initial period distributions: a flat distribution from 1 to 12 days, a delta function at 8 days, and a Gaussian curve centered on 8 days with a standard deviation of 4 days, truncated at 1 and 15 days.
Masses and ages for the HRHC stars were obtained from Hillenbrand (1997), which were interpolated from the stellar evolutionary tracks of D’Antona & Mazzitelli (1994). This gave us a sample of 81 stars in the mass range 0.2–0.5M⊙. For stars where ages were not available, the mean age of the cluster, 1 Myr, was used. Our calculations are not sensitive to the minor age spread in the ONC, and running our models with all stars having an age of 1 Myr did not significantly change the results.
To investigate the effect of disk-locking with our models, we used a variety of values for and for the distribution of of disk lifetimes, . First, we used a model in which there were no disks, and models in which all stars had disks with the same . Then we implemented a model for motivated by recent observations of young clusters. Haisch, Lada & Lada (2001) reported results of JHKL photometry of clusters ranging in mean age from 0.5–5 Myr. They examined the fraction of stars in each cluster with the infrared excess indicative of cicrumstellar disks. The initial disk fraction is very high ( 80%) and decreases linearly with age to an extrapolated maximum disk lifetime of 6 Myr. Their results imply that all stars are born with accretion disks around them and that the spectrum of disk lifetimes is flat in this range of 0–6 Myr.
With the initial conditions of mass, age, and initial period, the rotation of an observed star can be computed at any future time for a given and . At the age of the Pleiades, the projected period of the ONC star is converted to an equatorial rotation velocity and then multiplied by a random , generated by producing a random number and calculating . This allows for statistical comparison between the modeled ONC and the observed distribution of from the Pleiades taken from Terndrup et al. (2000).
To test the hypothesis that the projected distributions of created by our models are inconsistent with an observed distribution, two-distribution K-S tests were used. We defined limits of P (99% confidence level) and P (90% confidence level) for rejecting the hypothesis that the two distributions are taken from the same parent distribution. These limits are arbitrary, but the K-S test was used extensively in our results and these limits add consistency and show how our results are constrained at different confidence levels.
3 Evolving Open Clusters Forward in Time
The two angular momentum loss mechanisms described in §2.1 affect stars on different time scales. Therefore we applied our technique to systems at very different ages. To evaluate the stellar wind angular momentum loss rates without the use of disk-locking, we computed the expected distribution of rotation rates for the Pleiades cluster at 600 Myr. In these models, presented in §3.1, the value of was varied and the resulting rotational distributions were compared to the Hyades data. We then constructed models projecting the ONC forward to the age of the Pleiades. These models, presented in §3.2, varied both and . We present the results of models that take as a constant and then employ the distribution of disk lifetimes motivated by observations.
The models presented in §3.2 make no prior assumptions about the angular momentum loss of a star in the ONC between the birthline and the current epoch. We did not assume that the slow rotators are disk-locked and the rapid rotators are free of their disks. All stars of any period are equally likely to have an accretion disk of a given lifetime. We argue that this is consistent with the observations of SMMV but with a very different interpretation than theirs. To check our results against this effect, §3.3 presents a model of the ONC which used the additional initial condition of the infrared data of Hillenbrand et al. (1998) to infer which ONC stars can be allowed to have disks. In §3.4 we will present models that start at the birthline and use various initial period distributions, comparing these models both to the ONC and the Pleiades.
3.1 Projecting the Pleiades to the Hyades
To model the evolution of rotation rates in the Pleiades, the same mass range of 0.2–0.5 M⊙ was used, as well as the same procedure as described above for the ONC stars, but using as an initial condition rather than rotation period. Since the age of the Pleiades is much greater than the time scale for disk lifetimes, disks will have little effect on the evolution of these stars. These calculations place strong constraints on the saturation threshold, . Since both the Pleiades and Hyades data are subject to inclination effects, projecting the Pleiades stars forward gives an expected distribution of , which is what we have to compare from the Hyades (also taken from Terndrup et al. 2000222 This calculation is similar to the one described §4 of Terndrup et al. (2000) for stars less massive than 0.4 M⊙. But it differs from the calculation in this paper in that homologous contraction was assumed for all stars as they evolved. It was also assumed that all stars were in the saturated regime during their evolution. ). The detection limit for the Hyades observations was km s-1, so this number was used as a minimum value for the evolved Pleiades stars. Figure 1 shows the expected distribution of the Pleiades for four values of . Values of , and are excluded by K-S tests at 99% confidence, while has a K-S probability above both limits. At the 90% confidence level, the allowed range of saturation thresholds is at 0.5 M⊙. We adopted 5.4 as our best value, but for the models of the ONC, we still considered a range of values to test the sensitivity of these calculations to the choice of .
3.2 Projecting the ONC to the Pleiades
The observations of circumstellar disks suggest that these disks do not typically exist far beyond ages of 6 Myr. For our initial models of ONC, we chose values of of 0, 3, and 6 Myr. The choice of Myr is motivated to test the idea that stellar winds alone can account for the angular momentum loss between 1 and 120 Myr. Disks of 6 Myr and 3 Myr were chosen to explore the maximally allowed and intermediate scenarios respectively. The four values of used in §3.1 were also used here. The combination of these parameters gives us 12 different angular momentum loss rates. Figure 2 shows the cumulative distribution of for the low-mass ONC stars projected forward to an age of 120 Myr for these models. Figure 2 is a grid of different models, with the rows being saturation thresholds of 1.8, 3.6, 5.4, and 7.2 , and the columns being disk locking lifetimes of 0, 3, and 6 Myr.
| M | = 0 Myr | = 3 Myr | = 6 Myr |
|---|---|---|---|
| 1.8 | 0.31 | ||
| 3.6 | 0.97 | ||
| 5.4 | 0.11 | ||
| 7.2 | 0.11 |
Table 1 shows the values returned by the K-S test for all twelve panels in Figure 2. The distributions in the first column, showing the projections of the ONC at an age of 120 Myr with no disk locking, are not compatible with the observed distribution of the Pleiades at 99% confidence. Indeed, a significant fraction of the stars would be rotating at or near breakup velocity. The projections shown in the panels in the right-hand column, where all stars had disks that lasted for 6 Myr, are also excluded at the same confidence. The results of the models for 3 Myr disks are quite good, with K-S values above the 0.1 level for all four values of . However, to assume that all stars are locked to disks of the same lifetime is too simplistic to be taken as a realistic model, and it does not agree with independent direct estimates of accretion disk lifetimes. But Figure 2 clearly shows that angular momentum loss through magnetic stellar winds alone cannot account for the observations in young stellar clusters, even when the entire range of possible values for is explored. An additional loss mechanism is required.
To implement the distribution of disk lifetimes discussed in §2.2, we created Monte Carlo simulations of the expected distribution of the ONC at 120 Myr in which could vary for each star. In these simulations each ONC star was projected forward in time with an of 5.4 , a randomly sampled disk lifetime in the range 0 to , and a randomly generated . For a model where Myr, we performed 1000 simulations and compared the average distribution to the distribution of the Pleiades. These two distributions are plotted in Figure 3. For comparison, Figure 4 plots versus mass for a sample simulation from the 1000 that were generated, as well as for a model which contained no disk-locking. This figure also includes a plot of versus mass for the Pleiades observations.
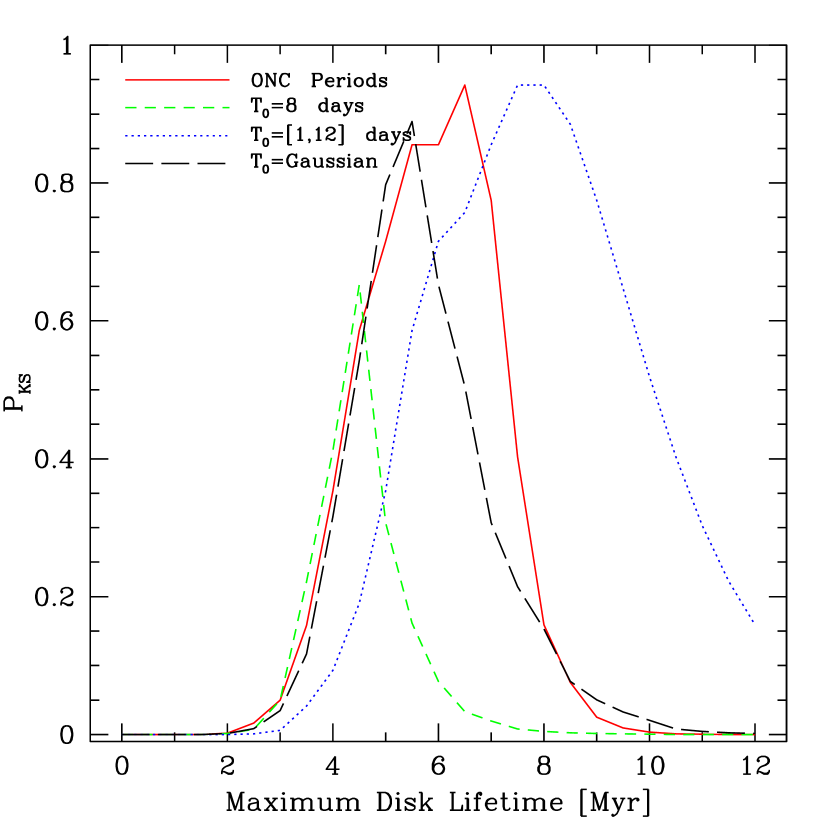
The maximum age to which accretion disks can live and also still govern the rotation of the star is an important and unresolved question. We ran a series of Monte Carlo simulations in which the maximum disk lifetime varied from 0 Myr (no disks) to a distribution that reaches to 12 Myr. Figure 5 shows the results of the simulations. For each maximum disk lifetime, we ran 1000 Monte Carlo simulations and compared the average distribution to the Pleiades with two-distribution K-S tests. As can be seen in Figure 5, distributions of disks in which the maximum lifetime is below 3 Myr are excluded at 99% confidence, as well as maximum disk lifetimes above 9 Myr. The region of high K-S probability centers at 6.5 Myr, which is in good agreement with the observations. The range of maximum disk lifetimes above the 90% rejection level is Myr Myr.
3.3 Using Individual Stellar IR Data
It is important to determine if our model of the ONC is consistent when adopting the added constraint of the individual infrared measurements for each star used in our sample. We incorporated the IR excess data from Hillenbrand et al. (1998) that was used in both HRHC and SMMV to distinguish between stars with and without disks. The ONC was once again projected to the time of the Pleiades, using the infrared data as an additional input parameter. Stars with IR excess (I-K) were allowed to have disks with lifetimes in the range to . Stars with (I-K) below this threshold were evolved with stellar winds only. For the stars with no IR data (10% of the sample) disks were randomly sampled from the range 0 to . For 81 the stars used in this study, 70% had excess IR emission. The resulting expected ONC distribution for Myr was consistent with the Pleiades by K-S test.
For our sample of ONC stars, the two period distributions of stars above and below the IR limit are statistically indistinguishable by K-S test, although the mean period is slightly smaller for stars below the IR limit. Figure 6 shows the cumulative distributions for stars above and below the IR excess limit. The similarity of these two distributions shows that our prescription of assigning disks to stars regardless of IR data did not bias our results.
If our assumption is true that all stars are born while locked to disks, and if the diagnostic (I-K) is a true indicator of disks, then the distribution of periods for stars with (I-K) is a true sample of rotation periods at the birthline (since they are still locked to their disks, their periods are the same as they were at 0 Myr). As another test of our model, we used these stars above the IR limit as a birthline distribution and projected it forward to the time or Orion using a uniform distribution of disk lifetimes between 0 and 1 Myr. This projected distribution should be consistent with the ONC stars below the IR limit, since at the birthline they too had disks, but were released from them before the current age of the ONC. A K-S test shows these two distributions to be indistinguishable as well. If this same calculation is performed without disk-locking, however, distinct differences are seen between the expected period distribution and the observed distribution of stars below the IR limit. Even with the small statistics, a K-S test rejects the consistency of these distributions at 99% confidence. The cumulative period distributions calculated with these two models are also plotted in Figure 6. The small sample size inhibits any strong conclusions to be made from these tests; only 17 stars in our sample were below the IR excess limit. But the radical difference between the two models in Figure 6, and the difference between the no-disk model and the 17 stars below the IR limit, is apparent.
Though readily available, the use of (I-K) as a proxy for circumstellar disks is not as strong a criterion as other techniques. The observations of Haisch, Lada & Lada (2001) used JHKL-band photometry. The addition of the L-band in their analysis makes their results a more robust indicator of stars with circumstellar disks (Haisch, Lada & Lada 2000). Therefore we believe that future observational tests should utilize L-band data in order to provide a cleaner test for the presence of a massive disk.
3.4 Rotation of Stars at the Birthline
If stars at the birthline were all locked to accretion disks rotating at the canonical disk-locking period of 8 days, it would be difficult to explain the observations of either the ONC or the Pleiades together with the observed distribution of disk lifetimes. For a distribution of disk lifetimes ranging from 0–6 Myr, less than 1/6 of the stars in the ONC would have been released from their disks and had the opportunity to spin up, not enough stars to populate the rapid rotator portion of the HRHC data. We also compared what a population of stars, all disk-locked with an initial period of 8 days, would look like at the time of the Pleiades using the same techniques described in §2.2. (We used the same sample of stars from the ONC as before, this time using the mass of the star only and assuming an age of 0 Myr.) The results are plotted in Figure 5, showing PKS versus maximum disk lifetime. The curve peaks sharply at 4.5 Myr and has a narrow range of inclusion. For comparison, the same calculation was performed for an initial distribution of periods that was uniform in the range 1–12 days. It is plotted on Figure 5 as well. At the time of the Pleiades, an initially flat distribution of periods is compatible with a maximum disk lifetime of 6 Myr. Maximum disk lifetimes below 3 Myr are excluded just as with the ONC data, but a flat period distribution does not place strict upper limits on . The presence of rapid rotators at the birthline creates a need for long-lifetime disks. The period distribution presented in SMMV, which was shown to be consistent with a uniform distribution, would also require longer disk-locking lifetimes.
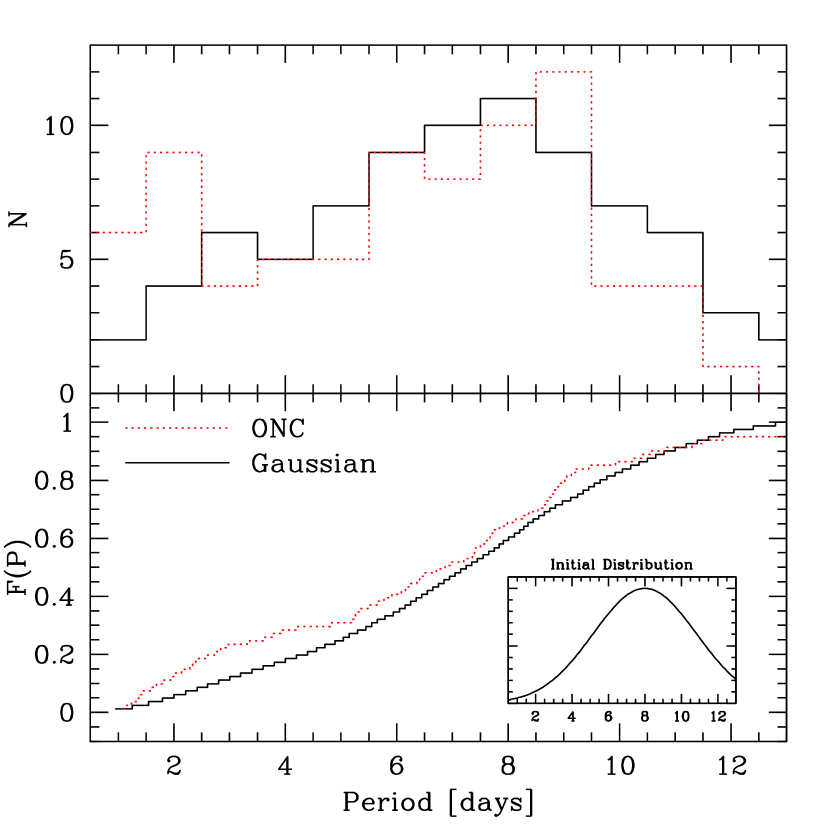
A uniform period distribution and a delta function at 8 days are extreme possibilities for rotation periods at the birthline. Even though a value of 8 days is preferred by disk locking theories, the variables which are used to calculate the rotation of the accretion disk may vary, and it is more realistic to assume that the initial distribution of periods would be a Gaussian. A distribution of this form centered on 8 days with a standard deviation of 4 days (cut off below 1 day and above 15 days) was evolved from the birthline to the Pleiades, once again using the masses of the ONC stars. The results, plotted on Figure 5, strongly exclude low and high values for the maximum disk lifetime, with an area of inclusion centered on 5.5 Myr. It is possible to compare the period distribution of the ONC to the Gaussian birthline distribution as well. Figure 7 shows this comparison. The cumulative distributions, shown in the lower panel, have a P. Our choice of 8 days as the mean period was obviously motivated by theoretical preferences and to provide a good fit to the HRHC data. It is possible to lower this mean down to 6.5 days and still achieve similar results.
4 Discussion
It is an inherent assumption throughout this paper that when the ONC reaches an age of 120 Myr it should look like the Pleiades as seen today, i.e. that they have the same initial conditions, disk lifetimes, and wind properties. There are uncertainties in the comparison of two different clusters; the mass functions could differ significantly, different formation mechanisms or environments could lead to different evolutionary patterns, and the observations of each cluster may have systematic differences. But by restricting our calculations to a narrow range in mass in which stars rotate as solid bodies and evolve through the pre-MS phase in similar time scales, the comparison is valid and useful.
The models of the later-age Pleiades cluster are very effective at placing limits on the saturation threshold, but say little about disk-locking lifetimes. The models of the ONC are relatively indifferent to the choice of , producing rotational distributions that are similar for models where nearly all stars are in the saturated regime the majority of the time (1.8 ), and models in which only the rapid rotators become saturated (7.2 ). Instead, for the ONC models, the dominant variable is the disk-locking lifetime, even though the maximum allowed is much smaller than the age of the Pleiades.
Our results show that it is difficult, if not impossible, to reconcile the observed amount of angular momentum loss between the ages of the ONC and the Pleiades without the use of a loss mechanism in addition to stellar magnetic winds. This result is similar to that found by Rebull et al (2001), in which they analyzed ONC stars of a larger mass range. In §2.1 we stated that our prescription for would tend to overestimate the effects stellar winds during the pre-MS. Since the models of the ONC presented in the first column of Figure 2 all fail to match the Pleiades, even with this overestimated loss rate, the conclusion that stellar winds alone cannot explain the observed rotation rates is strengthened.
If the additional loss mechanism is disk locking, it is also difficult to reconcile the observations if the disk lifetimes are always less than 3 Myr or can be greater than 8 Myr. The intersection of the constraints made by the ONC and Pleiades models give us the parameters of and Myr for our preferred model. This model, however, is not a unique solution to the problem. For example, the column of models in Figure 2 where = 3 Myr for all stars could not be excluded by K-S test at our defined limits. It is strictly an observational constraint on from IR data that this model is considered invalid.
Different distributions with other functional forms of or , combined with different initial conditions such as those presented in §4.3, can be constructed to compare to the data as well. Further constraints on disk lifetimes and the initial period distribution can only be made through larger statistical samples. The number ONC stars with photometric periods will soon be increased by 400 (Herbst et al. 2001). With this expanded data set, tests like those in §3.4 will become a powerful tool in constraining angular momentum loss through disk-locking.
One of the reasons for the recent controversy over the observations of the ONC, namely the bimodal period distribution, is not evident in the subset of the HRHC data used in this paper. As shown in Figure 7, the ONC periods used were consistent with the Gaussian birthline model presented in §3.4. At our defined levels of acceptance, the K-S test does not rule out the hypothesis that the observational distribution was drawn from a uniform distribution as well.
Our preferred model does not predict that a bimodal distribution would be apparent at 1 Myr for this range of masses. The results reported in Herbst et al. (2001) shows that the mean period of stars in the ONC is mass dependent. The bimodal period distribution could then be an effect of plotting a wide range of masses in one histogram. The high mass stars have different evolutionary time scales, internal angular momentum transport, and possibly different disk-locking lifetimes or initial conditions. The aforementioned increase in the ONC period sample would allow smaller ranges of mass to be grouped together in order to test these effects.
Our model does predict that the rotation rates of a cluster in the later stages of the distribution of disk lifetimes, such as NGC 2264 and NGC 2362 (3.2 and 5.0 Myr respectively), would show a bimodality caused by the spin-up of stars released from their disks. Photometric period observations of clusters such as these would be key to further constraints on disk-locking lifetimes. Another important test would be to incorporate observations of a cluster just beyond the observed maximum disk lifetime. Rotational measurements of stars at this age would constrain by comparing models of younger clusters using the method presented here. Observations at this age would place further constraints on loss rates from stellar winds since this mechanism would have to account for all the angular momentum loss from that point to the Pleiades and Hyades.
References
- (1) Allain, S., Fernandez, M., Martin, E.L., & Bouvier, J. 1996, A&A, 314, 173
- (2) Allain, S. 1998, A&A, 333, 629
- (3) Attridge, J.M., & Herbst, W. 1992, ApJ, 398, L61
- (4) Barnes, S., Sabatino, S., & Pinsonneault, M. 2001, ApJ, in press, (atro-ph/0101560)
- (5) Bouvier, J., Bertout, C., Benz, W., & Mayor, M. 1986, A&A, 165, 110
- (6) Choi, P.I., & Herbst, W. 1999, AJ, 111, 283
- (7) Collier Cameron, A., & Campbell, C.G. 1993, A&A, 274, 309
- (8) D’Antona, F., & Mazzitelli, I. 1994, ApJS, 90, 467
- (9) Guenther, D.B., Demarque, P., Kim, Y., & Pinsonneault, M.H. 1992, ApJ, 387, 372
- (10) Gruzinov, A., & Bahcall, J. 1998, ApJ, 504, 996
- (11) Haisch, K.E., Lada, E.A., & Lada, C.J. 2001, ApJL, in press, (astro-ph/0104347)
- (12) Haisch, K.E., Lada, E.A., & Lada, C.J. 2000, AJ, 120, 1396
- (13) Hartmann, L.W., Hewett, R., Stahler, S., & Mathieu, R.D. 1986, ApJ, 309, 275.
- (14) Herbst, W., Bailer-Jones, C.A.L., & Mundt, R. 2001, ApJ, 554, L197
- (15) Herbst, W., Rhode, K.L., Hillenbrand, L.A., & Curran, G. 2000, AJ, 119, 261 (HRHC)
- (16) Hillenbrand, L.A. 1997, AJ, 113, 1733
- (17) Hillenbrand, L.A., et al. 1998, AJ, 116, 1816
- (18) Kawaler, S.D. 1988, ApJ, 333,236
- (19) Keppens, R., MacGregor, K.B., & Charbonneau, P. 1995, A&A, 294, 469
- (20) Königl, A. 1991, ApJ, 370, L39
- (21) Krishnamurthi, A., Pinsonneault, M.H., Barnes, S., & Sofia, S. 1997, ApJ, 480, 303
- (22) Kim, Y.C., & Demarque, P. 1996, ApJ, 457, 340
- (23) MacGregor, K.B., & Brennan, M. 1991, ApJ, 376, 204
- (24) Palla, F., & Staller, S.W. 1991, ApJ, 375, 288
- (25) Patten, B., & Simon, T. 1996, ApJS, 106, 489
- (26) Rebull, L.M., Wolff, S.C., Strom, S.E., & Makidon, R.B. 2001, ApJL, submitted, (astro-ph/0105542)
- (27) Reid, I.N. & Mahoney, S. 2000, MNRAS, 316, 827
- (28) Saumon, D., Chabrier, G., & van Horn, H.M. 1995, ApJS, 99, 713
- (29) Schatzman, E. 1962, Ann. d’Ap., 25, 18
- (30) Shu, F., et al. 1994, ApJ, 492, 781
- (31) Sills, A., Pinsonneault, M.H., & Terndrup, D.M. 2000, ApJ, 534, 335
- (32) Stassun, K.G., Mathieu, R.D., Mazeh, T., & Vrba, F.J. 1999, AJ, 117, 2941 (SMMV)
- (33) Stauffer, J.R., & Hartmann, L.W. 1986, PASP, 98, 1233
- (34) Stauffer, J.R., & Hartmann, L.W. 1987, ApJ, 318, 337
- (35) Stauffer, J.R., Hartmann, L.W., & Latham, D.W. 1987, ApJ, 320, 51L
- (36) Terndrup, D.M., et al. 2000, AJ, 119, 1303
- (37) Vogel, S.N., & Kuhi, L.V. 1981, ApJ, 245, 960
- (38) Weber, E.J., & Davis, L. Jr. 1967, ApJ, 148, 217
- (39)