One year of Galileo dust data from the Jovian system: 1996
H. Krügera111Correspondence to: Harald.Krueger@mpi-hd.mpg.de, E. Grüna, A. Grapsa, D. Bindschadlerb, S. Dermottc, H. Fechtiga, B. A. Gustafsonc, D. P. Hamiltond, M. S. Hannerb, M. Horányie, J. Kisself, B. A. Lindbladg, D. Linkerta, G. Linkerta, I. Mannh,i, J. A. M. McDonnellj, G. E. Morfillf, C. Polanskeyb, G. Schwehmi, R. Sramaa, and H. A. Zookk222Passed away on 14 March 2001
| a) | Max-Planck-Institut für Kernphysik, 69029 Heidelberg, Germany |
| b) | Jet Propulsion Laboratory, Pasadena, California 91109, USA |
| c) | University of Florida, Gainesville, FL 32611, USA |
| d) | University of Maryland, College Park, MD 20742-2421, USA |
| e) | Laboratory for Atmospheric and Space Physics, Univ. of Colorado, Boulder, |
| CO 80309, USA | |
| f) | Max-Planck-Institut für Extraterrestrische Physik, 85748 Garching, Germany |
| g) | Lund Observatory, 221 Lund, Sweden |
| h) | Institut für Planetologie, Universität Münster, 48149 Münster, Germany |
| i) | ESTEC, 2200 AG Noordwijk, The Netherlands |
| j) | Planetary and Space Science Research Institute, The Open University, |
| Milton Keynes, MK7 6AA, UK | |
| k) | NASA Johnson Space Center, Houston, Texas 77058, USA |
Abstract
The dust detector system onboard Galileo records dust impacts in circumjovian space since the spacecraft has been injected into a bound orbit about Jupiter in December 1995. This is the sixth in a series of papers dedicated to presenting Galileo and Ulysses dust data. We present data from the Galileo dust instrument for the period January to December 1996 when the spacecraft completed four orbits about Jupiter (G1, G2, C3 and E4). Data were obtained as high resolution realtime science data or recorded data during a time period of 100 days, or via memory read-outs during the remaining times. Because the data transmission rate of the spacecraft is very low, the complete data set (i. e. all parameters measured by the instrument during impact of a dust particle) for only 2% (5353) of all particles detected could be transmitted to Earth; the other particles were only counted. Together with the data for 2883 particles detected during Galileo’s interplanetary cruise and published earlier, complete data of 8236 particles detected by the Galileo dust instrument from 1989 to 1996 are now available. The majority of particles detected are tiny grains (about 10 nm in radius) originating from Jupiter’s innermost Galilean moon Io. These grains have been detected throughout the Jovian system and the highest impact rates exceeded . A small number of grains has been detected in the close vicinity of the Galilean moons Europa, Ganymede and Callisto which belong to impact-generated dust clouds formed by (mostly submicrometer sized) ejecta from the surfaces of the moons (Krüger et al., Nature, 399, 558, 1999). Impacts of submicrometer to micrometer sized grains have been detected thoughout the Jovian system and especially in the region between the Galilean moons.
1 Introduction
In December 1995, Galileo became the first artifical satellite to orbit Jupiter. The main goals of the Galileo mission are the exploration of the giant planet itself, its four Galilean satellites and its huge magnetosphere. Galileo carries a highly sensitive impact ionization dust detector on board, which is a twin of the dust detector on the Ulysses spacecraft [Grün et al., 1992a, Grün et al., 1992b, Grün et al., 1995c]. Dust data from both spacecraft have been used many times for the analysis of e. g. the interplanetary dust complex, dust related to asteroids and comets, interstellar dust grains sweeping through the solar system, and streams of dust particles originating from the Jupiter system. Here we recall only publications which are related to dust in the Jupiter system. See Krüger et al. [Krüger et al., 1999b, Krüger et al., 1999d] for a summary of references to other works.
Streams of dust particles originating from the Jovian system have been discovered with the Ulysses detector [Grün et al., 1993] and later been confirmed by Galileo [Baguhl et al., 1995, Grün et al., 1996a]. The first dust detection with Galileo in the Jupiter system itself was reported from Galileo’s initial approach to Jupiter and Io fly-by in December 1995 [Grün et al., 1996b]. At least three different types of dust particles have been identified in the Jupiter system [Grün et al., 1997, Grün et al., 1998]: 1. Streams of dust particles with high and variable impact rates throughout Jupiter’s magnetosphere. The particles are about 10 nm in diameter [Zook et al., 1996, Liou, 1997] and they originate from the innermost Galilean satellite Io [Krüger et al., 1999a, Graps et al., 2000]. Because of their small sizes the particles strongly interact with Jupiter’s magnetosphere [Horányi et al., 1997, Heck, 1998]. These streams of particles have been used to analyse the field of view of the dust detector [Krüger et al., 1999d] at a level of detail which could not be achieved during ground calibration. 2. Sub-micrometer grains which form dust clouds surrounding the Galilean moons [Krüger et al., 1999e, Krüger et al., 2000]. These grains are ejected from the satellites’ surfaces by hypervelocity impacts of interplanetary dust particles. 3. Bigger micrometer-sized grains forming a tenuous dust ring between the Galilean satellites. This third group is composed of two sub-populations, one orbiting Jupiter on prograde orbits and a second one on retrograde orbits [Colwell et al., 1998, Thiessenhusen et al., 2000]. Most of the prograde population is maintained by grains escaping from the clouds surrounding the Galilean satellites [Krivov et al., 2001].
This is the sixth paper in a series dedicated to presenting both raw and reduced data from the Galileo and Ulysses dust instruments. The reduction process of Galileo and Ulysses dust data has been described by Grün et al. [Grün et al., 1995c] (hereafter Paper I). In Papers II and IV [Grün et al., 1995a, Krüger et al., 1999b] we present the Galileo data set spanning the six year time period October 1989 to December 1995. Papers III and V [Grün et al., 1995b, Krüger et al., 1999d] discuss the five years of Ulysses data from October 1990 to December 1995. The present paper extends the Galileo data set from January to December 1996, which is part of Galileo’s prime Jupiter mission. A companion paper [Krüger et al., 2001] (Paper VII) details Ulysses’ measurements from 1996 to 1999.
The main data products are a table of the number of all impacts determined from the accumulators of the dust instrument and a table of both raw and reduced data of all “big” impacts received on the ground (the term “big” applies to impacts in ion amplitude ranges AR2 to AR6; see Section 3 in this paper and Paper I for a definition of the amplitude ranges). The information presented in this paper is similar to data which we are submitting to the various data archiving centers (Planetary Data System, NSSDC). The only difference is that the paper version does not contain the full data set of the large number of “small” particles (amplitude range AR1), and the numbers of impacts deduced from the accumulators are typically averaged over one to several days. Electronic access to the complete data set including the numbers of impacts deduced from the accumulators in full time resolution is also possible via the world wide web: http://www.mpi-hd.mpg.de/dustgroup/.
This paper is organised similarly to our previous papers. Section 2 gives a brief overview of the Galileo mission until the end of 1996, the dust instrument and lists important mission events in 1996. A description of the new Galileo dust data set for 1996 together with a discussion of the detected noise and dust impact rates is given in Sect. 3. Section 4 analyses and discusses various characteristics of the new data set. Finally, in Sect. 5 we discuss results of the Jovian dust complex achieved with the new data set.
2 Mission and instrument operations
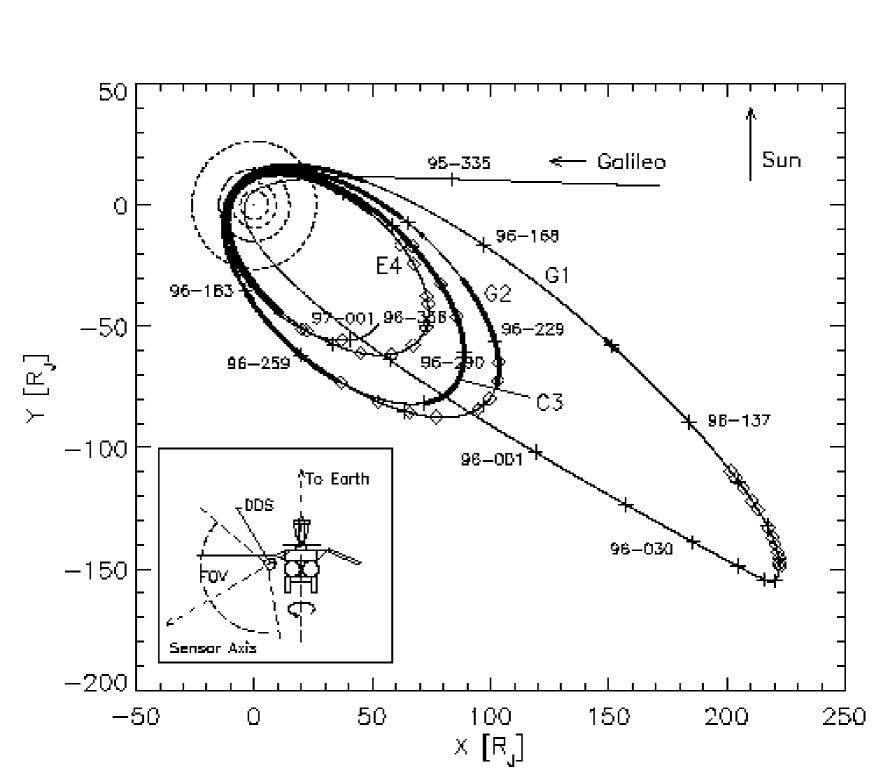
Galileo was launched on 18 October 1989. Two fly-bys at Earth and one at Venus between 1990 and 1992 gave the spacecraft enough energy to leave the inner solar system. During its interplanetary voyage Galileo had close encounters with the asteroids Gaspra and Ida. On 7 December 1995 the spacecraft arrived at Jupiter and was injected into a highly elliptical orbit about the planet. Galileo’s trajectory during its orbital tour about Jupiter from December 1995 to early January 1997 is shown in Fig. 1. Galileo now performs regular close fly-bys of Jupiter’s Galilean satellites. Four such encounters occurred in 1996 (two at Ganymede, one at Callisto and one at Europa, see Tab. 1). Galileo orbits are labelled with the first letter of the Galilean satellite which was the encounter target during that orbit, followed by the orbit number. For example, “E4” refers to Galileo’s fourth orbit about Jupiter which had a close fly-by at Europa. Satellite fly-bys occurred within two days of Jupiter closest approach (pericenter passage). A detailed description of the Galileo mission and the spacecraft have been given by Johnson et al. [Johnson et al., 1992] and D’Amario et al. [D’Amario et al., 1992].
Insert Fig. 1
Galileo is a dual spinning spacecraft with an antenna that points antiparallel to the positive spin axis. During most of the initial 3 years of the mission the antenna pointed towards the Sun (see Paper II). Since 1993 the antenna has usually been pointing towards Earth. Deviations from the Earth pointing direction in 1996, which is the time period considered in this paper, are shown in Fig. 2. Sharp spikes in the pointing deviation occurred when the spacecraft was turned away from the nominal Earth direction for dedicated imaging observations with Galileo’s cameras or for orbit trim maneuvers with the spacecraft thrusters. These spikes lasted typically several hours (see Tab. 1).
Insert Fig. 2
The Dust Detector System (DDS) is mounted on the spinning section of Galileo and the sensor axis is offset by an angle of from the positive spin axis (an angle of has been erroneously stated earlier). A schematic view of the Galileo spacecraft and the geometry of dust detection are shown in the inset of Fig. 1 (see also Paper IV and Grün et al. [Grün et al., 1998]).
The rotation angle measures the viewing direction of the dust sensor at the time of a dust impact. During one spin revolution of the spacecraft the rotation angle scans through a complete circle of . At rotation angles of and the sensor axis lies nearly in the ecliptic plane, and at it is close to the ecliptic north direction. DDS rotation angles are taken positive around the negative spin axis of the spacecraft. This is done to easily compare Galileo spin angle data with those taken by Ulysses, which, unlike Galileo, has its positive spin axis pointed towards Earth. DDS has a wide field of view, although a smaller field of view applies to a subset of dust impacts – the so-called class 3 impacts [Krüger et al., 1999c]. During one spin revolution of the spacecraft the sensor axis scans a cone with opening angle towards the anti-Earth direction. Dust particles which arrive from within of the positive spin axis (anti-Earth direction) can be detected at all rotation angles, whereas those that arrive at angles from to from the positive spin axis can be detected over only a limited range of rotation angles.
In June 1990 DDS was reprogrammed for the first time after launch and since then the DDS memory can store 46 instrument data frames (with each frame comprising the complete data set of an impact or noise event, consisting of 128 bits, plus ancillary and engineering data; see Papers I and II). DDS time-tags each impact event with an 8 bit word allowing for the identification of 256 unique times. Since 1990 the step size of this time word is 4.3 h. The total accumulation time after which the time word is reset and the time labels of older impact events become ambiguous is days.
During most of the interplanetary cruise (i. e. before 7 December 1995) we received DDS data as instrument memory-readouts (MROs). MROs return event data which have accumulated in the instrument memory over time. The contents of all 46 instrument data frames of DDS is transmitted to Earth during an MRO. If too many events occur between two MROs, the data sets of the oldest events become overwritten in the instrument memory and are lost.
Because the high-gain antenna of Galileo did not open completely, the on-board computer of the spacecraft had to be reprogrammed to establish a completely new telecommunications link. New flight-software was installed in the spacecraft computer in April and May 1996 [Statman and Deutsch, 1997] which provided a new mode for high-rate dust data transmission to the Earth, the so-called realtime science mode (RTS). In RTS mode, DDS data were read-out either every 7.1 or every 21.2 minutes, depending on the spacecraft data transmission rate, and were usually directly transmitted to Earth with a rate of 3.4 or 1.1 bits per second, respectively. For short periods (i.e. ) around satellite closest approaches, DDS data were collected with a higher rate of about 24 bits per second, recorded on the tape recorder (record mode) and transmitted to Earth several days to a few weeks later. Sometimes RTS data for short time intervals were also stored on the tape recorder and transmitted later but this did not change the labelling – they are called RTS.
In RTS and record mode only seven instrument data frames are read-out at a time and transmitted to Earth rather than the complete instrument memory. Six of the frames contain the information of the six most recent events in each amplitude range (see Paper I and Section 3 for a definition of the amplitude ranges). The seventh frame belongs to an older event read-out from the instrument memory (FN=7) and is transmitted in addition to the six new events. The position in the instrument memory from which this seventh event is read changes for each read-out so that after 40 read-outs the complete instrument memory gets transmitted (note that the contents of the memory may change significantly during the time period of 40 read-outs if high event rates occur). Although fewer data frames can be read-out this way at a time, the number of new events that can be transmitted to Earth in a given time period is much larger than with MROs because the read-outs occur much more frequently.
In 1996, RTS and record data were obtained during a period of 100 days (Fig. 1). During the remaining times when DDS was operated in neither RTS nor record mode, MROs occurred at several day intervals. Except before 29 March 1996 the MROs were frequent enough so that no ambiguities occurred in the time-tagging (i.e. MROs occurred at intervals smaller than 46 days).
Insert Tab. 1
Table 1 lists significant mission and dust instrument events for 1996. A comprehensive list of earlier events can be found in Papers II and IV. After Galileo’s Io and Jupiter fly-bys on 7 December 1995, the channeltron high voltage of DDS was switched off completely. More than three months later, on 27 March 1996, the instrument was reactivated and brought into the same nominal mode with which it was operated during most of Galileo’s interplanetary cruise to Jupiter: the channeltron voltage was set to 1020 V (HV = 2), the event definition status was set such that the channeltron or the ion-collector channel can independently initiate a measurement cycle (EVD = C,I) and the detection thresholds for the charges on the ion-collector, channeltron, electron-channel and entrance grid were set (SSEN = 0, 0, 1, 1). This was also the nominal configuration for most of the orbital tour in the Jovian system. Detailed descriptions of the symbols are given in Paper I.
When Galileo performed its first passage through the inner Jovian system after insertion into an orbit about Jupiter (G1 orbit, June 1996) DDS was operated in its nominal mode as described above. This was also the mode DDS was operated in during Galileo’s 6 year interplanetary cruise. In this mode high channeltron noise rates were recorded within about 20 distance from Jupiter (Jupiter radius, ) which reached values of up to 10,000 events per minute (Fig. 3). Because the time the onboard computer of DDS needs to process data from a single event (impact or noise) is about 10 msec [Grün et al., 1995c], significant dead time is produced when the event rate exceeds 6,000 per minute. Hence, only very few dust impacts could be recorded from day 179.5 to 181.0 in 1996. During all later orbits of Galileo’s prime Jupiter mission the event definition status and the detection threshold for the channeltron charge were changed within 18 (see Tab. 1). This reduced the noise sensitivity in the inner Jovian system and effectively prevented dead-time problems in the G2 and all later orbits.
Insert Fig. 3
During the Jupiter orbital tour of Galileo, orbit trim maneuvers (OTMs) have been executed around perijove or apojove passages to target the spacecraft to close encounters with the Galilean satellites. A few of these maneuvers required changes in the spacecraft attitude off the nominal Earth pointing direction (see Fig. 2). In one case, on 9 September 1996, the spacecraft was turned by . In addition, dedicated spacecraft turns occurred typically in the inner Jovian system within a few days around perijove to allow for imaging observations with Galileo’s cameras or to maintain the nominal Earth pointing direction. A large turn by off the Earth direction occurred on 8 November 1996. Both attitude changes on 9 September and 8 November were large enough that DDS could record impacts of dust stream particles at times when these particles would have been undetectable with the nominal spacecraft orientation [Grün et al., 1998].
A spacecraft anomaly occurred on 24 August 1996 and no dust data were obtained until 31 August when the spacecraft was recovered. Although the dust instrument continued to collect data they could not be transmitted to Earth and most of them were lost. The data set for only 5 grains detected in this time period was transmitted as data read from the instrument memory (FN=7).
DDS classifies and counts all registered events with 24 dedicated accumulators (see Section 3 and Paper I). During Galileo’s first orbits about Jupiter (G1, G2 and C3) unanticipated high rates occurred in two of the highest quality categories and unrecognized accumulator overflows may have occurred. To detect such overflows, DDS was reprogrammed on 4 December 1996 by adding two overflow counters. The details of this reprogramming and the significance of possible accumulator overflows are described in Section 3.
3 Impact events
DDS classifies all events – real impacts of dust particles and noise events – into one of 24 different categories (6 amplitude ranges for the charge measured on the ion collector grid and 4 event classes) and counts them in 24 corresponding 8 bit accumulators (Paper I). In interplanetary space most of the 24 categories described above were relatively free from noise and only sensitive to real dust impacts, except for extreme situations like the crossings of the radiation belts of Earth, Venus (Paper II) and Jupiter (Paper IV). During most of Galileo’s initial three years of interplanetary cruise only the lowest amplitude and class categories – AC01 (event class 0, amplitude range 1, AR1), AC11, and AC02 – were contaminated by noise events (Paper II). In July 1994 the onboard classification scheme of DDS was changed to identify smaller dust impacts in the data. With the modified scheme noise events were usually restricted to class 0 but may have occurred in all amplitude ranges. All events in higher quality classes detected in the low radiation environment of interplanetary space were true dust impacts (class 0 may still contain unrecognized dust impacts).
In the extreme radiation environment of the Jovian system, a different noise behaviour of the instrument was recognized: especially when Galileo was within about 20 from Jupiter the higher event classes were contaminated by noise (see also Paper IV). This noise, which affects class 1 and class 2, is unrelated to the channeltron noise shown in Fig. 3. In an analysis of the whole dust data set from Galileo’s prime Jupiter mission, noise events could be eliminated from class 2 [Krüger et al., 1999c]. Class 1 events, however, show signatures of being nearly all noise events in the Jovian environment. We therefore consider the class 3 and the denoised class 2 impacts as the complete set of dust data from Galileo’s Jupiter tour. Apart from a missing third charge signal – class 3 has three charge signals and class 2 only two – there is no physical difference between dust impacts categorized into class 2 or class 3.
In this paper the terms ”small“ and ”big“ have the same meaning as in Paper IV (which is different from the terminology of Paper II). We call all particles in class 2 and class 3 in the amplitude ranges 2 and higher (AR2 to AR6) ”big“. Particles in the lowest amplitude range (AR1) are called ”small“. This distinction separates the small Jovian dust stream particles from bigger grains which are mostly detected between and near the Galilean satellites.
In RTS and record mode the time between two readouts of the instrument memory determines the number of events in a given time period for which their complete information can be transmitted. Thus, the complete information on each impact is transmitted to Earth when the impact rate is below one impact per either 7.1 or 21.2 minutes in RTS mode or one impact per minute in record mode. If the impact rate exceeds these values, the detailed information of older events is lost because the full data set of only the latest event is stored in the DDS memory.
Furthermore, in these two modes the time between two read-outs also limits the accuracy with which the impact time can be determined. It is 7.1 or 21.2 minutes in RTS mode and about one minute in record mode, respectively. During times when only MROs occurred, the accuracy is limited by the increment of the DDS internal clock, i.e. 4.3 hours.
Because of the large differences in the timing accuracy in the various read-out modes, we have defined a new parameter, time error value – TEV, that determines the accuracy of the impact time of a dust particle in minutes. TEV has been rounded to the next higher integer. In RTS and record mode, TEV is usually simply the time between two read-outs, i.e. TEV = 8 or 22 min in RTS or TEV = 2 min in record mode, respectively. During gaps in the data transmission, i.e. when data packets were lost, multiples of these values occur. Usually, the given impact time of a dust particle is identical with the readout time of the instrument, which means that the impact has occurred some time in the period impact time minus TEV. This is the case for almost all impacts in AR2 to AR6 and more than 70% of the impacts in AR1. For example the impact of particle 3497 in Tab. 5 (TEV = 8 min) occurred between 96-180 10:06 and 96-180 10:14.
Data frames belonging to older events not transmitted immediately after impact but transmitted later (as the seventh event from each read-out, FN=7) have impact times interpolated to lie between the times of the two adjacent read-outs. Their TEV value is equal to the time interval between these adjacent read-outs. For MROs the impact time has been interpolated to the middle of the time interval defined by the DDS internal clock. The corresponding TEV is 259 min . For example, impact 3780 in Tab. 5 (TEV = 259 min) occurred at 96-241 23:55 min.
DDS records and counts the number of all dust particle impacts and noise events with 8 bit accumulators. The time between two readouts of the instrument memory determines the maximum rate which can unambiguously be derived from the accumulators. At rates below or in RTS mode and below in record mode the accumulator values transmitted to Earth represent the true event rates. During times of higher event rates an unknown number of accumulator overflows occurred which led to ambiguities in the number of events derived from the accumulators. Thus, the derived rates may be underestimated.
To cope with unanticipated high rates in the inner Jovian system (see Fig. 4 and Grün et al. [Grün et al., 1998]) DDS was reprogrammed on 4 December 1996. Two of the 24 accumulators (AC05 and AC06) were modified to count the number of accumulator overflows of the two highest quality classes in the lowest amplitude range (AC21 and AC31). Since then the maximum recordable rate in RTS mode is or , depending on the readout interval, and about in record mode. These rates have never been exceeded since the DDS reprogramming.
The collection of data mostly relied on MROs when DDS detected relatively low impact and noise rates. The timing accuracy of these events, however, is less precise (TEV = 259).
Insert Fig. 4
Table 2 lists the number of all dust impacts and noise events identified with the Galileo dust sensor in 1996 as deduced from the accumulators of classes 2 and 3. Depending on the event rate, the numbers are given in intervals from half a day to a few weeks (the numbers with the highest time resolution achievable are available in electronic form only and are provided to the data archiving centers). For these two classes with the lowest amplitude range AR1 the complete data set for only 2% of the detected events was transmitted, the remaining 98% of events were only counted. Nearly all data sets for events in higher amplitude ranges were transmitted, although a few were also lost in AR2 and AR3. We give only the number of events in classes 2 and 3 because they have been shown to contain real dust impacts: class 3 is practically noise free (although Krüger et al. [Krüger et al., 1999c] found indications for a very small number of noise events in class 3, AR1, in the inner Jovian system). Class 2 is strongly contaminated by noise events in the inner Jovian system (within about from Jupiter).
Insert Tab. 2
The data set we present here has been denoised according to the criteria derived by Krüger et al. [Krüger et al., 1999c]. The noise contamination factor for class 2 listed in Tab. 2 for the six different amplitude ranges has been derived with two different methods: for AR1 we use the procedure described by [Krüger et al., 1999c], i.e. a one day average of the ratio between the number of class 2 AR1 noise events and the total number of class 2 AR1 events (noise plus dust) for which the full data set is available. This defines the scaling factor with which the number AC21 of events derived has to be multiplied in order to get the number of noise events from the AC21 accumulator. It should be noted that the criteria applied to identify noise events in the DDS data have been derived with our present knowledge of the instrument behaviour in the Jovian environment. Future analyses may lead to an improved picture of the noise characteristics and to modified algorithms for noise rejection.
For the higher amplitude ranges AR2 to AR6 the full data set is available for most detected events. Thus, from the charge amplitudes and rise times we can determine for each accumulator increment listed in Tab. 2 whether it was due to a noise event or a dust impact. During time intervals when the complete data set for some but not all detected events was transmitted, has been calculated from those events for which the full data set is available and it has been assumed that this noise ratio applies to all events detected (i.e. also counted) in this time interval.
It should be noted that the noise identification criteria used here are exactly those derived in [Krüger et al., 1999c]. The analysis of the latest data after 1997 has shown that the noise behaviour of the dust sensor has changed due to instrument ageing (see Section 4). Different noise identification criteria have to be applied to later data. Data from 1996 published in this paper are not affected.
The noise identification criteria of Krüger et al. [Krüger et al., 1999c] which have been applied to the 1996 data have been developed to separate the tiny Jupiter stream particles from noise events. However, they do not work very well to distinguish secondary ejecta grains detected during close satellite fly-bys from noise events. We therefore applied a different technique to identify ejecta grains which is summarised in Tab. 3 and 4.
During all four satellite fly-bys in 1996 the detection geometry was such that ejecta grains could be detected from rotation angles only. During the fly-bys G1, G2 and E4 the impact direction (ROT) could be used as a good parameter to identify ejecta grains because stream particles and ejecta grains approached from opposite directions [Krüger et al., 1999e]. During the C3 fly-by, however, the stream particles approached from the same direction as the ejecta grains and the measured impact velocities of the dust particles had to be used as an additional parameter to identify the ejecta [Krüger et al., 2000]. The C3 fly-by velocity of Galileo was and we included only particles with a measured impact velocity below in the data set. For the Ganymede and Europa fly-bys we did not limit the velocity range of the grains.
For all four satellite fly-bys of 1996 we included only particles within the approximate Hill radius of the satellite, except for Europa where we used a larger altitude limit because the present data analysis indicates that this dust cloud may be more extended. Denoising has been shown to be important for class 2 in the inner Jovian system [Krüger et al., 1999c], i.e. within about from Jupiter. We therefore denoised the data from the Europa fly-by but did not denoise the data from the Ganymede and Callisto fly-bys. For denoising of the Europa data we used a slightly different noise separation scheme than Krüger et al. [Krüger et al., 1999c]. Events which fulfil the criteria listed in Tab. 4 have been rejected as noise.
Insert Tab. 3
Insert Tab. 4
During the first three passages through the inner Jovian system (G1, G2 and C3) an unknown number of accumulator overflows occurred in the lowest amplitude range, especially in class 2. Therefore, the numbers before the instrument reprogramming on 4 December 1996 given in Tab. 2 should be treated as lower limits, specifically when the corresponding rates are close to the maximum recordable rates described above. For numbers after 13 December 1996 (when the instrument was read out in RTS mode) overflows of the AC21 and AC31 accumulators are fully taken into account and the numbers given in Tab. 2 represent the true numbers of detected events. Between 4 and 13 December accumulator overflows are also taken into account but due to high dust impact rate and the instrument readout mode with memory readouts occurring at a few day intervals unrecognized overflows may also have happened. Thus, in this time interval impact rates should also be treated with caution.
To our present understanding the lower quality classes 0 and 1 contain only noise events and are therefore not considered here. Future efforts, however, may also lead to the identification of some dust impacts in these low quality classes.
The dust impact rate recorded by DDS in 1996 as deduced from the class 2 and 3 accumulators is shown in Fig. 4. The impact rate measured in the lowest amplitude range (AR1) and the one measured in the higher amplitude ranges (AR2 to AR6) are shown separately because they reflect two distinct populations of dust. AR1 contains mostly stream particles which have been measured throughout the Jovian system. Bigger particles (AR2 to AR6) have been mostly detected between the Galilean satellites. This is illustrated in the diagram: the impact rate for AR1 gradually increases when Galileo approaches the inner Jovian system, whereas it shows narrow peaks close to the perijove passages in the case of the bigger (AR2 to AR6) impacts. Diagrams showing the class 3 AR1 impact rate with a much higher time resolution and as a function of distance from Jupiter have been published by Grün et al. [Grün et al., 1998] and are not repeated here.
The impact rates of AR1 particles measured in the inner Jovian system reached maximum values of about during the G1, G2, and C3 orbits. These values are close to the saturation limit caused by unrecognized accumulator overflows (see above) and higher short-time peaks may have occurred. More than 100 impacts per minute have been detected in E4 (1996, day 350) which represents the highest impact rate recorded during Galileo’s prime mission. Such a high rate could only be recorded in RTS mode after the reprogramming on 4 December 1996.
Table 5 lists the data sets for all 95 big particles detected in classes 2 and 3 between January and December 1996 for which the complete information exists. Class 2 particles have been separated from noise by applying the criteria developed by Krüger et al. [Krüger et al., 1999c] except for the satellite fly-bys (see above). We do not list the small stream particles (AR1) in Tab. 3 because their masses and velocities are outside the calibrated range of DDS and they are by far too abundant to be listed here (secondary ejecta grains in AR1 are also omitted). The complete information of a total of 5258 small dust particles has been transmitted in 1996. The stream particles are believed to be about 10 nm in size and their velocities exceed [Zook et al., 1996]. Any masses and velocities derived for these particles with existing calibration algorithms would be unreliable. The full data set for all 5353 small and big particles is submitted to the data archiving centers and is available in electronic form. A total number of 9119 events (dust plus noise in all amplitude ranges and classes) were transmitted in 1996, each with a complete data set.
Insert Tab. 5
In Tab. 5 dust particles are identified by their sequence number and their impact time. Gaps in the sequence number are due to the omission of the small particles. The time error value (TEV) as defined above is listed next. Then the event category – class (CLN) and amplitude range (AR) – are given. Raw data as transmitted to Earth are displayed in the next columns: sector value (SEC) which is the spacecraft spin orientation at the time of impact, impact charge numbers (IA, EA, CA) and rise times (IT, ET), time difference and coincidence of electron and ion signals (EIT, EIC), coincidence of ion and channeltron signal (IIC), charge reading at the entrance grid (PA) and time (PET) between this signal and the impact. Then the instrument configuration is given: event definition (EVD), charge sensing thresholds (ICP, ECP, CCP, PCP) and channeltron high voltage step (HV). See Paper I for further explanation of the instrument parameters, except TEV which is introduced above.
The next four columns in Tab. 3 give information about Galileo’s orbit: ecliptic longitude and latitude (LON, LAT) and distance from Jupiter (, in ). The next column gives the rotation angle (ROT) as described in Sect. 2. Whenever this value is unknown, ROT is arbitrarily set to 999. This occurs 10 times in the full data set that includes the small particles. Then follows the pointing direction of DDS at the time of particle impact in ecliptic longitude and latitude (, ). When ROT is not valid and are also useless. Mean impact velocity (v) and velocity error factor (VEF, i.e. multiply or divide stated velocity by VEF to obtain upper or lower limits) as well as mean particle mass (m) and mass error factor (MEF) are given in the last columns. For VEF , both velocity and mass values should be discarded. This occurs for 8 impacts. No intrinsic dust charge values are given [Svestka et al., 1996].
Entries for the parameter PA in Tab. 3 sometimes have values between 49 and 63 although the highest possible value is 48 (Paper I). This is also inherent in all Galileo and Ulysses data sets published earlier (Papers II to V) and it is due to a bit flip. According to our present understanding the correct PA values are obtained by subtracting 32 from all entries which have values between 49 and 63. Values of 48 and lower should remain unchanged.
4 Analysis
The positive charge measured on the ion collector, , is the most important impact parameter determined by DDS because it is rather insensitive to noise. Figure 5 shows the distribution of for the full 1996 data set (small and big particles together). Ion impact charges have been detected over the entire range of six orders of magnitude the instrument can measure. One impact (or about 0.02% of the total) is close to the saturation limit of and may thus constitute a lower limit of the actual impact charge. The impact charge distribution of the big particles () follows a power law with index and is shown as a dashed line. This slope is close to the value of given for Galileo in Paper II for the inner solar system. It is flatter than the given for Ulysses in Paper III and the given for Galileo in Paper IV, which both mainly reflect the outer solar system. The slopes indicate that, on average, bigger particles have been detected in the inner solar system and in the Jovian system than in the interplanetary space of the outer solar system. This is in agreement with a smaller relative contribution of interstellar particles in the inner solar system and in the Jovian system. Note that the Jovian stream particles (AR1) have been excluded from the power law fit.
Insert Fig. 5
In Fig. 5 the small stream particles () are collected in two histogram bins. Their number per individual digital step is shown separately in Fig. 6 to analyse their behaviour in more detail. The distribution flattens for impact charges below . This indicates that the sensitivity threshold of DDS may not be sharp and it is consistent with the number of impacts with the lowest impact charges not being complete due to the low data transmission capability of Galileo. The impact charge distribution for small particles with follows a power law with index -4.5. This indicates that the size distribution of the small stream particles rises steeply towards smaller particles. It is much steeper than the distribution of the big particles shown in Fig. 5.
Insert Fig. 6
The ratio of the channeltron charge and the ion collector charge is a measure of the channeltron amplification A which is an important parameter for dust impact identification (Paper I). The in-flight channeltron amplification was determined in Papers II and IV for the initial six years of the Galileo mission to identify a possible degrading of the channeltron. For a channeltron high voltage of 1020 V (HV = 2) the amplification obtained for was and , respectively. Here we repeat the same analysis for the 1996 data set. Figure 7 shows the charge ratio as a function of for the same high voltage as in the previous papers. The charge ratio determined for is . This is close to the earlier values and shows that there is no ageing of the channeltron detectable. Channeltron ageing is seen in the data after 1996 which will be the subject of a future publication.
Insert Fig. 7
Figure 8 displays the calibrated masses and velocities of all 5353 dust grains detected in 1996. Impact velocities have been measured over almost the entire calibrated range from 2 to , and the masses vary over 8 orders of magnitude from to . The mean errors are a factor of 2 for the velocity and a factor of 10 for the mass. Impact velocities below about should be treated with caution. Anomalous impacts onto the sensor grids or structures other than the target generally lead to prolonged rise times of the charge signals. This in turn results in artificially low impact velocities and high dust particles masses.
Insert Fig. 8
The mass range populated by the particles is by two orders of magnitude smaller than that reported from the initial six years of the mission. The largest and smallest masses reported earlier, however, are at the edges of the calibrated velocity range of DDS and, hence, they are the most uncertain. Any clustering of the velocity values is due to discrete steps in the rise time measurement but this quantization is much smaller than the velocity uncertainty. Masses and velocities in the lowest amplitude range (AR1, particles indicated by plus signs) should be treated with caution. These are mostly Jovian stream particles for which we have clear indications that their masses and velocities are outside the calibrated range of DDS [Zook et al., 1996] (J. C. Liou, priv. comm.). The particles are probably much faster and smaller than implied by Fig. 8. On the other hand, the mass and velocity calibration is valid for the bigger particles [Krüger et al., 1999e, Krüger et al., 2000]. For many particles in the lowest two amplitude ranges (AR1 and AR2) the velocity had to be computed from the ion charge signal alone which leads to the striping in the lower mass range in Fig. 8 (most prominent above ). In the higher amplitude ranges the velocity could normally be calculated from both the target and the ion charge signal which leads to a more continuous distribution in the mass-velocity plane.
Although no ageing of the channeltron could be found from Fig. 7 with the 1996 data set, other indications for ageing of DDS caused by the effects of the harsh radiation environment in the inner Jovian magnetosphere have been found: (1) The measured instrument current, which had a constant value of about 77.5 mA during the interplanetary cruise of Galileo, began to drop by 3% per year when the spacecraft was injected into the Jovian system in December 1995. This drop is mostly likely caused by radiation-induced ageing of a resistor and is inherent to the measurement process itself rather than being related to a real drop in the instrument current. (2) Changes in the test pulses generated by the instrument-built in test pulse generator. (3) A drift in the mean target and ion collector rise time signals ET and IT. Although it is best recognized in the data set for AR1, it may also affect the higher amplitude ranges. This drift does not affect the calibration of the 1996 data set but it may have to be taken into account in the mass and speed calibration of later data. The consequences of these ageing effects are under investigation and will be the subject of a future paper.
5 Discussion
By far the largest number of particles in the 1996 data set presented here are tiny dust grains originating from Io [Horányi et al., 1997, Grün et al., 1998, Graps et al., 2000, Heck, 1998]. These grains almost exclusively populate amplitude range AR1 (see also Fig. 4, upper panel). They approach the sensor as collimated streams and their impact direction shows a characteristic behaviour that can only be explained by grains having a radius of about 10 nm and which strongly interact with the Jovian magnetosphere [Grün et al., 1998]. The impact direction of these grains is shown in the upper panel of Fig. 9. On the inbound trajectory, when Galileo approaches Jupiter, the grains were mainly detected from rotaton angles . This is best seen in the G2 and C3 orbits (1996, days 220 to 250 and 275 to 310) when we had continuous data coverage for the longest time period. One to two days before perijove passage the impact direction shifted by and the particles approached from . Rotation angles of and are close to the ecliptic plane. The detection geometry is also seen in Fig. 1.
Insert Fig. 9
The tiny dust stream particles could be used for an analysis of the sensitive area of the Galileo dust sensor [Krüger et al., 1999c] which could not be done during ground calibration. A detailed analysis of the distribution of the measured rotation angles showed that three of the other instruments on board Galileo obscure the field of view of the dust sensor. This can be seen in the upper panel of Fig. 9 (see also Krüger et al., [Krüger et al., 1999c]: there is a reduced number of particles with rotation angles in the G2 and C3 orbits when Galileo approaches Jupiter. This is best seen on days 200 to 225 and 270 to 285 in 1996. Fewer particles were detected in this time and rotation angle range with respect to the range and . This is caused by obscuration of the field of view.
Furthermore, the times of the onset of the dust impacts measured in classes 2 and 3 differ significantly which indicated that different sensitive areas apply to stream particles detected as class 2 or 3 impacts, respectively. The times of the onset, -shift and cessation of the dust streams are given in Tab. 6. Reliable onset times could be determined for class 3 and for orbits G2 and C3 only. For class 2 and for the other orbits no RTS data were obtained at the times of onset of the dust impacts. Note that Krüger et al. [Krüger et al., 1999c] used a larger data set for their analysis of the sensitive area of DDS which included data from 1997.
During the -shift the detection rate of class 3 dropped significantly whereas no such drop was seen in the class 2 impact rate. This is consistent with a reduced field of view for class 3 w.r.t. class 2 and the reader is referred to Krüger et al. [Krüger et al., 1999c] for details. Especially, the shift for classes 2 and 3 occurred at the same time. Similarly, no time difference in the cessation of impacts in the two classes is noticable because at the cessation the dust streams sweep through the field of view rather quickly.
Insert Tab. 6
A periodogram [Scargle, 1982] of the dust impact rate measured in 1996 shows 5 and 10 h periodicities which are caused by the interaction of the dust grains with Jupiter’s rotating magnetosphere (Fig. 10). Another strong peak occurs at Io’s orbital frequency of 42 h. In addition, there are side lobes at Io’s orbital frequency plus or minus Jupiter’s rotation frequency (10 h rotation period) or twice that frequency (5 h), respectively. If Io’s orbital frequency is a carrier frequency, then the side frequencies show that Jupiter’s rotation frequency amplitude-modulates Io’s signal. Graps et al. [Graps et al., 2000] have analysed a larger data set from 1996 and 1997 and used these findings – among other arguments – to conclude that Io is the source of the dust streams [Graps et al., 2000].
Insert Fig. 10
The lower panel of Fig. 9 shows the rotation angle for a second population of dust grains, namely bigger micrometer-sized grains. These grains are concentrated in the inner Jovian system forming a tenuous dust ring between the Galilean satellites. Modelling [Krivov et al., 2001] has shown that this ring is fed by particles escaping from impact-generated dust clouds around the Galilean moons [Krüger et al., 1999e, Krüger et al., 2000]. The impact directions and impact times imply that two groups of grains exist in the dust ring: particles on prograde and retrograde orbits about Jupiter, respectively [Colwell et al., 1998, Thiessenhusen et al., 2000]. Prograde particles are much more abundant than retrograde ones [Thiessenhusen et al., 2000]. A fraction of the retrograde grains may be interplanetary or interstellar particles captured by the Jovian magnetosphere [Colwell et al., 1998].
Acknowledgements. The authors thank the Galileo project at JPL for effective and successful mission operations. We are grateful to Mark Sykes whose careful evaluations improved the Galileo and Ulysses dust data sets submitted to the Planetary Data System. We thank our referees, Alexander V. Krivov and Larry W. Esposito, for providing valuable suggestions which improved the presentation of our results. This work has been supported by the Deutsches Zentrum für Luft- und Raumfahrt (DLR).
References
- Baguhl et al., 1995 Baguhl, M., Grün, E., Hamilton, D. P., Linkert, G., Riemann, R., and Staubach, P.: 1995, The flux of interstellar dust observed by Ulysses and Galileo, Space Science Reviews 72, 471–476
- Colwell et al., 1998 Colwell, J. E., Horányi, M., and Grün, E.: 1998, Capture of interplanetary and interstellar dust by the Jovian magnetosphere, Science 280, 88–91
- D’Amario et al., 1992 D’Amario, L. A., Bright, L. E., and Wolf, A. A.: 1992, Galileo trajectory design, Space Sci. Rev. 60, 23–78
- Graps et al., 2000 Graps, A. L., Grün, E., Svedhem, H., Krüger, H., Horányi, M., Heck, A., and Lammers, S.: 2000, Io as a source of the Jovian dust streams, Nature 405, 48–50
- Grün et al., 1995a Grün, E., Baguhl, M., Divine, N., Fechtig, H., Hamilton, D. P., Hanner, M. S., Kissel, J., Lindblad, B. A., Linkert, D., Linkert, G., Mann, I., McDonnell, J. A. M., Morfill, G. E., Polanskey, C., Riemann, R., Schwehm, G., Siddique, N., Staubach, P., and Zook, H. A.: 1995a, Three years of Galileo dust data, Planetary and Space Science 43, 953–969, Paper II
- Grün et al., 1995b Grün, E., Baguhl, M., Divine, N., Fechtig, H., Hamilton, D. P., Hanner, M. S., Kissel, J., Lindblad, B. A., Linkert, D., Linkert, G., Mann, I., McDonnell, J. A. M., Morfill, G. E., Polanskey, C., Riemann, R., Schwehm, G., Siddique, N., Staubach, P., and Zook, H. A.: 1995b, Two years of Ulysses dust data, Planetary and Space Science 43, 971–999, Paper III
- Grün et al., 1995c Grün, E., Baguhl, M., Hamilton, D. P., Kissel, J., Linkert, D., Linkert, G., and Riemann, R.: 1995c, Reduction of Galileo and Ulysses dust data, Planet. and Space Sci. 43, 941–951, Paper I
- Grün et al., 1996a Grün, E., Baguhl, M., Hamilton, D. P., Riemann, R., Zook, H. A., Dermott, S., Fechtig, H., Gustafson, B. A., Hanner, M. S., Horányi, M., Khurana, K. K., Kissel, J., Kivelson, M., Lindblad, B. A., Linkert, D., Linkert, G., Mann, I., McDonnell, J. A. M., Morfill, G. E., Polanskey, C., Schwehm, G., and Srama, R.: 1996a, Constraints from Galileo observations on the origin of jovian dust streams, Nature 381, 395–398
- Grün et al., 1992a Grün, E., Fechtig, H., Hanner, M. S., Kissel, J., Lindblad, B. A., Linkert, D., Maas, D., Morfill, G. E., and Zook, H. A.: 1992a, The Galileo dust detector, Space Science Reviews 60, 317–340
- Grün et al., 1992b Grün, E., Fechtig, H., Kissel, J., Linkert, D., Maas, D., McDonnell, J. A. M., Morfill, G. E., Schwehm, G., Zook, H. A., and Giese, R. H.: 1992b, The Ulysses dust experiment, Astronomy and Astrophysics Supplement Series 92, 411–423
- Grün et al., 1996b Grün, E., Hamilton, D. P., Riemann, R., Dermott, S., Fechtig, H., Gustafson, B. A., Hanner, M. S., Heck, A., Horányi, M., Kissel, J., Kivelson, M., Krüger, H., Lindblad, B. A., Linkert, D., Linkert, G., Mann, I., McDonnell, J. A. M., Morfill, G. E., Polanskey, C., Schwehm, G., Srama, R., and Zook, H. A.: 1996b, Dust measurements during Galileo’s approach to Jupiter and Io encounter, Science 274, 399–401
- Grün et al., 1998 Grün, E., Krüger, H., Graps, A., Hamilton, D. P., Heck, A., Linkert, G., Zook, H., Dermott, S., Fechtig, H., Gustafson, B., Hanner, M., Horányi, M., Kissel, J., Lindblad, B., Linkert, G., Mann, I., McDonnell, J. A. M., Morfill, G. E., Polanskey, C., Schwehm, G., and Srama, R.: 1998, Galileo observes electromagnetically coupled dust in the jovian magnetosphere, Journal of Geophysical Research 103, 20011–20022
- Grün et al., 1997 Grün, E., Krüger, P., Dermott, S., Fechtig, H., Graps, A., Gustafson, B. A., Hamilton, D. P., Heck, A., Horányi, M., Kissel, J., Lindblad, B. A., Linkert, D., Linkert, G., Mann, I., McDonnell, J. A. M., Morfill, G. E., Polanskey, C., Schwehm, G., Srama, R., and Zook, H. A.: 1997, Dust measurements in the Jovian magnetosphere, Geophysical Research Letters 24, 2171–2174
- Grün et al., 1993 Grün, E., Zook, H. A., Baguhl, M., Balogh, A., Bame, S. J., Fechtig, H., Forsyth, R., Hanner, M. S., Horányi, M., Kissel, J., Lindblad, B. A., Linkert, D., Linkert, G., Mann, I., McDonnell, J. A. M., Morfill, G. E., Phillips, J. L., Polanskey, C., Schwehm, G., Siddique, N., Staubach, P., Svestka, J., and Taylor, A.: 1993, Discovery of Jovian dust streams and interstellar grains by the Ulysses spacecraft, Nature 362, 428–430
- Heck, 1998 Heck, A.: 1998, Modellierung und Analyse der von der Raumsonde Galileo im Jupitersystem vorgefundenen Mikrometeoroiden-Populationen, Ph.D. thesis, Ruprecht-Karls-Universität Heidelberg
- Horányi et al., 1997 Horányi, M., Grün, E., and Heck, A.: 1997, Modeling the Galileo dust measurements at Jupiter, Geophysical Research Letters 24, 2175–2178
- Johnson et al., 1992 Johnson, T. V., Yeates, C., and Young, R.: 1992, Galileo Mission Overview, Space Sci. Rev. 60, 3–21
- Krivov et al., 2001 Krivov, A. V., Krüger, H., Grün, E., Thiessenhusen, K.-U., and Hamilton, D. P.: 2001, A tenuous dust ring of Jupiter formed by escaping ejecta from the Galilean satellites, Journal of Geophys. Research, submitted
- Krüger et al., 1999a Krüger, H., Grün, E., Graps, A., and Lammers, S.: 1999a, in E. M. J. Büchner, I. Axford and V. Vasyliunas (eds.), Proceedings of the VII. International Conference on Plasma Astrophysics and Space Physics, held in Lindau in May 1998, Vol. 264, pp 247–256, Kluwer Academic Publishers
- Krüger et al., 1999b Krüger, H., Grün, E., Hamilton, D. P., Baguhl, M., Dermott, S., Fechtig, H., Gustafson, B. A., Hanner, M. S., Horányi, M., Kissel, J., Lindblad, B. A., Linkert, D., Linkert, G., Mann, I., McDonnell, J. A. M., Morfill, G. E., Polanskey, C., Riemann, R., Schwehm, G., Srama, R., and Zook, H.: 1999b, Three years of Galileo dust data: II. 1993 to 1995, Planetary and Space Science 47, 85–106, Paper IV
- Krüger et al., 1999c Krüger, H., Grün, E., Heck, A., and Lammers, S.: 1999c, Analysis of the sensor characteristics of the Galileo dust detector with collimated Jovian dust stream particles, Planetary and Space Science 47, 1015–1028
- Krüger et al., 1999d Krüger, H., Grün, E., Landgraf, M., Baguhl, M., Dermott, S., Fechtig, H., Gustafson, B. A., Hamilton, D. P., Hanner, M. S., Horányi, M., Kissel, J., Lindblad, B., Linkert, D., Linkert, G., Mann, I., McDonnell, J. A. M., Morfill, G. E., Polanskey, C., Schwehm, G., Srama, R., and Zook, H.: 1999d, Three years of Ulysses dust data: 1993 to 1995, Planetary and Space Science 47, 363–383, Paper V
- Krüger et al., 2001 Krüger, H., Grün, E., Landgraf, M., Dermott, S., Fechtig, H., Gustafson, B. A., Hamilton, D. P., Hanner, M. S., Horányi, M., Kissel, J., Lindblad, B., Linkert, D., Linkert, G., Mann, I., McDonnell, J. A. M., Morfill, G. E., Polanskey, C., Schwehm, G., Srama, R., and Zook, H.: 2001, Four years of Ulysses dust data: 1996 to 1999, Planetary and Space Science, submitted, Paper VII
- Krüger et al., 2000 Krüger, H., Krivov, A. V., and Grün, E.: 2000, A Dust Cloud of Ganymede Maintained by Hypervelocity Impacts of Interplanetary Micrometeoroids, Planetary and Space Science 48, 1457–1471
- Krüger et al., 1999e Krüger, H., Krivov, A. V., Hamilton, D. P., and Grün, E.: 1999e, Detection of an impact-generated dust cloud around Ganymede, Nature 399, 558–560
- Liou, 1997 Liou, J.-C.: 1997, priv. comm.
- Scargle, 1982 Scargle, J. D.: 1982, Studies in Astronomical Time Series II.: Statistical Aspects of Spectral Analysis of Unevenly Spaced Data, Astrophysical Journal 263, 835–853
- Statman and Deutsch, 1997 Statman, J. I. and Deutsch, L. J.: 1997, in C. Barbieri, J. H. Rahe, T. V. Johnson, , and A. M. Sohus (eds.), Proceedings of “The Three Galileos: The Man, The Spacecraft, The Telescope”, pp 107–113, Kluwer Academic Publishers
- Svestka et al., 1996 Svestka, J., Auer, S., Baguhl, M., and Grün, E.: 1996, in B. A. Gustafson and M. S. Hanner (eds.), Physics, Chemistry and Dynamics of Interplanetary Dust, ASP Conference Series, Vol. 104, pp 31–34
- Thiessenhusen et al., 2000 Thiessenhusen, K.-U., Krüger, H., Spahn, F., and Grün, E.: 2000, Dust grains around Jupiter – The observations of the Galileo Dust Detector, Icarus 144, 89–98
- Zook et al., 1996 Zook, H., Grün, E., Baguhl, M., Hamilton, D. P., Linkert, G., Linkert, D., Liou, J.-C., Forsyth, R., and Phillips, J. L.: 1996, Solar wind magnetic field bending of Jovian dust trajectories, Science 274, 1501–1503
| Yr-day | Date | Time | Event |
|---|---|---|---|
| 89-291 | 18 Oct 1989 | 16:52 | Galileo launch |
| 95-341 | 07 Dec 1995 | 21:54 | Galileo Jupiter closest approach, distance: |
| 95-341 | 07 Dec 1995 | 23:25 | DDS configuration: HV=off |
| 96-087 | 27 Mar 1996 | 05:56 | DDS configuration: HV=2, EVD =C,I, SSEN = 0,0,1,1 |
| 96-089 | 29 Mar 1996 | 16:34 | DDS first MRO after high voltage switch on |
| 96 | April/May 1996 | Galileo reprogramming (phase 2 software) | |
| 96-145 | 24 May 1996 | 21:00 | DDS begin RTS data after Galileo reprogramming |
| 96-153 | 01 Jun 1996 | 10:15 | DDS end RTS data |
| 96-175 | 23 Jun 1996 | 16:17 | DDS begin RTS data |
| 96-175 | 23 Jun 1996 | 17:04 | Galileo turn: , turn to nominal attitude |
| 96-176 | 24 Jun 1996 | 18:30 | Galileo OTM-6, duration 5 h, no attitude change |
| 96-179 | 27 Jun 1996 | 06:07 | DDS end RTS data, begin record data |
| 96-179 | 27 Jun 1996 | 06:29 | Galileo Ganymede 1 (G1) closest approach, altitude 835 km |
| 96-179 | 27 Jun 1996 | 06:53 | DDS end record data, begin RTS data |
| 96-179 | 27 Jun 1996 | DDS begin deadtime caused by strong channeltron noise | |
| 96-180 | 28 Jun 1996 | 00:31 | Galileo Jupiter closest approach, distance |
| 96-180 | 28 Jun 1996 | 22:48 | Galileo turn: , duration 9.1 h |
| 96-181 | 29 Jun 1999 | DDS end deadtime caused by strong channeltron noise | |
| 96-181 | 29 Jun 1996 | 06:56 | Galileo turn: , duration 42 h |
| 96-182 | 30 Jun 1996 | 07:45 | Galileo OTM-7A, duration 15 h, no attitude change |
| 96-183 | 01 Jul 1996 | 01:03 | Galileo turn: , return to nominal attitude |
| 96-183 | 01 Jul 1996 | 08:52 | DDS end RTS data |
| 96-185 | 03 Jul 1996 | 09:00 | Galileo OTM-7B, duration 15 h, no attitude change |
| 96-218 | 05 Aug 1996 | 08:00 | Galileo OTM-8, duration 8 h, size of turn |
| 96-220 | 07 Aug 1996 | 03:28 | DDS begin RTS data |
| 96-232 | 19 Aug 1996 | 02:18 | Galileo turn: , return to nominal attitude |
| 96-237 | 24 Aug 1996 | 14:15 | Galileo spacecraft anomaly, end of RTS data |
| 96-240 | 27 Aug 1996 | 17:30 | Galileo OTM-9, duration 5 h, no attitude change |
| 96-244 | 31 Aug 1996 | 12:30 | DDS begin RTS data after spacecraft anomaly |
| 96-248 | 04 Sep 1996 | 18:50 | Galileo OTM-10, duration 4.8 h, no attitude change |
| 96-250 | 06 Sep 1996 | 11:20 | DDS configuration: HV=2, EVD =I, SSEN = 0,1,1,1, from Jupiter |
| 96-250 | 06 Sep 1996 | 18:32 | DDS end RTS data, begin record data |
| 96-250 | 06 Sep 1996 | 19:00 | Galileo Ganymede 2 (G2) closest approach, altitude 262 km |
| 96-250 | 06 Sep 1996 | 19:28 | DDS end record data, begin RTS data |
| 96-250 | 06 Sep 1996 | 20:07 | Galileo turn: , duration 3 h, return to nominal attitude |
| 96-251 | 07 Sep 1996 | 13:38 | Galileo Jupiter closest approach, distance |
| 96-252 | 08 Sep 1996 | 16:07 | DDS configuration: HV=2, EVD =C,I, SSEN = 0,0,1,1, from Jupiter |
| 96-253 | 09 Sep 1996 | 21:30 | Galileo OTM-11, duration 8 h, size of turn , return to nominal attitude |
| 96-255 | 11 Sep 1996 | 02:39 | DDS end RTS data, begin record data |
| 96-255 | 11 Sep 1996 | 03:19 | DDS end record data, begin RTS data |
| 96-262 | 18 Sep 1996 | 16:41 | DDS end RTS data |
| 96-267 | 23 Sep 1996 | 17:00 | Galileo turn: , new nominal attitude |
| 96-274 | 30 Sep 1996 | 23:08 | DDS begin RTS data |
| 96-282 | 08 Oct 1996 | 14:30 | Galileo OTM-12, duration 7.5 h, no attitude change |
| 96-306 | 01 Nov 1996 | 13:30 | Galileo OTM-13, duration 5 h, no attitude change |
| 96-309 | 04 Nov 1996 | 13:15 | DDS end RTS data, begin record data |
| 96-309 | 04 Nov 1996 | 13:34 | Galileo Callisto 3 (C3) closest approach, altitude 1,136 km |
| 96-309 | 04 Nov 1996 | 14:01 | DDS end record data, begin RTS data |
| 96-310 | 05 Nov 1996 | 10:11 | DDS configuration: HV=2, EVD =I, SSEN = 0,1,1,1, from Jupiter |
| 96-311 | 06 Nov 1996 | 13:31 | Galileo Jupiter closest approach, distance |
| 96-312 | 07 Nov 1996 | 03:10 | Galileo turn: , duration 17.5 h, return to nominal attitude |
| Yr-day | Date | Time | Event |
|---|---|---|---|
| 96-312 | 07 Nov 1996 | 16:42 | DDS configuration: HV=2, EVD =C,I, SSEN = 0,0,1,1, from Jupiter |
| 96-313 | 08 Nov 1996 | 23:20 | Galileo turn: , duration 11 h, return to nominal attitude |
| 96-315 | 10 Nov 1996 | 07:20 | Galileo OTM-14, no attitude change |
| 96-316 | 11 Nov 1996 | 02:01 | DDS end RTS data |
| 96-316 | 11 Nov 1996 | 20:00 | Galileo turn: , new nominal attitude |
| 96-331 | 26 Nov 1996 | 11:50 | Galileo OTM-15, no attitude change |
| 96-339 | 04 Dec 1996 | 16:33 | DDS last MRO before reprogramming |
| 96-339 | 04 Dec 1996 | 17:00 | DDS reprogramming (AC21 and AC31 overflow counters added) |
| 96-340 | 05 Dec 1996 | 03:50 | DDS first MRO after reprogramming |
| 96-348 | 13 Dec 1996 | 19:15 | DDS begin RTS data |
| 96-351 | 16 Dec 1996 | 02:30 | Galileo OTM-16, duration 5 h, no attitude change |
| 96-353 | 18 Dec 1996 | 11:00 | DDS configuration: HV=2, EVD =I, SSEN = 0,1,1,1, from Jupiter |
| 96-354 | 19 Dec 1996 | 03:22 | Galileo Jupiter closest approach, distance |
| 96-354 | 19 Dec 1996 | 06:26 | DDS end RTS data, begin record data |
| 96-354 | 19 Dec 1996 | 06:53 | Galileo Europa 4 (E4) closest approach, altitude 692 km |
| 96-354 | 19 Dec 1996 | 07:24 | DDS end record data, begin RTS data |
| 96-355 | 20 Dec 1996 | 04:00 | Galileo turn: , duration 14.4 h, return to nominal attitude |
| 96-355 | 20 Dec 1996 | 06:43 | DDS configuration: HV=2, EVD =C,I, SSEN = 0,0,1,1, from Jupiter |
| 96-356 | 21 Dec 1996 | 19:00 | DDS end RTS data |
| 96-358 | 23 Dec 1996 | 09:30 | Galileo OTM-17, duration 9 h, no attitude change |
| 96-361 | 26 Dec 1996 | 20:38 | Galileo turn: , new nominal attitude |
Abbreviations used: MRO: DDS memory read-out; HV: channeltron high voltage step; EVD: event definition, ion- (I), channeltron- (C), or electron-channel (E); SSEN: detection thresholds, ICP, CCP, ECP and PCP; OTM: orbit trim maneuver; RTS: Realtime science; AC21: class 2 amplitude range 1 accumulator; AC31: class 3 amplitude range 1 accumulator
Table 2: Overview of dust impacts accumulated with Galileo DDS between 1 January and 31 December 1996. The Jovicentric distance , the lengths of the time interval t (days) from the previous table entry, and the corresponding numbers of impacts are given for the class 2 and 3 accumulators. The accumulators are arranged with increasing signal amplitude ranges (AR), e.g. AC31 means counter for CLN = 3 and AR = 1. The determination of the noise contamination in class 2 is described in the text. The t in the first line (day 96-148) is the time interval counted from the last entry in Table 4 in Paper IV. The DDS reprogramming on day 96-339 is indicated by horizontal lines. The totals of counted impacts, of impacts with complete data, and of all events (noise plus impact events) for the entire period are given as well.
| Date | Time | t | AC | AC | AC | AC | AC | AC | AC | AC | AC | AC | AC | AC | |||||||
|---|---|---|---|---|---|---|---|---|---|---|---|---|---|---|---|---|---|---|---|---|---|
| [] | [d] | 22 | 32 | 23 | 33 | 24 | 34 | 25 | 35 | 26 | 36 | ||||||||||
| 96-148 | 11:14 | 175.5 | 151.9 | 0.80 | 5 | - | - | - | - | - | - | 1 | - | - | - | - | - | - | - | - | - |
| 96-165 | 23:03 | 107.9 | 17.49 | 0.27 | 11 | - | 0.00 | 1 | 1 | - | - | - | - | - | - | - | - | - | - | - | - |
| 96-176 | 00:03 | 45.10 | 10.04 | 0.17 | 134 | 269 | 0.00 | 1 | - | - | - | - | - | - | - | - | - | - | - | - | - |
| 96-177 | 00:50 | 36.22 | 1.032 | 0.00 | 304 | 64 | - | - | - | - | - | - | - | - | - | - | - | - | - | - | - |
| 96-178 | 14:13 | 21.40 | 1.558 | 0.02 | 4133 | 938 | 1.00 | 1 | - | - | - | - | - | - | - | - | - | - | - | - | - |
| 96-179 | 03:19 | 16.18 | 0.545 | 0.12 | 972 | 31 | 0.00 | 1 | - | - | - | - | - | - | - | - | - | - | - | - | - |
| 96-180 | 10:14 | 12.38 | 1.288 | 0.30 | 1398 | 29 | 0.50 | 2 | 2 | - | - | - | - | - | - | - | - | - | - | - | - |
| 96-181 | 00:16 | 17.14 | 0.584 | 1.00 | 37 | - | 1.00 | 3∗ | - | 0.00 | 1 | - | - | - | - | - | - | - | - | - | - |
| 96-182 | 00:20 | 26.55 | 1.002 | 1.00 | 3 | - | - | - | - | - | - | - | - | - | - | - | - | - | - | - | - |
| 96-185 | 13:18 | 53.60 | 3.540 | 1.00 | 1 | - | 0.50 | 2 | - | - | - | - | - | - | 1 | - | - | - | - | - | - |
| 96-194 | 04:23 | 94.16 | 8.628 | 0.74 | 15 | - | 1.00 | 2 | - | - | - | - | - | - | - | - | - | - | - | - | - |
| 96-209 | 11:05 | 125.3 | 15.27 | 0.74 | 17 | - | 1.00 | 1 | - | - | - | - | - | - | - | - | - | - | - | - | - |
| 96-221 | 14:51 | 125.7 | 12.15 | 0.77 | 30 | - | 1.00 | 1 | - | - | - | - | - | - | - | - | - | - | - | - | - |
| 96-231 | 00:38 | 111.9 | 9.407 | 0.32 | 91 | 5 | 1.00 | 1 | - | - | - | 2 | - | - | - | - | - | - | - | - | - |
| 96-241 | 23:55 | 75.75 | 10.97 | 0.07 | 444 | 73 | 1.00 | 25∗ | 1 | - | - | - | - | - | - | - | - | - | - | - | - |
| 96-242 | 17:05 | 72.30 | 0.715 | 0.12 | 246 | 173 | 0.67 | 3∗ | - | - | - | - | - | - | - | - | - | - | - | - | - |
| 96-245 | 00:11 | 59.93 | 2.295 | 0.00 | 2595 | 666 | 0.00 | 2 | - | - | - | - | - | - | - | - | - | - | - | - | - |
| 96-246 | 00:36 | 53.67 | 1.017 | 0.04 | 5091 | 1202 | 1.00 | 1 | - | - | - | - | - | - | - | - | - | - | - | - | - |
| 96-247 | 00:05 | 47.11 | 0.978 | 0.03 | 4436 | 1139 | - | - | - | - | - | - | - | - | - | - | - | - | - | - | - |
| 96-247 | 21:19 | 40.62 | 0.884 | 0.03 | 4897 | 1392 | 1.00 | 1 | - | - | - | - | - | - | - | - | - | - | - | - | - |
| 96-248 | 00:01 | 39.75 | 0.113 | 0.00 | 765 | 168 | - | - | - | - | - | - | - | - | - | - | - | - | - | - | - |
| 96-249 | 00:10 | 31.52 | 1.005 | 0.00 | 8443 | 2358 | - | - | - | - | - | - | - | - | - | - | - | - | - | - | - |
| 96-250 | 06:53 | 19.74 | 1.279 | 0.05 | 8849 | 1213 | - | - | 1 | - | - | - | - | - | - | - | - | - | - | - | - |
| 96-251 | 02:47 | 12.38 | 0.829 | 0.25 | 6314 | 400 | 0.75 | 4 | 1 | - | - | 2 | 0.00 | 1 | 1 | - | - | 1 | - | - | - |
| 96-252 | 07:27 | 14.69 | 1.194 | 0.50 | 891 | 108 | 0.14 | 7 | - | 0.00 | 1 | 1 | - | - | 1 | - | - | - | - | - | - |
| 96-255 | 01:49 | 38.94 | 2.765 | 0.97 | 14 | - | 0.67 | 3 | - | - | - | - | - | - | 2 | - | - | - | - | - | - |
| 96-260 | 19:33 | 72.31 | 5.739 | 0.97 | 77 | 83 | 1.00 | 1 | - | - | - | - | - | - | 1 | - | - | - | - | - | - |
| 96-270 | 22:28 | 103.2 | 10.12 | 0.67 | 3 | - | 1.00 | 1 | - | - | - | - | - | - | - | - | - | - | - | - | - |
| 96-285 | 16:03 | 111.5 | 14.73 | 0.25 | 147 | 1 | 1.00 | 1 | - | - | - | - | - | - | - | - | - | - | - | - | - |
| 96-291 | 23:09 | 103.6 | 6.296 | 0.23 | 194 | 2 | 1.00 | 1 | 1 | - | - | - | - | - | - | - | - | - | - | - | - |
| 96-305 | 00:16 | 58.77 | 13.04 | 0.01 | 8485 | 3324 | - | - | - | - | - | - | - | - | - | - | - | - | - | - | - |
| 96-306 | 00:03 | 52.93 | 0.991 | 0.07 | 1607 | 184 | - | - | - | - | - | - | - | - | - | - | - | - | - | - | - |
| 96-307 | 00:07 | 46.43 | 1.002 | 0.00 | 1324 | 178 | - | - | - | - | - | - | - | - | - | - | - | - | - | - | - |
| 96-308 | 08:12 | 36.63 | 1.336 | 0.01 | 2520 | 405 | 1.00 | 1 | - | - | - | - | - | - | - | - | - | - | - | - | - |
| 96-309 | 09:06 | 27.92 | 1.037 | 0.04 | 1154 | 199 | 0.00 | 1 | - | - | - | - | - | - | - | - | - | - | - | - | - |
| Date | Time | t | AC | AC | AC | AC | AC | AC | AC | AC | AC | AC | AC | AC | |||||||
| [] | [d] | 22 | 32 | 23 | 33 | 24 | 34 | 25 | 35 | 26 | 36 | ||||||||||
| 96-310 | 04:59 | 20.16 | 0.828 | 0.07 | 1480 | 98 | - | - | 2 | - | - | - | - | - | - | - | - | - | - | - | - |
| 96-311 | 00:12 | 12.25 | 0.801 | 0.25 | 2838 | 166 | 0.00 | 1 | 1 | 0.00 | 1 | - | - | - | - | - | - | - | - | - | - |
| 96-312 | 01:13 | 11.65 | 1.042 | 0.74 | 466 | 41 | 0.71 | 7∗ | 2 | 0.00 | 2∗ | 2 | 0.00 | 1 | - | - | - | 1 | - | - | - |
| 96-314 | 00:45 | 30.37 | 1.980 | 0.92 | 119 | 5 | 0.54 | 13∗ | - | 1.00 | 1∗ | 2 | 0.00 | 1 | - | 0.00 | 1 | 1 | - | - | - |
| 96-327 | 17:44 | 85.63 | 13.70 | 0.38 | 358 | 54 | 0.00 | 1 | - | - | - | - | - | - | - | - | - | - | - | - | - |
| 96-330 | 06:08 | 88.24 | 2.516 | 0.75 | 14 | 1 | - | - | - | - | - | - | - | - | 1 | - | - | - | - | - | - |
| 96-339 | 16:35 | 82.84 | 9.435 | 0.00 | 861 | 68 | - | - | - | - | - | - | - | - | - | - | - | - | - | - | - |
| 96-339 | 17:00 | 82.80 | 0.017 | ——————— | ——————— | ——————— | ——————— | ——————— | ——————— | ||||||||||||
| 96-349 | 00:17 | 49.16 | 9.321 | 0.00 | 384 | 127 | - | - | - | - | - | - | - | - | - | - | - | - | - | - | - |
| 96-350 | 20:31 | 36.91 | 1.843 | 0.00 | 50323$ | 9994$ | 0.00 | 1∗ | - | - | - | - | - | - | - | - | - | - | - | - | - |
| 96-350 | 22:38 | 36.25 | 0.088 | 0.00 | 17091$ | 1791$ | 0.00 | 1∗ | - | - | - | - | - | - | - | - | - | - | - | - | - |
| 96-351 | 00:24 | 35.69 | 0.073 | 0.00 | 455$ | 85$ | - | - | - | - | - | - | - | - | - | - | - | - | - | - | - |
| 96-352 | 23:57 | 18.08 | 1.980 | 0.05 | 81422$ | 10383$ | - | - | - | - | - | - | - | - | - | - | - | - | - | - | - |
| 96-353 | 06:33 | 15.29 | 0.275 | 0.23 | 1133$ | 65$ | - | - | 1 | - | - | - | - | - | - | - | - | - | - | - | - |
| 96-354 | 06:27 | 9.370 | 0.995 | 0.48 | 5957$ | 436$ | 0.50 | 2 | 1 | 0.00 | 2 | - | - | - | - | - | - | - | - | - | - |
| 96-355 | 00:47 | 15.55 | 0.763 | 0.96 | 104$ | 3$ | 0.33 | 15∗ | 2 | 0.00 | 1 | 1 | 0.00 | 1 | - | 0.00 | 1 | - | - | - | - |
| 96-360 | 19:31 | 54.22 | 5.780 | 0.74 | 67$ | 2$ | 1.00 | 4 | - | - | - | - | - | - | - | - | - | - | - | - | - |
| 96-365 | 04:07 | 67.34 | 4.358 | 0.88 | 11$ | - | - | - | - | - | - | - | - | - | - | - | - | - | - | - | - |
| Events (counted) | - | 228730† | 37923† | - | 113 | 16 | - | 9 | 11 | - | 4 | 7 | - | 2 | 3 | - | 0 | - | |||
| Impacts (complete data) | - | 1807 | 3451 | - | 39 | 16 | - | 8 | 11 | - | 6 | 7 | - | 3 | 3 | - | 2 | - | |||
| All events(complete data) | 0.28 | 2512 | 3451 | 0.53 | 83 | 16 | 0.20 | 10 | 11 | 0.00 | 6 | 7 | 0.00 | 3 | 3 | 0.00 | 2 | - | |||
: AR2 to AR6: The complete data set was transmitted for only a fraction of all particles detected in this amplitude range and time interval. has been estimated from the data sets transmitted. AR1: data transmission is always incomplete in this amplitude range.
: Due to an unknown number of accumulator overflows before day 96-339 these numbers are lower limits for the true numbers of events.
$: After day 96-348 accumulator overflows are fully taken into account and the numbers given are the true numbers of detected events.
| Satellite | Orbit | Rotation | Impact | Class 2 | Altitude |
|---|---|---|---|---|---|
| angle range | velocity | denoised | limit [km] | ||
| Ganymede | G1,G2 | not restricted | no | 39,525 | |
| Callisto | C3 | no | 48,180 | ||
| Europa | E4 | not restricted | yes | 23,400 |
| Charge Parameter | AR1 | AR2 to AR6 |
|---|---|---|
| Entrance grid amplitude | PA 9 | — |
| Channeltron amplitude | — | CA 2 |
| Target amplitude minus iongrid amplitude | (EAIA) 0 or | (EAIA) 0 or |
| (EAIA) 7 | (EAIA) 7 | |
| EA risetime | ET 9 or ET = 15 | — |
| IA risetime | IT 8 | — |
Table 5: DPF data: No., impact time, TEV CLN, AR, SEC, IA, EA, CA, IT, ET, EIT, EIC, ICC, PA, PET, EVD, ICP, ECP, CCP, PCP, HV and evaluated data: LON, LAT, (in ; Jupiter radius ), rotation angle (ROT), instr. pointing (, ), speed (, in ), speed error factor (VEF), mass (, in grams) and mass error factor (MEF).
| No. | IMP. DATE | TEV | C | AR | S | IA | EA | CA | IT | ET | E | E | I | PA | P | E | I | E | C | P | HV | LON | LAT | ROT | V | VEF | M | MEF | |||
|---|---|---|---|---|---|---|---|---|---|---|---|---|---|---|---|---|---|---|---|---|---|---|---|---|---|---|---|---|---|---|---|
| L | E | I | I | C | E | V | C | C | C | C | |||||||||||||||||||||
| N | C | T | C | C | T | D | P | P | P | P | |||||||||||||||||||||
| 2884 | 96-098 17:36:21 | 259 | 3 | 3 | 54 | 20 | 24 | 5 | 6 | 4 | 6 | 0 | 1 | 44 | 0 | 1 | 0 | 1 | 0 | 1 | 2 | 276.0 | 0.0 | 262.424 | 14 | 271 | 52 | 36.5 | 1.6 | 6.0 | |
| 2887 | 96-148 11:14:13 | 22 | 3 | 2 | 34 | 13 | 21 | 2 | 9 | 4 | 6 | 0 | 1 | 41 | 0 | 1 | 0 | 1 | 0 | 1 | 2 | 279.8 | -0.1 | 175.563 | 42 | 296 | 37 | 12.7 | 1.9 | 10.5 | |
| 2889 | 96-148 23:52:33 | 22 | 2 | 2 | 5 | 8 | 12 | 0 | 9 | 10 | 8 | 0 | 0 | 36 | 0 | 1 | 0 | 1 | 0 | 1 | 2 | 279.8 | -0.1 | 173.949 | 83 | 307 | 6 | 18.3 | 1.6 | 6.0 | |
| 2897 | 96-165 23:03:47 | 259 | 2 | 2 | 166 | 11 | 11 | 4 | 10 | 11 | 0 | 1 | 1 | 3 | 31 | 1 | 0 | 1 | 0 | 1 | 2 | 281.0 | -0.1 | 107.912 | 217 | 212 | -40 | 9.7 | 1.9 | 10.5 | |
| 3367 | 96-178 14:13:39 | 22 | 2 | 2 | 112 | 13 | 19 | 18 | 15 | 15 | 0 | 1 | 1 | 38 | 29 | 1 | 0 | 1 | 0 | 1 | 2 | 281.5 | 0.0 | 21.388 | 293 | 229 | 17 | 2.5 | 1.6 | 6.0 | |
| 3419 | 96-179 04:23:00 | 22 | 2 | 2 | 94 | 8 | 13 | 1 | 11 | 13 | 12 | 0 | 0 | 19 | 24 | 1 | 0 | 1 | 0 | 1 | 2 | 281.5 | 0.0 | 15.774 | 318 | 239 | 36 | 7.4 | 1.6 | 6.0 | |
| 3447 | 96-179 06:28:55 | 6 | 3 | 2 | 128 | 8 | 12 | 14 | 13 | 14 | 8 | 0 | 1 | 39 | 31 | 1 | 0 | 1 | 0 | 1 | 2 | 281.5 | 0.0 | 15.016 | 270 | 227 | 0 | 2.7 | 1.6 | 6.0 | |
| 3450 | 96-179 06:31:39 | 2 | 3 | 2 | 150 | 8 | 11 | 4 | 12 | 13 | 6 | 0 | 1 | 4 | 30 | 1 | 0 | 1 | 0 | 1 | 2 | 281.5 | 0.0 | 14.999 | 239 | 230 | -25 | 5.9 | 1.6 | 6.0 | |
| 3497 | 96-180 10:14:41 | 8 | 2 | 3 | 168 | 20 | 21 | 15 | 7 | 9 | 7 | 0 | 1 | 37 | 0 | 1 | 0 | 1 | 0 | 1 | 2 | 281.5 | 0.0 | 12.378 | 214 | 242 | -44 | 12.7 | 1.9 | 10.5 | |
| 3498 | 96-180 15:47:20 | 8 | 2 | 4 | 254 | 24 | 23 | 18 | 13 | 14 | 0 | 1 | 1 | 47 | 16 | 1 | 0 | 1 | 0 | 1 | 2 | 281.6 | 0.0 | 14.042 | 93 | 337 | -2 | 2.0 | 1.9 | 10.5 | |
| 3499 | 96-180 20:58:46 | 8 | 2 | 3 | 113 | 19 | 25 | 5 | 8 | 15 | 8 | 0 | 1 | 23 | 0 | 1 | 0 | 1 | 0 | 1 | 2 | 281.6 | 0.0 | 15.893 | 291 | 229 | 16 | 5.6 | 1.6 | 6.0 | |
| 3500 | 96-181 00:16:56 | 22 | 2 | 4 | 178 | 28 | 30 | 28 | 11 | 12 | 8 | 0 | 1 | 20 | 0 | 1 | 0 | 1 | 0 | 1 | 2 | 281.6 | 0.0 | 17.150 | 200 | 255 | -51 | 2.7 | 1.6 | 6.0 | |
| 3501 | 96-183 22:29:07 | 259 | 3 | 4 | 18 | 25 | 29 | 22 | 11 | 10 | 6 | 0 | 1 | 47 | 0 | 1 | 0 | 1 | 0 | 1 | 2 | 281.9 | -0.1 | 42.430 | 65 | 333 | 19 | 5.2 | 1.9 | 10.3 | |
| 3502 | 96-184 02:47:58 | 259 | 2 | 2 | 26 | 8 | 12 | 0 | 8 | 0 | 12 | 0 | 0 | 0 | 0 | 1 | 0 | 1 | 0 | 1 | 2 | 281.9 | -0.1 | 43.758 | 53 | 330 | 28 | 19.0 | 1.9 | 10.5 | |
| 3575 | 96-230 11:32:35 | 22 | 3 | 3 | 74 | 22 | 27 | 28 | 4 | 4 | 5 | 0 | 1 | 47 | 0 | 1 | 0 | 1 | 0 | 1 | 2 | 286.3 | -0.2 | 113.162 | 346 | 263 | 51 | 52.6 | 1.6 | 6.0 | |
| 3581 | 96-231 00:38:13 | 22 | 3 | 3 | 139 | 20 | 23 | 1 | 6 | 4 | 7 | 0 | 1 | 44 | 0 | 1 | 0 | 1 | 0 | 1 | 2 | 286.3 | -0.2 | 111.990 | 255 | 227 | -13 | 36.5 | 1.6 | 6.0 | |
| 3780 | 96-241 23:55:26 | 259 | 3 | 2 | 180 | 8 | 4 | 17 | 8 | 14 | 11 | 0 | 1 | 8 | 31 | 1 | 0 | 1 | 0 | 1 | 2 | 287.1 | -0.2 | 75.744 | 197 | 254 | -52 | 19.0 | 1.9 | 10.5 | |
| 3782 | 96-242 17:05:45 | 259 | 2 | 2 | 145 | 15 | 5 | 6 | 0 | 0 | 9 | 0 | 0 | 0 | 0 | 1 | 0 | 1 | 0 | 1 | 2 | 287.2 | -0.2 | 72.299 | 246 | 225 | -19 | 11.8 | 11.8 | 5858.3 | |
| 3783 | 96-242 17:10:49 | 259 | 2 | 2 | 70 | 8 | 9 | 9 | 8 | 10 | 3 | 1 | 1 | 4 | 31 | 1 | 0 | 1 | 0 | 1 | 2 | 287.2 | -0.2 | 72.281 | 352 | 266 | 52 | 19.0 | 1.9 | 10.5 | |
| 3784 | 96-243 01:48:30 | 259 | 2 | 2 | 74 | 8 | 9 | 9 | 8 | 10 | 3 | 1 | 1 | 6 | 31 | 1 | 0 | 1 | 0 | 1 | 2 | 287.2 | -0.2 | 70.481 | 346 | 259 | 51 | 19.0 | 1.9 | 10.5 | |
| 5194 | 96-250 06:53:06 | 8 | 3 | 2 | 107 | 8 | 12 | 8 | 9 | 9 | 5 | 0 | 1 | 36 | 0 | 1 | 0 | 1 | 0 | 1 | 2 | 287.5 | -0.2 | 19.729 | 300 | 227 | 23 | 19.9 | 1.6 | 6.0 | |
| 5261 | 96-250 13:29:28 | 8 | 3 | 4 | 125 | 25 | 29 | 26 | 8 | 8 | 9 | 0 | 1 | 47 | 0 | 5 | 0 | 1 | 1 | 1 | 2 | 287.5 | -0.2 | 17.109 | 274 | 223 | 2 | 16.0 | 1.6 | 6.0 | |
| 5341 | 96-250 18:51:01 | 2 | 2 | 2 | 189 | 10 | 13 | 14 | 14 | 14 | 0 | 1 | 1 | 38 | 15 | 5 | 0 | 1 | 1 | 1 | 2 | 287.5 | -0.2 | 15.059 | 184 | 272 | -56 | 2.5 | 1.6 | 6.0 | |
| 5347 | 96-250 18:57:16 | 2 | 2 | 2 | 106 | 15 | 4 | 2 | 0 | 5 | 12 | 0 | 0 | 4 | 0 | 5 | 0 | 1 | 1 | 1 | 2 | 287.5 | -0.2 | 15.019 | 301 | 228 | 24 | 11.8 | 11.8 | 5858.3 | |
| 5369 | 96-250 19:28:24 | 8 | 3 | 3 | 133 | 20 | 22 | 17 | 6 | 10 | 9 | 0 | 1 | 40 | 0 | 5 | 0 | 1 | 1 | 1 | 2 | 287.5 | -0.2 | 14.822 | 263 | 223 | -6 | 15.0 | 1.6 | 6.0 | |
| 5381 | 96-250 20:17:56 | 8 | 3 | 5 | 105 | 49 | 49 | 28 | 10 | 15 | 8 | 0 | 1 | 47 | 0 | 5 | 0 | 1 | 1 | 1 | 2 | 287.5 | -0.2 | 14.518 | 302 | 228 | 25 | 11.8 | 11.8 | 5858.3 | |
| 5388 | 96-250 20:53:19 | 8 | 3 | 3 | 99 | 21 | 25 | 12 | 8 | 9 | 8 | 0 | 1 | 46 | 0 | 5 | 0 | 1 | 1 | 1 | 2 | 287.5 | -0.2 | 14.305 | 311 | 231 | 31 | 14.0 | 1.6 | 6.0 | |
| 5392 | 96-250 21:28:43 | 8 | 3 | 2 | 119 | 8 | 10 | 6 | 12 | 13 | 5 | 0 | 1 | 2 | 31 | 5 | 0 | 1 | 1 | 1 | 2 | 287.5 | -0.2 | 14.095 | 283 | 224 | 9 | 5.9 | 1.6 | 6.0 | |
| 5412 | 96-250 23:21:57 | 8 | 2 | 4 | 99 | 27 | 29 | 26 | 10 | 9 | 2 | 1 | 1 | 45 | 3 | 5 | 0 | 1 | 1 | 1 | 2 | 287.5 | -0.2 | 13.445 | 311 | 235 | 14 | 9.5 | 1.7 | 7.6 | |
| 5452 | 96-251 02:47:14 | 8 | 2 | 2 | 210 | 8 | 12 | 7 | 9 | 9 | 6 | 0 | 0 | 36 | 0 | 5 | 0 | 1 | 1 | 1 | 2 | 287.5 | -0.2 | 12.376 | 155 | 310 | -48 | 19.9 | 1.6 | 6.0 | |
| 5512 | 96-251 10:06:03 | 8 | 3 | 3 | 118 | 22 | 26 | 14 | 5 | 5 | 6 | 0 | 1 | 46 | 0 | 5 | 0 | 1 | 1 | 1 | 2 | 287.5 | -0.2 | 10.854 | 284 | 224 | 10 | 40.9 | 1.6 | 6.0 | |
| 5534 | 96-251 14:35:00 | 8 | 2 | 2 | 174 | 14 | 20 | 0 | 15 | 14 | 12 | 0 | 0 | 22 | 0 | 5 | 0 | 1 | 1 | 1 | 2 | 287.5 | -0.2 | 10.667 | 205 | 245 | -48 | 2.5 | 1.6 | 6.0 | |
| 5535 | 96-251 16:16:06 | 100 | 2 | 2 | 109 | 14 | 20 | 15 | 11 | 8 | 7 | 0 | 1 | 36 | 0 | 5 | 0 | 1 | 1 | 1 | 2 | 287.5 | -0.2 | 10.765 | 297 | 226 | 20 | 13.8 | 1.6 | 6.0 | |
| 5536 | 96-251 16:21:09 | 8 | 2 | 2 | 38 | 14 | 10 | 5 | 13 | 15 | 0 | 1 | 1 | 12 | 29 | 5 | 0 | 1 | 1 | 1 | 2 | 287.5 | -0.2 | 10.772 | 37 | 317 | 40 | 2.3 | 1.9 | 10.5 | |
| 5537 | 96-251 17:24:51 | 8 | 2 | 2 | 134 | 9 | 22 | 4 | 9 | 2 | 10 | 0 | 0 | 10 | 0 | 5 | 0 | 1 | 1 | 1 | 2 | 287.5 | -0.2 | 10.883 | 262 | 223 | -7 | 12.7 | 1.9 | 10.5 | |
| 5538 | 96-251 17:39:01 | 8 | 3 | 4 | 127 | 24 | 27 | 26 | 7 | 9 | 9 | 0 | 1 | 46 | 0 | 5 | 0 | 1 | 1 | 1 | 2 | 287.5 | -0.2 | 10.912 | 271 | 223 | 0 | 16.0 | 1.6 | 6.0 | |
| 5539 | 96-251 19:39:21 | 8 | 2 | 3 | 153 | 19 | 20 | 17 | 10 | 7 | 0 | 1 | 1 | 40 | 11 | 5 | 0 | 1 | 1 | 1 | 2 | 287.5 | -0.2 | 11.224 | 235 | 228 | -28 | 4.5 | 1.9 | 10.5 | |
| 5540 | 96-251 21:11:22 | 8 | 2 | 2 | 2 | 9 | 11 | 2 | 15 | 11 | 12 | 0 | 0 | 20 | 0 | 5 | 0 | 1 | 1 | 1 | 2 | 287.5 | -0.2 | 11.535 | 87 | 333 | 1 | 6.4 | 3.1 | 58.7 | |
| 5543 | 96-252 07:27:08 | 8 | 2 | 2 | 252 | 9 | 11 | 0 | 14 | 5 | 13 | 0 | 0 | 47 | 2 | 5 | 0 | 1 | 1 | 1 | 2 | 287.5 | -0.2 | 14.690 | 96 | 333 | -5 | 11.8 | 9.5 | 2690.1 | |
| 5544 | 96-252 20:46:54 | 22 | 3 | 4 | 10 | 26 | 30 | 23 | 9 | 8 | 5 | 0 | 1 | 47 | 0 | 1 | 0 | 1 | 0 | 1 | 2 | 287.6 | -0.2 | 19.873 | 76 | 332 | 10 | 13.8 | 1.6 | 6.0 | |
| 5550 | 96-255 01:49:04 | 22 | 3 | 4 | 222 | 29 | 49 | 29 | 12 | 15 | 5 | 0 | 1 | 19 | 0 | 1 | 0 | 1 | 0 | 1 | 2 | 287.8 | -0.2 | 38.942 | 138 | 323 | -38 | 2.0 | 1.9 | 10.5 | |
| 5552 | 96-258 12:00:04 | 22 | 3 | 4 | 25 | 29 | 49 | 28 | 13 | 15 | 9 | 0 | 1 | 47 | 0 | 1 | 0 | 1 | 0 | 1 | 2 | 288.2 | -0.2 | 60.894 | 55 | 326 | 27 | 2.0 | 1.9 | 10.5 | |
| 5653 | 96-289 02:09:10 | 22 | 3 | 2 | 229 | 14 | 21 | 1 | 9 | 5 | 8 | 0 | 1 | 42 | 0 | 1 | 0 | 1 | 0 | 1 | 2 | 291.2 | -0.2 | 108.151 | 128 | 331 | -31 | 12.7 | 1.9 | 10.5 | |
| 6848 | 96-308 08:12:44 | 8 | 2 | 2 | 186 | 8 | 13 | 0 | 9 | 9 | 6 | 0 | 0 | 36 | 0 | 1 | 0 | 1 | 0 | 1 | 2 | 292.5 | -0.3 | 36.621 | 188 | 269 | -55 | 19.9 | 1.6 | 6.0 | |
| 7090 | 96-309 13:55:36 | 2 | 3 | 2 | 105 | 9 | 14 | 3 | 10 | 11 | 9 | 0 | 1 | 37 | 0 | 1 | 0 | 1 | 0 | 1 | 2 | 292.5 | -0.3 | 26.089 | 302 | 232 | 25 | 14.0 | 1.6 | 6.0 | |
| 7093 | 96-309 14:00:21 | 22 | 3 | 2 | 134 | 12 | 19 | 17 | 12 | 13 | 11 | 0 | 1 | 36 | 0 | 1 | 0 | 1 | 0 | 1 | 2 | 292.5 | -0.3 | 26.059 | 262 | 227 | -7 | 4.5 | 1.9 | 10.5 | |
| 7218 | 96-310 04:59:15 | 8 | 2 | 5 | 153 | 53 | 55 | 27 | 15 | 13 | 0 | 1 | 1 | 22 | 4 | 1 | 0 | 1 | 0 | 1 | 2 | 292.5 | -0.3 | 20.156 | 235 | 231 | -28 | 2.5 | 1.6 | 6.0 | |
| 7285 | 96-310 11:21:27 | 8 | 2 | 2 | 62 | 10 | 14 | 12 | 12 | 14 | 0 | 1 | 1 | 38 | 11 | 5 | 0 | 1 | 1 | 1 | 2 | 292.5 | -0.3 | 17.509 | 3 | 285 | 53 | 3.8 | 1.6 | 6.0 | |
| 7385 | 96-310 23:44:37 | 8 | 3 | 2 | 94 | 10 | 13 | 3 | 11 | 12 | 8 | 0 | 1 | 4 | 31 | 5 | 0 | 1 | 1 | 1 | 2 | 292.5 | -0.3 | 12.421 | 318 | 239 | 36 | 9.2 | 1.6 | 6.0 | |
| 7408 | 96-311 03:59:24 | 8 | 3 | 3 | 82 | 23 | 1 | 11 | 11 | 15 | 6 | 0 | 1 | 45 | 0 | 5 | 0 | 1 | 1 | 1 | 2 | 292.5 | -0.3 | 10.919 | 335 | 251 | 46 | 2.3 | 1.9 | 10.5 |
| No. | IMP. DATE | TEV | C | AR | S | IA | EA | CA | IT | ET | E | E | I | PA | P | E | I | E | C | P | HV | LON | LAT | ROT | V | VEF | M | MEF | |||
|---|---|---|---|---|---|---|---|---|---|---|---|---|---|---|---|---|---|---|---|---|---|---|---|---|---|---|---|---|---|---|---|
| L | E | I | I | C | E | V | C | C | C | C | |||||||||||||||||||||
| N | C | T | C | C | T | D | P | P | P | P | |||||||||||||||||||||
| 7436 | 96-311 06:06:49 | 8 | 2 | 3 | 152 | 22 | 22 | 20 | 12 | 11 | 0 | 1 | 1 | 47 | 31 | 5 | 0 | 1 | 1 | 1 | 2 | 292.5 | -0.3 | 10.289 | 236 | 231 | -27 | 2.0 | 1.9 | 10.5 | |
| 7438 | 96-311 06:49:17 | 8 | 2 | 2 | 174 | 9 | 12 | 6 | 12 | 13 | 0 | 1 | 1 | 40 | 14 | 5 | 0 | 1 | 1 | 1 | 2 | 292.5 | -0.3 | 10.105 | 205 | 249 | -49 | 5.9 | 1.6 | 6.0 | |
| 7439 | 96-311 09:03:45 | 8 | 3 | 2 | 3 | 15 | 20 | 17 | 11 | 9 | 10 | 0 | 1 | 37 | 31 | 5 | 0 | 1 | 1 | 1 | 2 | 292.5 | -0.3 | 9.619 | 86 | 336 | 2 | 12.1 | 1.6 | 6.0 | |
| 7441 | 96-311 11:53:37 | 8 | 2 | 2 | 166 | 9 | 21 | 4 | 15 | 9 | 13 | 0 | 0 | 11 | 24 | 5 | 0 | 1 | 1 | 1 | 2 | 292.5 | -0.3 | 9.262 | 217 | 240 | -42 | 2.0 | 1.9 | 10.5 | |
| 7442 | 96-311 16:15:30 | 8 | 3 | 5 | 175 | 49 | 27 | 17 | 15 | 15 | 4 | 0 | 1 | 24 | 0 | 5 | 0 | 1 | 1 | 1 | 2 | 292.5 | -0.3 | 9.365 | 204 | 250 | -49 | 11.8 | 11.8 | 5858.3 | |
| 7444 | 96-311 16:36:44 | 8 | 3 | 2 | 226 | 10 | 12 | 2 | 10 | 10 | 8 | 0 | 1 | 37 | 0 | 5 | 0 | 1 | 1 | 1 | 2 | 292.5 | -0.3 | 9.409 | 132 | 329 | -34 | 16.0 | 1.6 | 6.0 | |
| 7445 | 96-311 17:46:30 | 259 | 3 | 3 | 85 | 20 | 21 | 4 | 8 | 7 | 10 | 0 | 1 | 40 | 0 | 5 | 0 | 1 | 1 | 1 | 2 | 292.5 | -0.3 | 9.584 | 330 | 248 | 44 | 9.7 | 1.9 | 10.5 | |
| 7447 | 96-311 22:44:46 | 22 | 2 | 4 | 45 | 27 | 24 | 14 | 5 | 4 | 0 | 1 | 1 | 23 | 2 | 5 | 0 | 1 | 1 | 1 | 2 | 292.6 | -0.3 | 10.825 | 27 | 313 | 45 | 29.8 | 1.9 | 10.5 | |
| 7448 | 96-312 01:13:24 | 8 | 2 | 2 | 254 | 9 | 12 | 0 | 15 | 11 | 12 | 0 | 0 | 3 | 31 | 5 | 0 | 1 | 1 | 1 | 2 | 292.6 | -0.3 | 11.659 | 93 | 337 | -3 | 6.4 | 3.1 | 58.7 | |
| 7449 | 96-312 01:13:24 | 8 | 2 | 3 | 24 | 20 | 13 | 21 | 10 | 15 | 0 | 1 | 1 | 47 | 28 | 5 | 0 | 1 | 1 | 1 | 2 | 292.6 | -0.3 | 11.659 | 56 | 331 | 26 | 4.5 | 1.9 | 10.5 | |
| 7451 | 96-312 01:41:43 | 8 | 2 | 2 | 228 | 8 | 13 | 0 | 9 | 9 | 5 | 0 | 0 | 1 | 0 | 5 | 0 | 1 | 1 | 1 | 2 | 292.6 | -0.3 | 11.829 | 129 | 330 | -32 | 19.9 | 1.6 | 6.0 | |
| 7453 | 96-312 02:31:16 | 8 | 2 | 2 | 89 | 8 | 8 | 26 | 0 | 0 | 4 | 1 | 1 | 63 | 0 | 5 | 0 | 1 | 1 | 1 | 2 | 292.6 | -0.3 | 12.134 | 325 | 243 | 40 | 11.8 | 11.8 | 5858.3 | |
| 7454 | 96-312 03:27:54 | 8 | 2 | 2 | 204 | 12 | 14 | 0 | 13 | 9 | 14 | 0 | 0 | 30 | 2 | 5 | 0 | 1 | 1 | 1 | 2 | 292.6 | -0.3 | 12.491 | 163 | 305 | -53 | 8.5 | 4.0 | 138.9 | |
| 7456 | 96-312 06:03:35 | 8 | 2 | 2 | 38 | 15 | 1 | 4 | 0 | 15 | 4 | 0 | 1 | 43 | 0 | 5 | 0 | 1 | 1 | 1 | 2 | 292.6 | -0.3 | 13.514 | 37 | 336 | 38 | 11.8 | 11.8 | 5858.3 | |
| 7458 | 96-312 07:21:27 | 8 | 3 | 3 | 210 | 19 | 10 | 4 | 10 | 1 | 12 | 0 | 1 | 5 | 1 | 5 | 0 | 1 | 1 | 1 | 2 | 292.6 | -0.3 | 14.042 | 155 | 331 | -50 | 4.5 | 1.9 | 10.5 | |
| 7460 | 96-312 08:25:10 | 8 | 2 | 2 | 167 | 9 | 22 | 3 | 8 | 12 | 0 | 1 | 1 | 11 | 30 | 5 | 0 | 1 | 1 | 1 | 2 | 292.6 | -0.3 | 14.479 | 215 | 256 | -44 | 19.0 | 1.9 | 10.5 | |
| 7462 | 96-312 10:46:43 | 8 | 3 | 3 | 235 | 20 | 28 | 7 | 14 | 2 | 10 | 0 | 1 | 25 | 0 | 5 | 0 | 1 | 1 | 1 | 2 | 292.6 | -0.3 | 15.463 | 120 | 350 | -25 | 2.0 | 1.9 | 10.5 | |
| 7463 | 96-312 13:43:39 | 8 | 2 | 5 | 90 | 52 | 54 | 30 | 15 | 13 | 0 | 1 | 1 | 21 | 6 | 5 | 0 | 1 | 1 | 1 | 2 | 292.6 | -0.3 | 16.704 | 323 | 259 | 38 | 2.5 | 1.6 | 6.0 | |
| 7464 | 96-312 19:09:13 | 22 | 3 | 5 | 43 | 49 | 52 | 30 | 15 | 14 | 5 | 0 | 1 | 47 | 0 | 1 | 0 | 1 | 0 | 1 | 2 | 292.6 | -0.3 | 18.983 | 30 | 331 | 43 | 3.2 | 2.0 | 12.5 | |
| 7465 | 96-312 23:02:48 | 8 | 2 | 2 | 8 | 10 | 13 | 12 | 14 | 15 | 0 | 1 | 1 | 2 | 31 | 1 | 0 | 1 | 0 | 1 | 2 | 292.7 | -0.3 | 20.593 | 79 | 336 | 8 | 2.1 | 1.6 | 6.0 | |
| 7469 | 96-314 00:45:44 | 22 | 2 | 4 | 62 | 25 | 31 | 11 | 15 | 4 | 4 | 1 | 1 | 23 | 0 | 1 | 0 | 1 | 0 | 1 | 2 | 292.8 | -0.3 | 30.379 | 3 | 285 | 53 | 2.0 | 1.9 | 10.5 | |
| 7525 | 96-330 06:08:15 | 259 | 3 | 4 | 48 | 29 | 52 | 13 | 7 | 6 | 5 | 0 | 1 | 47 | 0 | 1 | 0 | 1 | 0 | 1 | 2 | 294.5 | -0.3 | 88.246 | 23 | 315 | 48 | 12.7 | 1.9 | 10.5 | |
| 7789 | 96-350 20:31:24 | 22 | 2 | 2 | 148 | 15 | 5 | 9 | 0 | 0 | 8 | 0 | 0 | 0 | 0 | 1 | 0 | 1 | 0 | 1 | 2 | 296.1 | -0.4 | 36.909 | 242 | 235 | -22 | 11.8 | 11.8 | 5858.3 | |
| 7804 | 96-350 22:38:49 | 8 | 2 | 2 | 116 | 10 | 15 | 0 | 9 | 10 | 6 | 0 | 0 | 38 | 0 | 1 | 0 | 1 | 0 | 1 | 2 | 296.1 | -0.4 | 36.243 | 287 | 234 | 13 | 18.3 | 1.6 | 6.0 | |
| 8109 | 96-352 23:57:20 | 8 | 2 | 6 | 169 | 59 | 57 | 27 | 6 | 12 | 4 | 1 | 1 | 31 | 0 | 1 | 0 | 1 | 0 | 1 | 2 | 296.2 | -0.4 | 18.075 | 212 | 249 | -44 | 19.0 | 1.9 | 10.5 | |
| 8145 | 96-353 06:33:40 | 22 | 3 | 2 | 71 | 11 | 21 | 1 | 14 | 4 | 14 | 0 | 1 | 10 | 0 | 1 | 0 | 1 | 0 | 1 | 2 | 296.2 | -0.4 | 15.285 | 350 | 274 | 53 | 2.0 | 1.9 | 10.5 | |
| 8152 | 96-353 09:23:33 | 22 | 2 | 3 | 163 | 23 | 27 | 22 | 15 | 14 | 0 | 1 | 1 | 10 | 21 | 1 | 0 | 1 | 0 | 1 | 2 | 296.2 | -0.4 | 14.103 | 221 | 244 | -38 | 2.5 | 1.6 | 6.0 | |
| 8163 | 96-353 12:55:52 | 22 | 2 | 3 | 91 | 20 | 24 | 19 | 7 | 15 | 0 | 1 | 1 | 24 | 28 | 5 | 0 | 1 | 1 | 1 | 2 | 296.2 | -0.4 | 12.676 | 322 | 247 | 39 | 6.4 | 1.6 | 6.0 | |
| 8184 | 96-353 19:39:19 | 22 | 3 | 2 | 59 | 11 | 14 | 7 | 15 | 15 | 8 | 0 | 1 | 47 | 3 | 5 | 0 | 1 | 1 | 1 | 2 | 296.2 | -0.4 | 10.347 | 7 | 297 | 53 | 2.1 | 1.6 | 6.0 | |
| 8185 | 96-353 20:43:01 | 22 | 2 | 6 | 130 | 58 | 13 | 31 | 6 | 0 | 4 | 0 | 1 | 59 | 0 | 5 | 0 | 1 | 1 | 1 | 2 | 296.1 | -0.4 | 10.062 | 267 | 232 | -2 | 19.0 | 1.9 | 10.5 | |
| 8189 | 96-354 06:28:47 | 2 | 2 | 2 | 114 | 12 | 21 | 5 | 15 | 10 | 11 | 0 | 0 | 10 | 26 | 5 | 0 | 1 | 1 | 1 | 2 | 296.2 | -0.4 | 9.369 | 290 | 234 | 15 | 2.0 | 1.9 | 10.5 | |
| 8193 | 96-354 06:51:05 | 2 | 2 | 2 | 110 | 10 | 12 | 13 | 10 | 10 | 2 | 1 | 1 | 6 | 31 | 5 | 0 | 1 | 1 | 1 | 2 | 296.2 | -0.4 | 9.422 | 295 | 236 | 20 | 16.0 | 1.6 | 6.0 | |
| 8195 | 96-354 06:52:04 | 2 | 2 | 3 | 106 | 20 | 5 | 14 | 8 | 15 | 15 | 0 | 1 | 37 | 0 | 5 | 0 | 1 | 1 | 1 | 2 | 296.2 | -0.4 | 9.425 | 301 | 237 | 24 | 9.7 | 1.9 | 10.5 | |
| 8197 | 96-354 06:54:00 | 2 | 3 | 2 | 139 | 10 | 13 | 14 | 11 | 12 | 8 | 0 | 1 | 2 | 31 | 5 | 0 | 1 | 1 | 1 | 2 | 296.2 | -0.4 | 9.430 | 255 | 233 | -12 | 9.2 | 1.6 | 6.0 | |
| 8198 | 96-354 06:54:53 | 2 | 2 | 2 | 140 | 9 | 12 | 8 | 12 | 13 | 4 | 1 | 1 | 34 | 31 | 5 | 0 | 1 | 1 | 1 | 2 | 296.2 | -0.4 | 9.433 | 253 | 233 | -13 | 5.9 | 1.6 | 6.0 | |
| 8200 | 96-354 06:55:57 | 2 | 2 | 2 | 109 | 14 | 20 | 18 | 11 | 8 | 7 | 0 | 1 | 39 | 31 | 5 | 0 | 1 | 1 | 1 | 2 | 296.2 | -0.4 | 9.436 | 297 | 236 | 21 | 13.8 | 1.6 | 6.0 | |
| 8204 | 96-354 07:00:47 | 2 | 2 | 2 | 106 | 13 | 19 | 9 | 10 | 11 | 8 | 0 | 1 | 2 | 31 | 5 | 0 | 1 | 1 | 1 | 2 | 296.2 | -0.4 | 9.450 | 301 | 237 | 24 | 8.6 | 1.6 | 6.0 | |
| 8205 | 96-354 07:08:33 | 2 | 2 | 5 | 150 | 49 | 11 | 17 | 15 | 0 | 5 | 0 | 1 | 58 | 0 | 5 | 0 | 1 | 1 | 1 | 2 | 296.2 | -0.4 | 9.473 | 239 | 236 | -25 | 11.8 | 11.8 | 5858.3 | |
| 8208 | 96-354 12:45:36 | 22 | 2 | 2 | 85 | 10 | 2 | 3 | 12 | 2 | 13 | 0 | 0 | 44 | 31 | 5 | 0 | 1 | 1 | 1 | 2 | 296.2 | -0.4 | 10.933 | 330 | 253 | 45 | 4.5 | 1.9 | 10.5 | |
| 8209 | 96-354 13:06:50 | 22 | 3 | 2 | 11 | 11 | 25 | 4 | 14 | 15 | 13 | 0 | 1 | 63 | 10 | 5 | 0 | 1 | 1 | 1 | 2 | 296.2 | -0.4 | 11.049 | 75 | 341 | 12 | 2.0 | 1.9 | 10.5 | |
| 8210 | 96-354 14:53:00 | 22 | 2 | 2 | 120 | 12 | 9 | 3 | 13 | 15 | 0 | 1 | 1 | 47 | 30 | 5 | 0 | 1 | 1 | 1 | 2 | 296.2 | -0.4 | 11.659 | 281 | 233 | 9 | 2.3 | 1.9 | 10.5 | |
| 8211 | 96-354 14:53:00 | 22 | 3 | 3 | 160 | 20 | 22 | 18 | 6 | 10 | 11 | 0 | 1 | 39 | 0 | 5 | 0 | 1 | 1 | 1 | 2 | 296.2 | -0.4 | 11.659 | 225 | 242 | -35 | 15.0 | 1.6 | 6.0 | |
| 8212 | 96-354 15:56:42 | 22 | 2 | 2 | 131 | 11 | 49 | 18 | 9 | 11 | 0 | 1 | 1 | 28 | 20 | 5 | 0 | 1 | 1 | 1 | 2 | 296.2 | -0.4 | 12.045 | 266 | 232 | -3 | 12.7 | 1.9 | 10.5 | |
| 8213 | 96-354 18:04:05 | 22 | 2 | 2 | 247 | 13 | 22 | 8 | 14 | 11 | 0 | 1 | 1 | 49 | 30 | 5 | 0 | 1 | 1 | 1 | 2 | 296.2 | -0.4 | 12.850 | 103 | 342 | -10 | 2.0 | 1.9 | 10.5 | |
| 8214 | 96-354 23:50:55 | 8 | 2 | 4 | 13 | 26 | 7 | 26 | 8 | 0 | 9 | 0 | 1 | 35 | 19 | 5 | 0 | 1 | 1 | 1 | 2 | 296.2 | -0.4 | 15.168 | 72 | 341 | 14 | 9.7 | 1.9 | 10.5 |
| Orbit | Onset | Cessation | |
|---|---|---|---|
| class 3 | shift | ||
| G1 | – | – | |
| G2 | |||
| C3 | |||
| E4 | – |