Global physical conditions
of the interstellar medium
in nearby galaxies
††thanks: Based on observations with ISO, an ESA project with instruments funded by
ESA Member States (especially the PI countries: France, Germany, the
Netherlands and the United Kingdom) and with the participation of ISAS and
NASA.
Far-infrared spectra (43-197 m) of 34 nearby galaxies obtained by the Long Wavelength Spectrometer (LWS) aboard the Infrared Space Observatory (ISO) were analyzed to investigate the general properties of interstellar matter in galaxies. The present sample includes not only normal galaxies but also starbursts and active galactic nuclei (AGNs). Far-infrared forbidden lines, such as [C ii]158 m, [O i]63 m, [N ii]122 m, and [O iii]88 m, were detected in most of the sample galaxies. [O i]145 m line was detected in 13 galaxies. The line fluxes of [C ii]158 m and [N ii]122 m relative to the total far-infrared flux () decrease as the far-infrared color becomes bluer, while the ratio of the [O i]63 m flux to does not show a systematic trend with the color. The [O iii]88 m to ratio shows a large scatter with a weak trend of increase with the color. AGNs do not show any distinguishable trend from normal and starburst galaxies in the far-infrared spectra, suggesting that the far-infrared emission is mainly driven by star-formation activities even in AGNs. We estimate the physical conditions of photodissociation regions (PDRs) in the sample galaxies, such as the far-ultraviolet radiation field intensity and the gas density by assuming that all the observed [O i]63 m and far-infrared continuum emissions come from PDRs. Comparison with PDR models indicates that ranges from and . The present results also suggest that varies proportionally with . The ratio of [C ii] 158m to CO () line emission supports the linear increase in with . We estimate that about a half of [C ii]158 m emission originates from PDRs and attribute the rest to the emission as coming from low-density diffuse ionized gas. The estimated intensity of [C ii]158 m from the ionized gas is compatible with the observed intensity of [N ii]122 m if both lines come from the same diffuse ionized gas. The present analysis suggests that the decrease in [C ii]158 m with the far-infrared color may not be accounted for by the decrease in the photoelectric heating efficiency owing to the increase in positive charges of dust grains because a measure of the efficiency, , is found to stay constant with the far-infrared color. Instead the decrease can be interpreted in terms of either the increase in the collisional de-excitation of the [C ii] transition due to the increase in the gas density or the decrease in the ionized component relative to the far-infrared intensity suggested by the decrease in [N ii]122 m. Based on the present analysis, we derive average relations of the far-infrared color with and in galaxies, which can be applied to the investigation of interstellar matter in distant galaxies.
Key Words.:
galaxies: ISM – infrared: ISM – lines and bands: ISM – radiation mechanisms: thermal1 Introduction
Mechanisms for heating interstellar gas include collisions, radiation from stars, shocks, and cosmic rays. Examination of the spectral lines that cool the gas can help determine the dominant excitation mechanisms and conditions. Studies of particular regions in our Galaxy and observations of external galaxies have suggested that stellar ultraviolet radiation can ionize vast volumes of a galaxy and that the far-ultraviolet (FUV) radiation impinging on neutral cloud surfaces is responsible for a large fraction of the observed far-infrared (FIR) spectral line emission that cools the gas (Crawford et al. Crawford (1985); Stacey et al. Stacey (1991); Shibai et al. Shibai (1991)). Tielens & Hollenbach (TH85 (1985)) defined photodissociation regions (PDRs) as “a neutral region where FUV radiation dominates the heating and/or some important aspect of the chemistry”. Thus PDRs include most of the atomic gas in a galaxy, both in diffuse clouds and in dense regions (for a recent review, Hollenbach & Tielens Hollenbach (1997)).
[C ii]158 m and [O i]63 m lines are important coolants in PDRs, while gas heating in PDRs is thought to be dominated by energetic photoelectrons ejected from dust grains following FUV photon absorption (Watson Watson (1972); de Jong de Jong (1977)). For galactic nuclei and star-forming regions in the spiral arms, most of the observed [C ii] line emission arises from PDRs on molecular cloud surfaces. However, integrated over the disks of spiral galaxies, a substantial fraction may also arise from “standard” atomic clouds, i.e., the cold neutral medium gas regions (CNM) (Madden et al. Madden (1993); Bennett et al. Bennett (1994)) or from extended low-density warm ionized gas regions (ELDWIM) (Heiles Heiles (1994)). Contributions from the various gas phases can be estimated by observations of several FIR forbidden lines (Carral et al. Carral (1994); Luhman et al. Luhman (1998)).
With the LWS on board the ISO (Clegg et al. Clegg (1996)) it now becomes possible to measure far-infrared lines not only from infrared-bright galaxies but also from normal galaxies (for latest reviews, Genzel & Cesarsky Genzel (2000); Fischer Fischer (2000)). Lord et al. (Lord (1996)) made observations of several FIR fine-structure forbidden lines in a normal galaxy NGC5713 and found a fairly high [C ii]158 m to the FIR intensity ratio. Smith & Madden (Smith (1997)) made observations of [N ii]122 m and [C ii]158 m lines for five spiral galaxies in the Virgo cluster and found enhanced ratios of [C ii] to CO() intensities in two of the five galaxies. They interpreted the results in terms of either low metallicity or an increase in the contribution from the CNM. Braine & Hughes (Braine (1999)) obtained a complete FIR spectrum of a normal disk galaxy NGC4414 and investigated the physical conditions of the interstellar medium. Leech et al. (Leech (1999)) presented observations of [C ii]158 m in 19 quiescent galaxies in the Virgo cluster. They indicated a good correlation between [C ii] and far-infrared intensities and a trend of increasing [C ii]-to-far-infrared intensity ratio with increasing galaxy lateness, which has been shown to be related to the star-formation rate (Pierini et al. Pierini (1999)). Malhotra et al. (2001a ) reported observations of 4 early-type galaxies with ISO/LWS and interpreted the observed low ratio of [C ii]158 m to far-infrared intensities in terms of the soft radiation field in the target galaxies. Hunter et al. (Hunter (2001)) presented observations of 5 irregular galaxies with ISO/LWS and found strong [C ii]158 m emission relative to the far-infrared continuum.
Malhotra et al. (Malhotra1997 (1997), 2001b ) have investigated the far-infrared properties of 60 nearby normal galaxies based on line-spectroscopic observations mainly of [C ii]158 m and [O i]63 m line emissions. They complemented their line data with IRAS photometry to estimate the far-infrared continuum intensity (Helou et al. Helou (1988)) and found a trend that the ratio of the [C ii] line intensity to decreases with the far-infrared color becoming bluer. Several interpretations have been proposed for the trend (Malhotra et al. Malhotra1997 (1997); Genzel & Cesarsky Genzel (2000); Helou et al. Helou2001 (2001)). Malhotra et al. (2001b ) favor the interpretation of the decrease in the photoelectron yield owing to the increase in positive charges of dust grains under strong ultraviolet radiation.
The FIR continuum emission shorter than 60 m is dominated by the emission from stochastically heated very small grains (Desert et al. Desert (1986); Dwek et al. Dwek1997 (1997); Onaka Onaka (2000); Dale et al. Dale (2001); Li & Draine Li (2001)). The spectral energy distribution (SED) longer than 100 m is crucial to correctly estimate the thermal emission from submicron dust grains and understand the FIR SED of galaxies. In this paper we investigate the FIR properties of nearby galaxies based on LWS full grating spectra from 43 to 197 m including both line and continuum emission. The continuum spectra longer than 100 m enable better estimates of the average temperature of submicron dust grains as well as the strength of the interstellar radiation field. Because the aperture size of LWS is large ( 80 ″), the spectra of galaxies include contributions from various interstellar regions within the galaxies. This paper investigates the mechanism of gas heating with the aim of a better understanding of the global physical conditions of the interstellar medium in galaxies.
| Galaxy | Type | Morphology | ISO(60)a [Jy] | R(60/100)b | visual size [′] |
|---|---|---|---|---|---|
| Cen A | AGN | S0 pec, Sy2 | 98.4 | 0.43 | |
| Circinus | AGN | SA(s)b:, Sy2 | 334.1 | 0.71 | |
| IC2554 | normal | SB(s)bc pec: | 15.9 | 0.52 | |
| IRAS00506+7248 | normal | 24.1 | 0.66 | ||
| IRAS13242-5713 | normal | S… | 89.2 | 0.70 | |
| M51 | normal | SA(s)bc pec, HII, Sy2.5 | 36.4 | 0.38 | |
| M82 | starburst | I0, Sbrst, HII | 1486.6 | 0.87 | |
| M83 | starburst | SAB(s)c, HII, Sbrst | 138.0 | 0.60 | |
| Maffei2 | normal | SAB(rs)bc: | 94.8 | 0.47 | |
| NGC1068 | AGN | (R)SA(rs)b, Sy1, Sy2 | 206.3 | 0.62 | |
| NGC1097 | starburst | (R’1:)SB(r’l)b, Sy1 | 49.6 | 0.54 | |
| NGC1365 | AGN | (R’)SBb(s)b, Sy1.8 | 92.0 | 0.52 | |
| NGC2146 | starburst | SB(s)ab pec, HII | 163.3 | 0.65 | |
| NGC253 | starburst | SAB(s)c, HII, Sbrst | 1044.7 | 0.70 | |
| NGC3256 | starburst | Pec, merger, HII | 107.8 | 0.71 | |
| NGC3690 | starburst | IBm pec, HII | 121.7 | 1.00 | |
| NGC4038 | starburst | SB(s)m pec | 21.5 | 0.52 | |
| NGC4041 | normal | SA(rs)bc: | 11.7 | 0.43 | |
| NGC4414 | normal | SA(rs)c? | 24.8 | 0.38 | |
| NGC4945 | starburst | SB(s)cd: sp, Sy2 | 577.2 | 0.50 | |
| NGC520 | starburst | 37.9 | 0.65 | ||
| NGC5430 | starburst | SB(s)b, HII, Sbrst | 9.2 | 0.51 | |
| NGC5937 | normal | (R’)SAB(rs)b pec | 10.0 | 0.46 | |
| NGC6156 | normal | (R’1)SAB(rs)c | 20.9 | 0.61 | |
| NGC6240 | starburst | I0: pec, LINER, Sy2 | 25.8 | 0.87 | |
| NGC6764 | starburst | SB(s)bc, LINER, Sy2 | 4.6 | 0.50 | |
| NGC6810 | normal | SA(s)ab:sp, Sy2 | 17.0 | 0.48 | |
| NGC6824 | normal | SA(s)b: | 6.8 | 0.43 | |
| NGC6946 | starburst | SAB(rs)cd, HII | 58.6 | 0.50 | |
| NGC7469 | starburst | (R’)SAB(rs)a, Sy1.2 | 24.7 | 0.69 | |
| NGC7552 | starburst | (R’)SB(s)ab, HII, LINER | 74.7 | 0.59 | |
| NGC7582 | AGN | (R’1)SB(s)ab, Sy2 | 51.9 | 0.64 | |
| NGC7714 | starburst | SB(s)b:pec, HII, LINER | 12.7 | 0.97 | |
| NGC891 | normal | SA(s)b? sp, HII | 24.3 | 0.31 |
Flux density at 60 m derived from the LWS spectra convolved with the IRAS band filters.
Ratio of the 60 m and 100 m flux densities (in Jy) derived from the LWS spectra with the IRAS band filters.
2 Data reduction and observational results
Full grating scan spectra of m were obtained for 9 galaxies with the LWS01 mode in the open time programs of TONAKA.IRGAL and GALIR. In addition, we extracted LWS01 full grating scan data of 25 galaxies from the ISO archival database for a total of 34 nearby galaxies LWS spectra that were analyzed in the present study. The sample includes various types of galaxies, ranging from active galactic nuclei (AGNs), starburst, to normal galaxies. Table 1 lists the present sample, where the flux density at 60 m and the FIR color are derived from the LWS spectra convolved with the IRAS band filters (for the data reduction, see below). We excluded Arp220 and II ZW40 from the present analysis, both of which have also been observed with LWS01. The former shows a spectrum optically thick even in the far-infrared (Fischer Fischer (2000); Malhotra et al. 2001b ), for which the present simple analysis cannot be applied, and the continuum of the latter object is faint and suffered from the uncertainty in the dark current estimate. The spectral resolution () of LW01 mode was about 200 and the beam size of LWS was estimated to be (Gry gry (2000)). The sample galaxies have optical sizes of and thus for some galaxies only the central portion was included in the LWS beam. Smith & Harvey (Smith&Harvey (1996)) reported observations of far-infrared emitting regions in external galaxies from the Kuiper Airborne Observatory (KAO), indicating that most far-infrared emission is concentrated in the central regions of the galaxies. LWS observations are supposed to detect most of the far-infrared emission and therefore probe the properties of central part of the galaxies.
In the present study, we used the Standard Processed Data (SPD) of off-line processing (OLP) version 9 products provided by the ISO data center. The dark current and the drift in the detector responsivity were corrected by using the LWS Interactive Analysis software (LIA version 7.3)111LIA is a joint development of the ISO-LWS instrument team at RAL, UK, the PI institute and IPAC.. The ISO Spectral Analysis Package (ISAP version 1.6a)222The ISO Spectral Analysis Package (ISAP) is a joint development by the LWS and SWS Instrument Teams and Data Centers. Contributing institutes are CESR, IAS, IPAC, MPE, RAL and SRON. was then used for further data reduction. The continuum spectra were stitched together by shifting each detector signal with the offset method, adjusted to the SW5 channel in most galaxies. In some cases where the SW5 channel is noisy, the adjustment was made referring to the LW3 or LW4 channels. The offsets between the detectors were typically less than 20%. The line flux, the total far-infrared flux, and the dust temperature of the continuum emission were derived by ISAP. The 60 and 100 m flux densities from the LWS spectra were found to agree with the IRAS data within about 20%. The uncertainties in LWS spectra were suggested to be about % in previous works (e.g., Braine and Hughes Braine (1999); Unger et al. Unger (2000)) and we adopt 20% errors for the flux uncertainty.
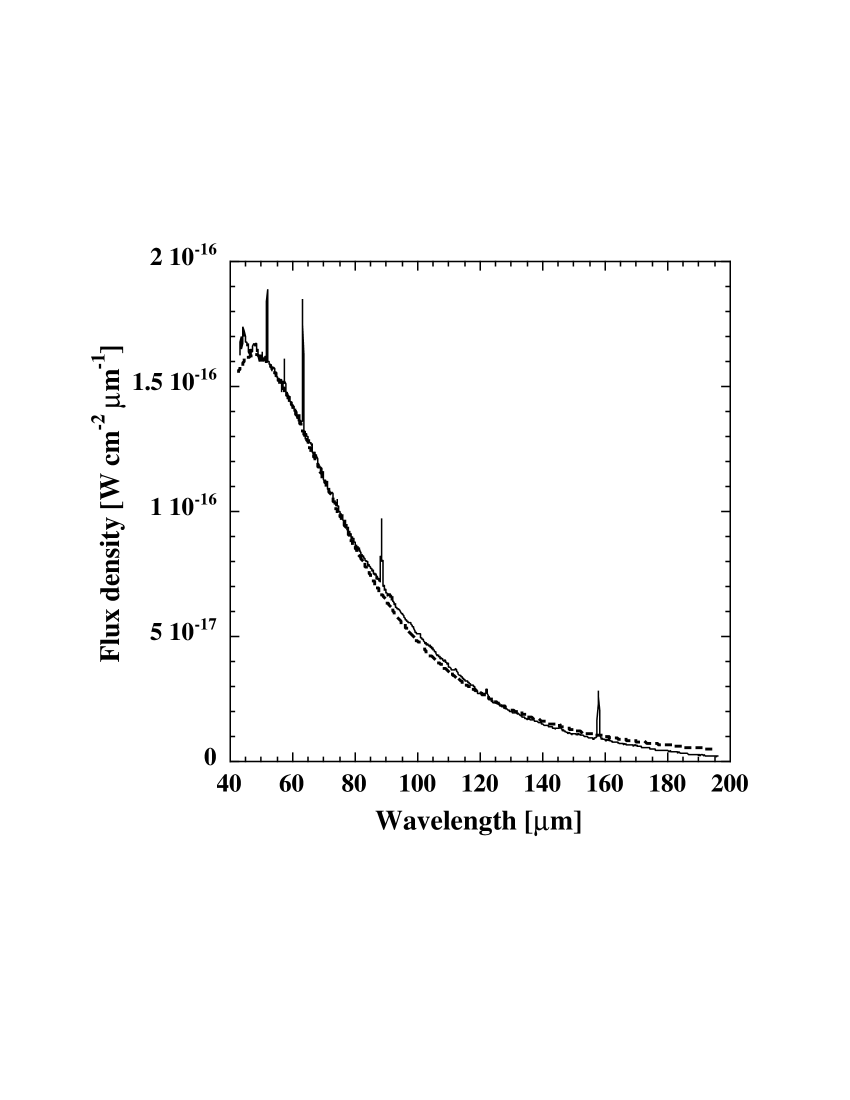
The continuum emission shorter than the 60 m region is affected by the contribution from very small grains. To derive a typical temperature of submicron grains in each galaxy, we fitted the LWS spectrum for 80 m with the following equation:
| (1) |
![[Uncaptioned image]](/html/astro-ph/0107019/assets/x1.png)
where , , and are the solid angle of the object, the optical depth at 0.55 m, and the Planck function of temperature , respectively. The parameters and cannot be determined independently and only the product of them is a meaningful parameter. We assumed that the dust emissivity is proportional to 1/, which provides reasonably good fits for the present sample of galaxies. A typical example of the fit is shown in Fig. 1. We then define the total infrared integrated flux from submicron dust grains as
| (2) |
Note that does not include the excess emission shorter than 80 m, which is attributed to the emission from very small dust grains. The uncertainties in the flux level of the SW1 detector due to the memory effect and the spectral shape of the excess emission make it difficult to estimate the excess emission accurately. The excess emission may be about 30% of according to the study of the diffuse Galactic emission of Dwek et al. (Dwek1997 (1997)). The present is larger by 30% on average than the far-infrared flux for m estimated from the IRAS 60 and 100 m flux densities (Helou et al. Helou (1988)).
The observational results are summarized in Table 2. In most of the sample galaxies, far-infrared forbidden lines, such as [O i]63 m, [O iii]88 m, [N ii]122 m, and [C ii]158 m, were detected. [O i]145 m was detected only in 13 galaxies, while only 8 galaxies show detectable [O iii]52 m emission. The indicated errors include the relative errors estimated from the uncertainty in the base line fit and 20% flux uncertainty. The error in is estimated from the uncertainty in the temperature determination, which mostly comes from the goodness of the fit.
[C ii]158 m is one of the most important lines for the diagnosis of physical conditions of PDRs because of its large luminosity and low critical density for collisional excitation. However, the carbon atom has a lower ionization energy (11.26eV) than hydrogen (13.6eV), and carbon ions are expected to be present not only in the neutral region, such as PDRs, but also in the ionized regions.
[N ii]122 m is a good tracer of diffuse low-density ionized gas, such as ELDWIM, because the ionization energy of nitrogen atom nearly equals to that of hydrogen atom and the critical density for collisional excitation by electrons is about 300 electrons cm-3.
Oxygen atoms have an ionization energy of 13.6eV almost the same as that of hydrogen. [O i]63 m is one of the most luminous lines as well as [C ii]158 m and it becomes a more efficient cooling line than [C ii]158 m in high-density gases. Together with the upper level transition at 145 m, it is an important probe for neutral gas. [O i]145 m was weak and detected only in a limited number of galaxies, and we cannot examine the major fraction of the sample galaxies by using the [O i]145 m line. [O iii]88 m is a luminous line of dense ionized gas. It has an upper level transition at 52 m and the line ratio of the 52 m to 88 m emission can be used to derive the electron density of the ionized gas (e.g., Moorwood et al. Moorwood (1980)). Unfortunately, the spectra in the 52 m region do not have a sufficient signal to noise ratio to derive a reliable [O iii]52 m line intensity for most of the present sample galaxies.
In Table 3 we list the electron density estimated from the ratio of the [O iii] lines and the neutral hydrogen density estimated from that of the [O i] lines for the galaxies in which [OIII]52 m emission was detected. These are rough estimates and should be taken with caution because of the large errors in the obtained line ratios. For about a half of the galaxies with the detected [O iii]52 m emission, the line ratio is near the low-density limit and only upper limits of the electron density are given. In the derivation of the neutral hydrogen density we assume that the gas temperature is 1000K. Even with this temperature the line ratios are in the low-density limit for the galaxies listed in Table 3. For lower temperatures the upper limits will further be decreased.
| object | (cm-3)a | (cm-3)b |
|---|---|---|
| Cen A | ||
| Circinus | ||
| M82 | ||
| NGC1068 | ||
| NGC2146 | ||
| NGC253 | ||
| NGC3690 |
a The electron density derived from the [O iii]52 m to 88 m line ratio.
b The neutral hydrogen density derived from the [O i]145 m to 63 m line ratio for the gas temperature of 1000K.
c The line ratio of [O i] is too large and no reasonable density can be derived for NGC253 (see Fig. 7 and next section).
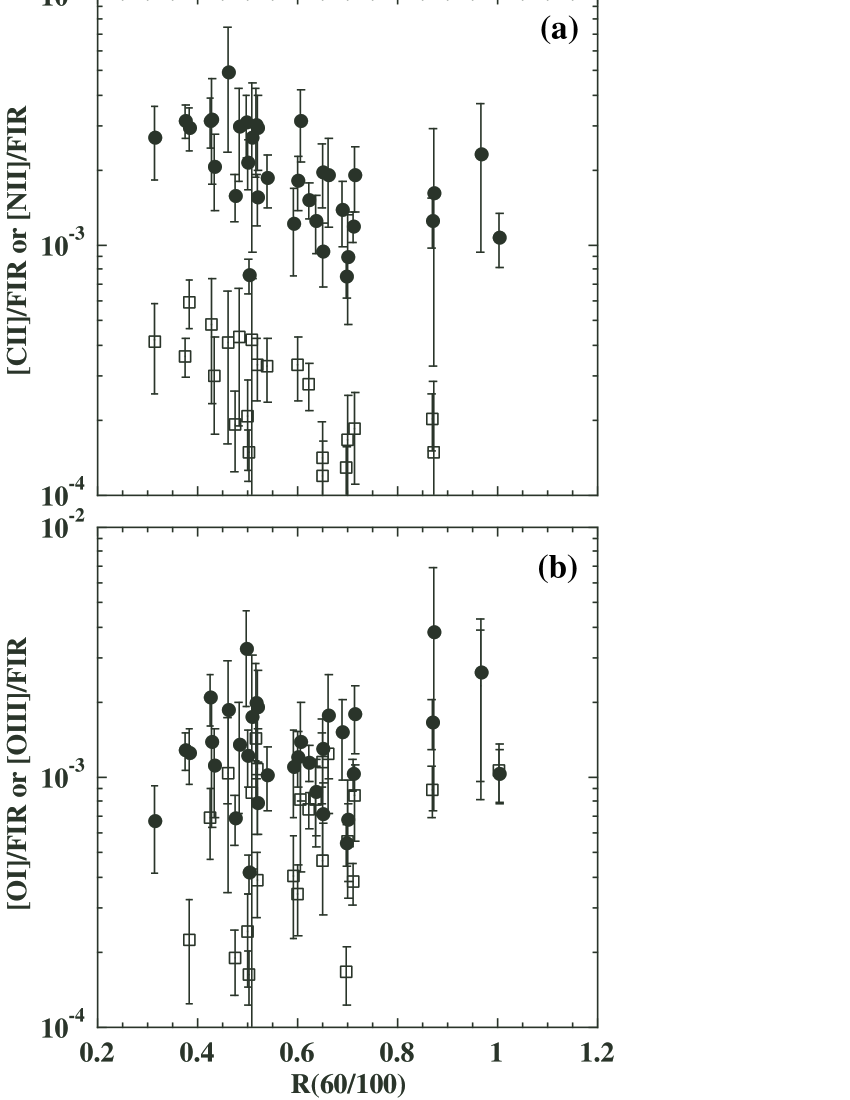
In Fig. 2a, the ratios of [C ii]158 m and [N ii]122 m fluxes to the far-infrared flux, [C ii] and [N ii], are plotted against the far-infrared color while the ratio [O i]63 m and [O iii]88 m to , [O i] and [O iii], are plotted against in Fig. 2b. Figure 2a indicates a trend that the ratio [C ii] decreases with . The ratio [N ii] also seems to decrease with . On the other hand, [O i] does not show a clear systematic trend with . There seems a weak trend that [O iii] increases with the color, though the scatter is quite large.
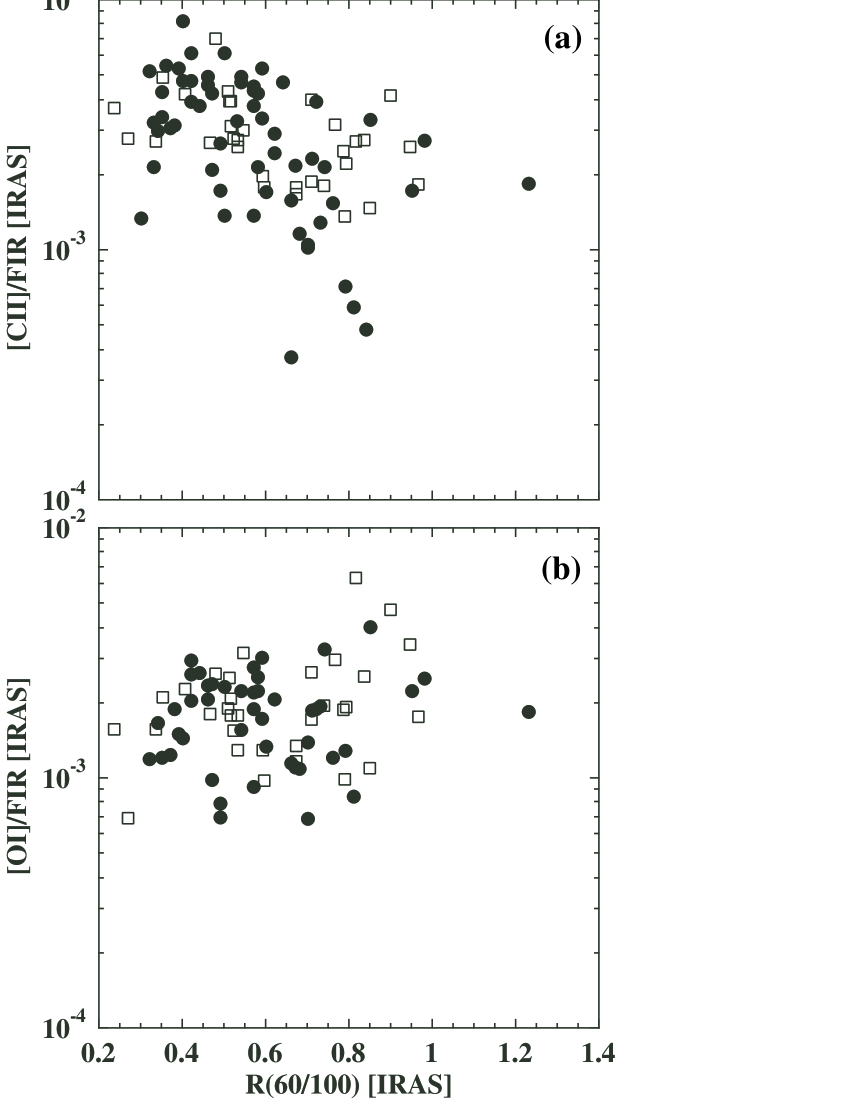
Similar trends in the ratios of the line intensities to the far-infrared intensity have been obtained for the normal galaxy sample (Malhotra et al. Malhotra1997 (1997), 2001b ). The present sample includes not only normal galaxies but also starburst galaxies and AGNs. In Fig. 3, we plot the data for normal galaxies by Malhotra et al. (2001b ) (filled circles) together with the present sample (open squares) for comparison. In the figure, the total far-infrared flux [IRAS] is derived by the formula of Helou et al. (Helou (1988)) based on the IRAS data to make direct comparison. Both show a similar trend to each other except that the data of normal galaxies seem to have a steeper trend with the color. AGNs (e.g., Cen A, Circinus, NGC1068, and NGC7582) are located in the same trend as normal and starburst galaxies, suggesting that the far-infrared emission of AGNs is driven mainly by star-formation activities.
3 Physical conditions of interstellar medium
Together with the [O i]63 m and 145 m lines, [C ii]158 m can be used to derive the physical conditions of the line-emitting regions based on PDR models (e.g., Tielens & Hollenbach TH85 (1985); Wolfire et al. WTH90 (1990); Hollenbach & Tielens Hollenbach (1997); Kaufman et al. Kaufman (1999)), in which the major model parameters are the incident FUV radiation field flux in units of the solar neighborhood value ( W m-2, Habing Habing (1968)) and the neutral hydrogen gas density . However, the [C ii] line could also originate from ionized regions and the fraction of the contribution cannot be estimated a priori.
To estimate the contribution to [C ii]158 m from PDRs, we take two approaches similar to Malhotra et al. (2001b ). First we assume that all the emission of [O i]63 m and far-infrared continuum (m) comes from PDRs. Since the temperature of sub-micron sized dust grains is determined by the intensity of the incident radiation (e.g., Onaka Onaka (2000)), can be estimated from the dust temperature derived by Eq. (1). We used a semi-analytical equation of and given by Hollenbach et al. (HTT91 (1991)) with = 0.5 because a major fraction of [C ii]158 m and [O i]63 m emissions stem from the region of (Kaufman et al. Kaufman (1999)). For M82 we derive , while Kaufman et al. (Kaufman (1999)) estimated by taking account of several observed line intensities, suggesting that the present method provides a reasonable estimate of .
Then we compare the ratio of [O i] with the PDR model of Kaufman et al. (Kaufman (1999)) with the derived to estimate . Finally we estimate the intensity of [C ii]158 m from PDRs with the derived and . The current estimate of the flux uncertainty is 20% and there may be an uncertainty in the PDR model due to the assumed geometry. While may be underestimated by a few tens % in the present analysis, it does not introduce a significant error compared to other uncertainties.
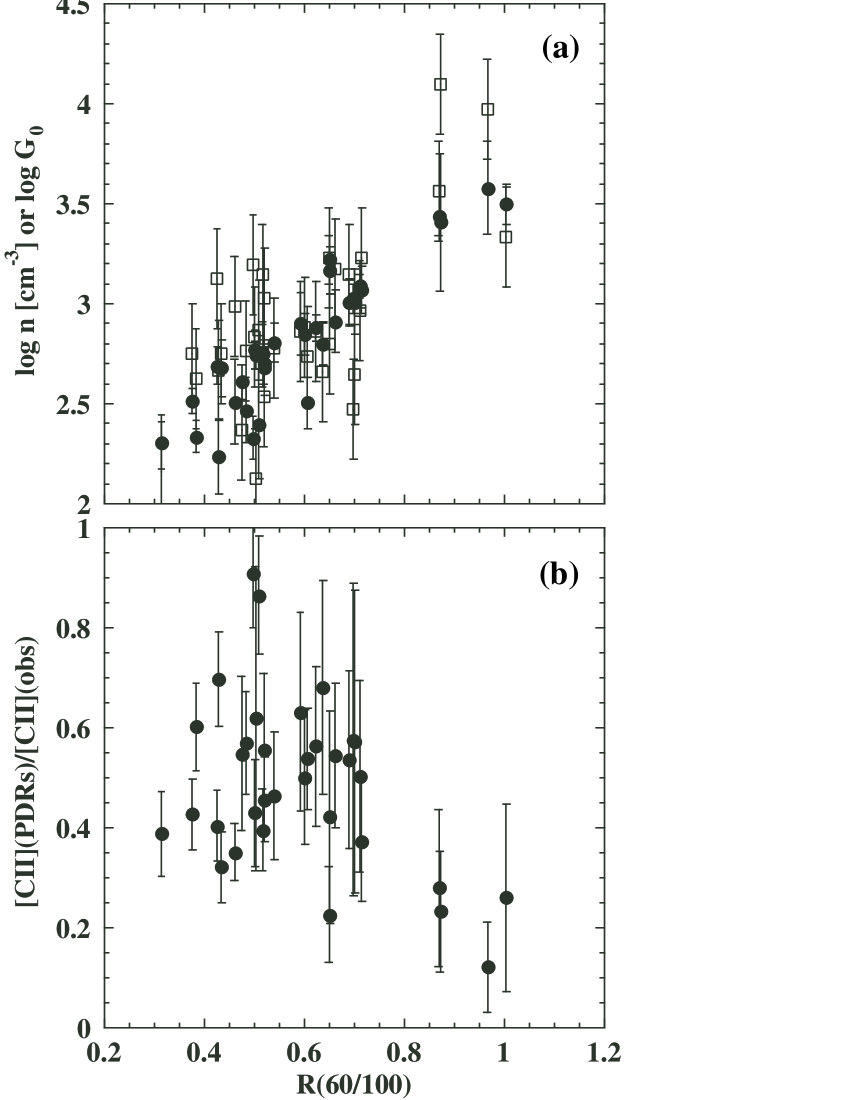
Figure 4 shows and against the color . The error in comes from the uncertainty in , while that in is estimated from the uncertainty in [O i] to be about based on the PDR models. Both parameters, and , increase clearly with and is found to be almost proportional to (, see also Fig. 10). The trend mainly comes from the observed constancy of [O i] against the color. In the PDR model the photoelectric heating efficiency is roughly a function of (Bakes & Tielens Bakes (1994)). For , the heating efficiency does not change and thus [O i] stays constant. The [C ii]158 m, on the other hand, decreases because the collisional de-excitation becomes efficient as increases: the [C II] line has a lower critical density for excitation ( cm-3) than [O i]63 m ( cm-3). In this situation, we expect an increase in the gas temperature. Because the gas temperature is already sufficiently high in the parameter range in question, the increase in the temperature does not affect the line intensities appreciably. Hence the decrease in [C ii] with color can be attributed to the increase in the collisional de-excitation of the [C ii] transition for the present sample of the galaxies. The [C ii]158 m emission from PDRs is estimated to be % of the total observed [C ii]158 m emission in the present analysis and the fraction of the PDR component is indicated to decrease with (Fig. 4b). Therefore, the decrease in the total [C ii] is attributed to the decrease in the PDR component due to the thermalization of the [C ii] transition.
In order to examine the reliability of the present data reduction and analysis we can compare the present results with those of previous works for some individual galaxies. The comparison is summarized in Table 4. Colbert et al. (1999) and Unger et al. (Unger (2000)) analyzed the same LWS data and derived and by using the PDR models of Kaufman et al. (1999) for M82 and Cen A, respectively. The present analysis provides fairly good agreement with their results. The line intensities derived in the present study also agree with those by Braine & Hughes (Braine (1999)) within the measurement errors. Carral et al. (Carral (1994)) reported the results of observations of NGC253 and NGC3256 by the KAO and obtained and based on the PDR models of Wolfire et al. (WTH90 (1990)). While the line fluxes are in agreement with the present results within the errors except for [O iii]88 m of NGC253, the present results indicate systematically low densities. The difference can be attributed to the relatively high gas temperature with the same and in the models of Kaufman et al. because their models include the additional gas heating due to polycyclic aromatic hydrocarbons (PAHs).
| object | ref.a | [O i]63 m | [O iii]88 m | [N ii]122 m | [O i]145 m | [C ii]158 m | ||
|---|---|---|---|---|---|---|---|---|
| (10-15Wm-2) | (10-15Wm-2) | (10-15Wm-2) | (10-15Wm-2) | (10-15Wm-2) | (cm-3) | |||
| M82 | p | 169 34 | 91 18 | 21 4 | 15 3 | 128 26 | 103.4 | 103.6 |
| 1 | 176 5 | 86 4 | 17 3 | 12 1 | 134 1 | 102.8 | 103.3 | |
| Cen A | p | 19 4 | 6.3 1.4 | 1.0 0.2 | 29 6 | 102.7 | 103.1 | |
| 2 | 19.6 | 7.0 | 1.5 | 1.1 | 29.1 | |||
| NGC4414 | p | 3.2 0.6 | 0.9 0.2 | 7.8 1.6 | ||||
| 3 | 3.3 1 | 1 0.5 | 1.3 0.4 | 10.6 2 | ||||
| NGC253 | p | 38 7.5 | 11.4 2.5 | 52 10 | 103 | 102.5 | ||
| 4 | 45 6 | 6 1 | 48 2 | 104.3 | 104 | |||
| NGC3256 | p | 12.8 2.6 | 6.0 1.3 | 13.7 2.7 | 103.1 | 103.2 | ||
| 4 | 14.3 2.6 | 4.8 1.2 | 11.7 2.5 | 103 | 103.9 |
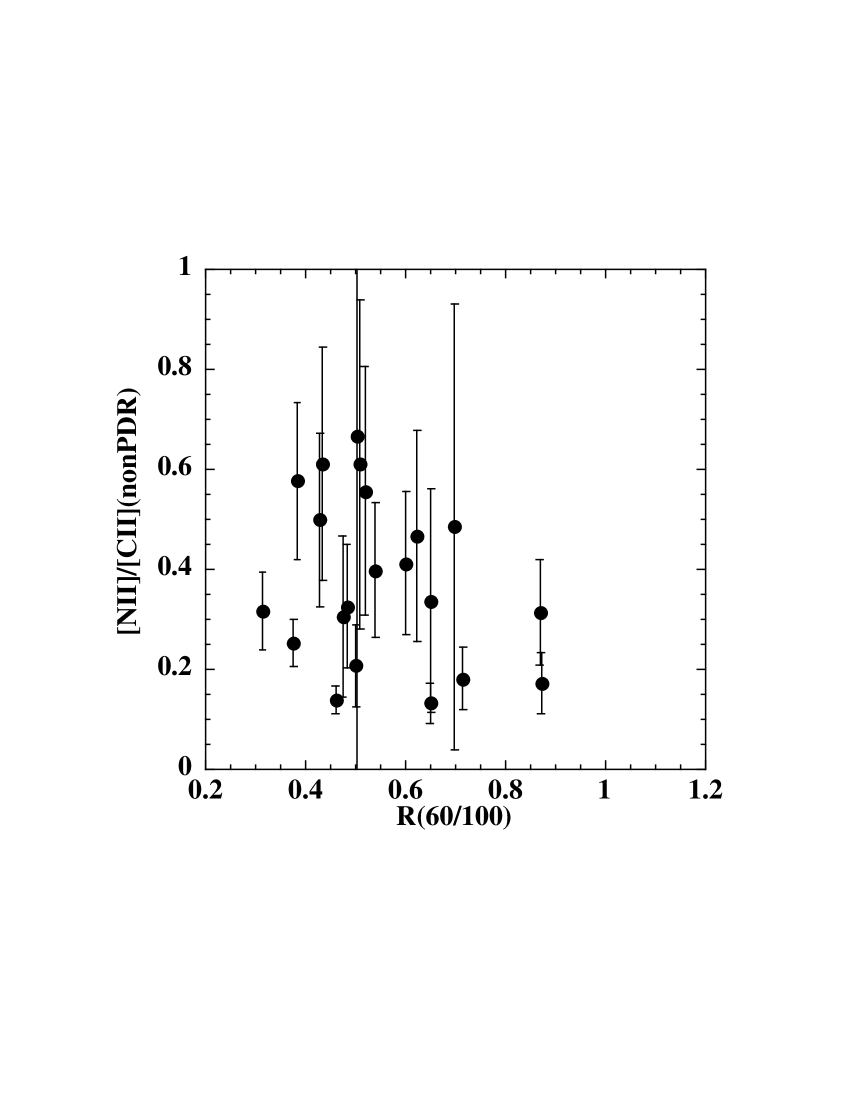
The [C ii] emission other than the PDR origin may be ascribed to the extended low density warm ionized medium (ELDWIM). A large fraction of [N ii]122 m line emission is thought to stem mostly from the ELDWIM (Wright et al. Wright (1991); Heiles Heiles (1994); Bennett et al. Bennett (1994); Petuchowski et al. Petuchowski (1994)). Figure 5 plots the ratio of the observed [N ii]122 m intensity to the non-PDR component of [C ii]158 m. The ratio shows a large scatter with a weak trend that the ratio decreases with . Because of the uncertainties the trend may be spurious (see below).
All the data points are located within the range in Fig. 5. The line ratio of [N ii]/[C ii] in the ionized gas depends on the electron density, but is insensitive to the temperature of the ionized gas. To estimate the line ratio expected from ionized gas we assume K and the abundance of []/[H+] = and []/[H+] = with the depletion factors as and in the following discussion (Heiles Heiles (1994)). We adopted the collision coefficients for from Stafford et al. (Stafford (1994)) and those for from Heiles (Heiles (1994)). Recent HST observations indicate that the interstellar abundance of carbon and nitrogen in the gas phase is fairly constant on various lines of sight in our Galaxy as (Sofia et al. sofia (1997)) and (Meyer et al. meyer (1997)). Based on these values the relative abundance of N to C will increase by 30%. The following discussion thus has an uncertainty of this level associated with the assumed abundance.
The lower boundary of the observed ratio 0.1 is then found to correspond to the low-density limit of the ratio in the ionized gas. The upper boundary 0.7 is obtained for a gas with = 120 cm-3. Petuchowski et al. (Petuchowski (1994)) reported a large [N ii]122 m to 205 m line ratio in the central 850pc of M82 compared to the average ratio of the Milky Way (Wright et al. Wright (1991)), indicating that a fair fraction of the [N ii] line emission comes from the ionized gas of cm-3 in M82. The ratio of [N ii]122 m to [C ii]158 m of non-PDR origin for M82 is about 0.3 in the present analysis, suggesting that there may be a significant contribution to the [CII] emission from the low density diffuse ionized gas in the outer part ( 850pc) of the galaxy. The observed intensity is compatible with the interpretation that the non-PDR component of [C ii]158 m comes from the ionized gas that emits [N ii]122 m.
The ionized gas also emits a radio continuum. The intensity of free-free transition is written for by
| (3) |
where is the electron density in cm-3 and is the path length in cm (Spitzer Spitzer (1978)). The intensity of the [C ii] line from the ionized gas is given by
| (4) |
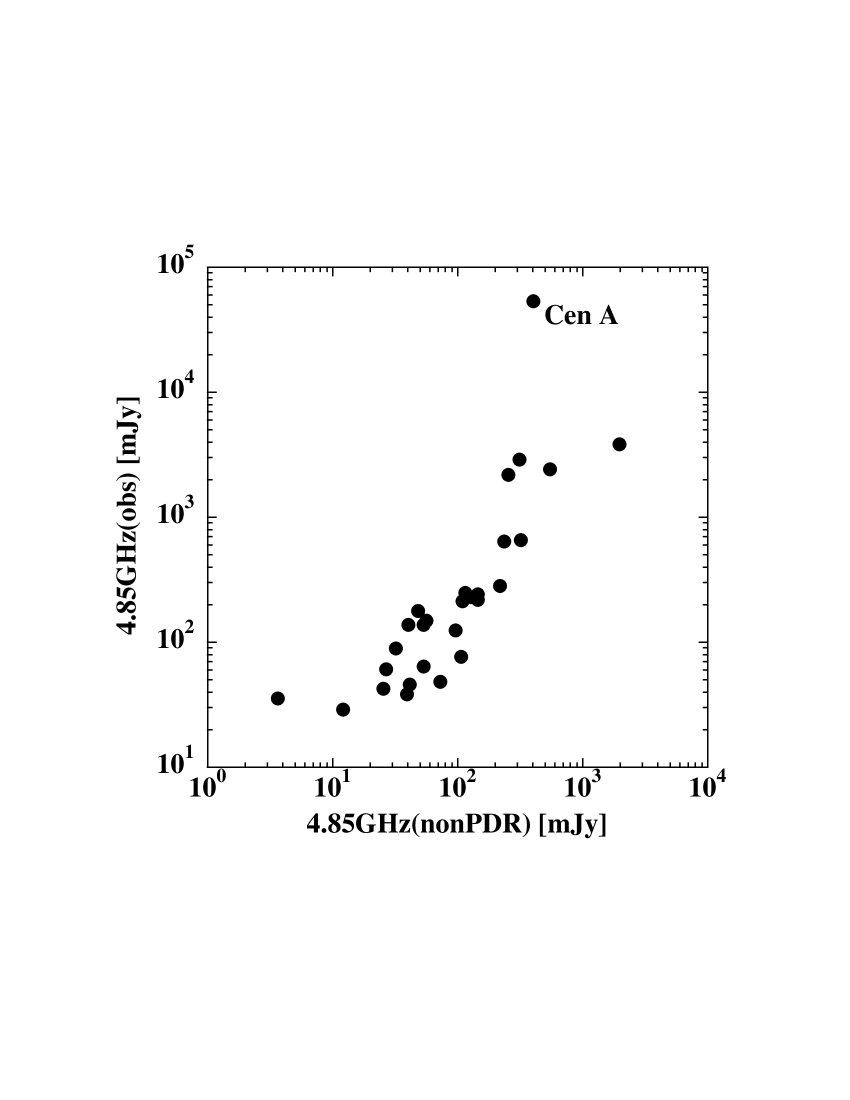
where is the cooling function of [C ii]158 m (e.g., Hayes & Nussbaumer H&N (1984)). For a given [C ii]158 m intensity, the corresponding radio continuum intensity increases with as can be estimated through Eqs. (3) and (4). As a conservative upper limit we assume that the non-PDR component of [C ii] 158 m emission comes from the ionized gas of density 200 cm-3. Figure 6 shows the comparison between the predicted and observed flux densities. We take the 4.85GHz radio continuum data from Becker et al. (Becker (1991)), Gregory & Condon (Gregory91 (1991)), Gregory et al. (Gregory94 (1994)), and Griffith et al. (Griffith (1994)). The beam size of the radio observations was about (FWHM). Observations of 1.49 GHz and 1.425 GHz indicate that most of the radio continuum emission comes from the area within about of the center of the infrared emission (Condon et al. Condon90 (1990), Condon96 (1996)). We assume that the observed 4.85 GHz emission also comes from the region within the LWS beam. The predicted value shows a positive correlation with the observed flux density except for Cen A. Cen A is a very strong radio source and most of the radio emission from Cen A is nonthermal (e.g. Sreekumar et al. Sreekumar (1999)). The observed radio intensities are larger than the upper limits predicted from [C ii]158 m emission of the non-PDR origin for most of the sample galaxies. Thus the non-PDR component of [C ii]158 m emission is compatible with the observed radio continuum intensity when it arises mostly from the low-density ionized gas for the present sample of galaxies.
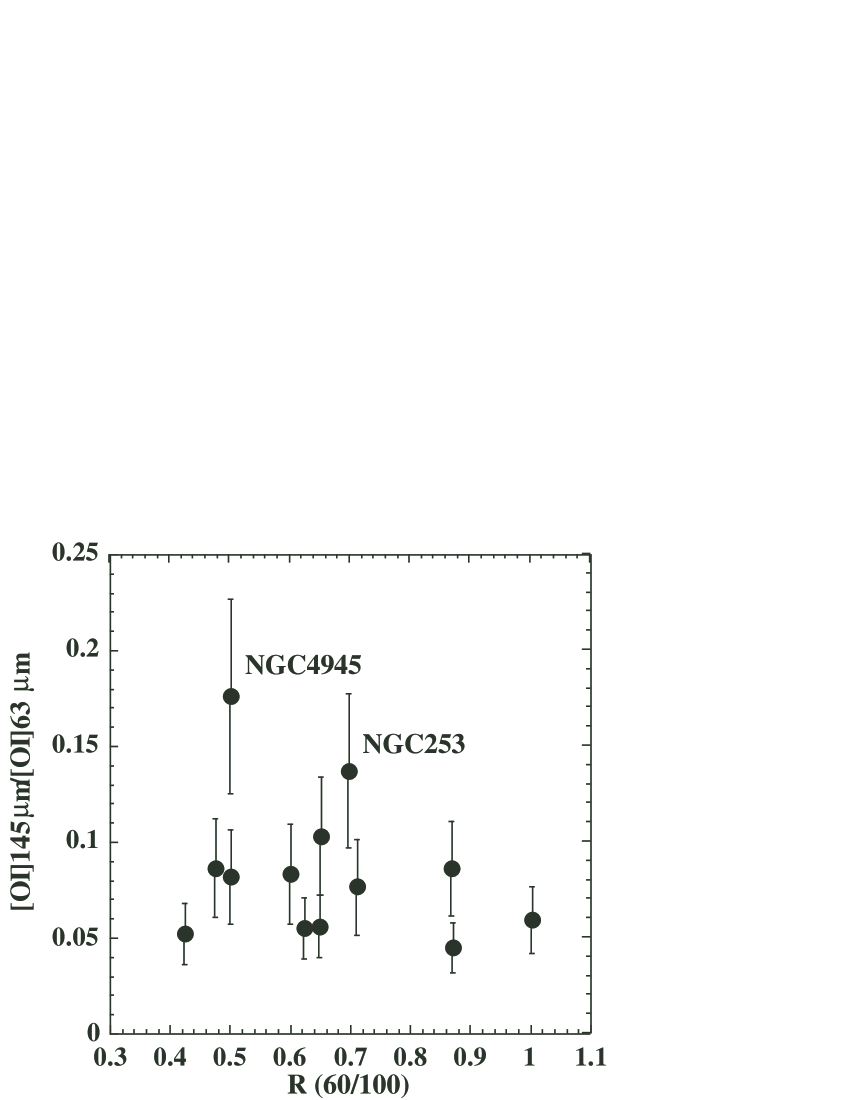
Figure 7 shows the ratio of [O i]145 m to [O i]63 m against . The observed ratio is in the range for most galaxies, which is in agreement with the prediction of the PDR model with the range of and estimated in the present analysis. The ratio does not exceed 0.1 within a reasonable range of the density and temperature (Watson watson1984 (1984)). However, a few galaxies clearly show higher ratios than the model. They are NGC4945 and NGC253, both of which have large inclination angles (for NGC4945 and NGC253, and , respectively). NGC520, which shows the third largest ratio, has . The absorption of [O i]63 m in the interstellar medium may affect the ratio in these galaxies. For a majority of the galaxies, however, this effect is probably not significant.
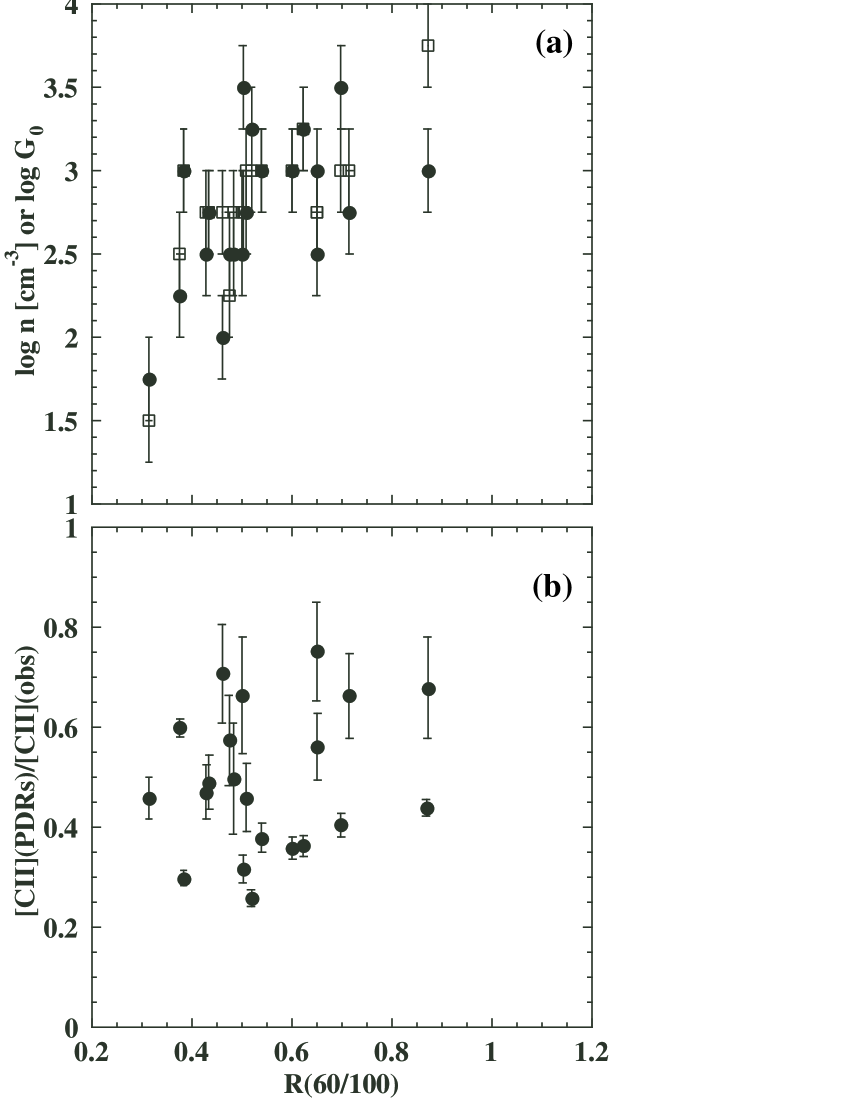
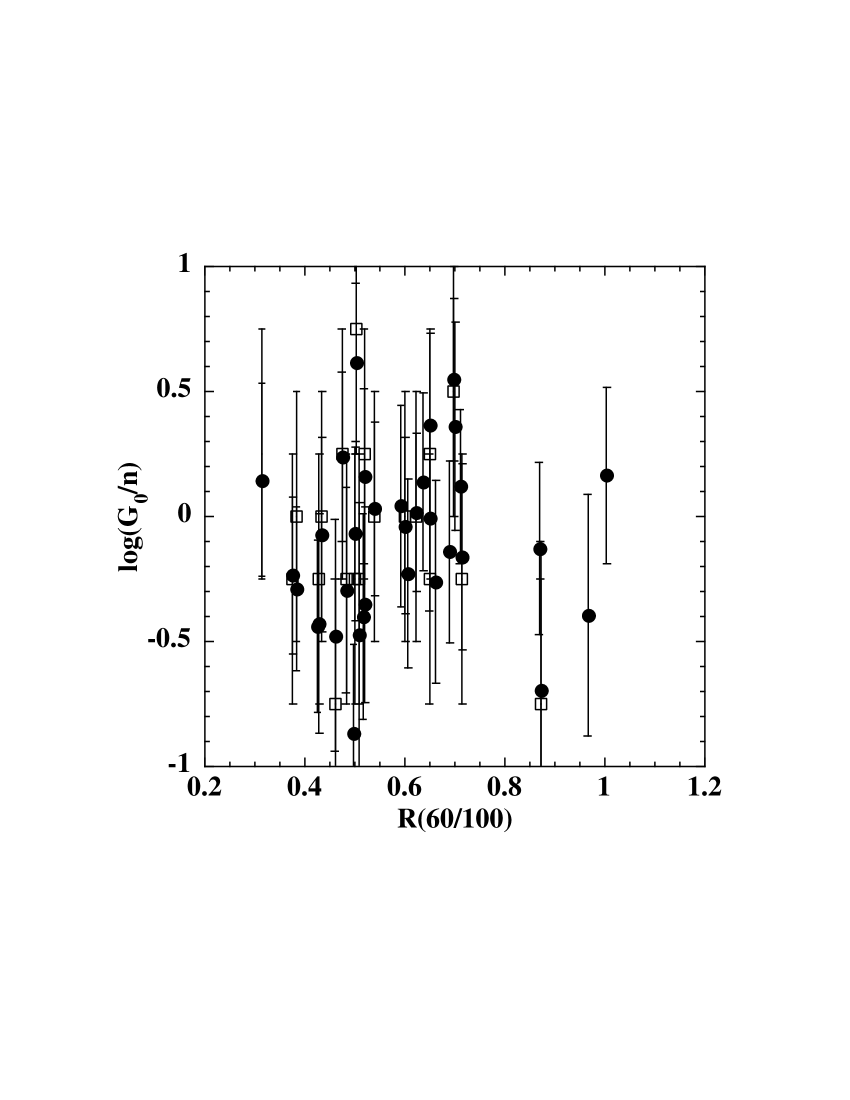
In the analysis described above it is difficult to properly evaluate the uncertainties in the comparison with the model. In order to examine how robust the derived conclusions are, we take another approach to estimate the PDR contribution to the [C ii]158 m line emission. Figure 5 indicates that there seems no strong trend in the ratio of [N ii]122 m to the non-PDR origin of [C ii]158 m. We thus simply assume that the contribution from the ionized gas to [C ii]158 m emission is proportional to the [N ii]122 m intensity. We take a mean value of Fig. 5 as
| (5) |
This relation corresponds to a gas of for K. We estimate the intensity of [C ii]158 m from the ionized gas based on the [N ii]122 m intensity by using Eq. (5) and attribute the rest to that coming from PDRs. We then estimate and from [O i]/[C ii] and ([C ii]+[O i]). Figure 8a shows and estimated in this method. The values of derived in this method are in agreement with those obtained in the first approach within the estimated errors. Thus the parameters derived in the second method are still compatible with the continuum spectrum of the LWS spectra. We have obtained the same trend as in the first approach: both and increase with the color and is roughly proportional to (see also Fig. 10). We conclude that the linear increase of with is a rather secure result for the present sample galaxies. The weak trend seen in Fig. 5 is not necessarily real. Figure 8b shows the fraction of the PDR component of [C ii] emission derived in this analysis, suggesting that the PDR component does not vary with in contrast to Fig. 4b. Thus in this analysis the decrease in [C ii] can be interpreted in terms mainly of the decrease in the ionized component relative to as indicated in the decrease in [N ii] (Fig. 2a), though the decrease in [C ii](PDR) due to the thermalization also contributes partly.
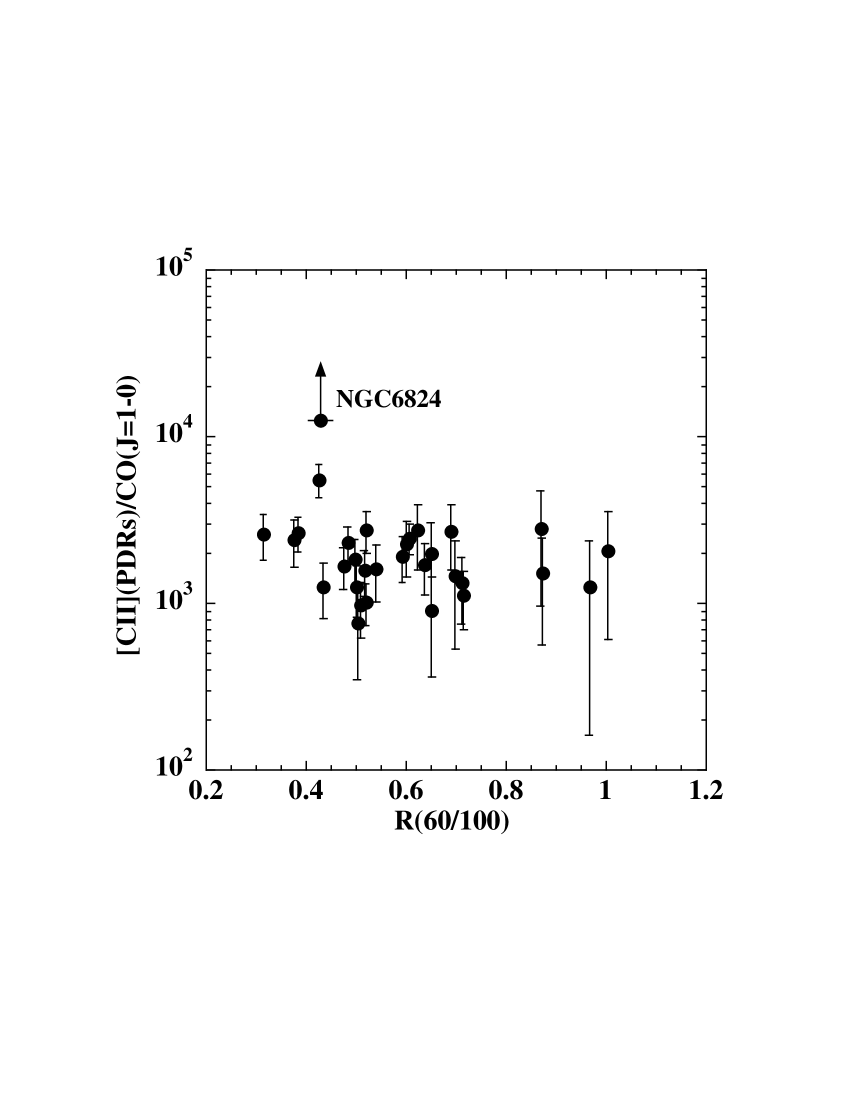
The ratio of [C ii]158 m to (J=1-0) line intensity is another measure for the diagnosis of PDRs. Because is converted to CO as the gas shielding to prevent CO from dissociation becomes efficient, the thickness of layer is a function of (Mochizuki & Onaka Mochizuki2001 (2001)). The intensity ratio increases with and decreases with and it is a function of in the range of and in question (Pierini et al. Pierini (1999); Kaufman et al. Kaufman (1999); Mochizuki & Nakagawa Mochizuki (2000)). Metallicity also plays an important role in the to CO conversion (Mochizuki et al. Mochizuki1994 (1994)). Hence, unless there is an appreciable variation in the metallicity in the sample galaxies, the ratio of [C ii]/CO approximately varies with . Figure 9 plots the ratio against the color. The CO data are taken from Young et al. (Young (1995)), Elfhag et al. (Elfhag (1996)), Aalto et al. (Aalto (1995)), Curran et al. (Curran (2001)), Stacey et al. (Stacey (1991)), and Eckart et al. (Eckart (1990)). The CO observations had the beam size of ″. We assume that the CO emission comes mostly from the central part of the galaxies and did not make any corrections for the beam size. Except for NGC6824, the ratio stays almost constant, supporting . The constancy of is also confirmed by the [C ii]/CO ratio. The CO (J=1-0) emission in NGC6824 was not detected (Young et al. Young (1995)). With the upper limit the ratio of [C ii]/CO is estimated to be larger than 104, which is in a similar range to those found in quiet spirals (Smith & Madden Smith (1997)). The values of the observed ratio of the other galaxies are in agreement with those observed in Galactic PDRs (Stacey et al. Stacey (1991)). It is slightly smaller than the values predicted in the PDR model.
4 Discussion
Malhotra et al. (Malhotra1997 (1997), 2001b ) have examined six possible interpretations for the observed decrease in [C ii] with the FIR color and favored the interpretation that the charge up of dust grains reduces the efficiency of photoelectric heating. When dust grains are charged positively under strong ultraviolet radiation, the Coulomb potential prevents electrons from escaping and thus the photoelectric heating efficiency decreases. The electric charge of dust grains is determined by the balance between ionization and recombination and is a good measure to indicate the electrical potential of dust grains and thus the heating efficiency in the parameter range obtained in the present study, and (Bakes & Tielens Bakes (1994); Kaufman et al. Kaufman (1999)).
To examine this hypothesis, we plot against in Fig. 10. There is no clear trend seen in the figure, suggesting that at least for the present sample of galaxies does not increase with the color. The present sample contains starburst galaxies compared to the sample of Malhotra et al. (2001b ). The charge up of dust grains is supposed to occur more easily in starbursts than in normal galaxies. However, the decrease of [C ii] is more steep in Malhotra et al. sample than in the present sample (Fig. 3a). The interpretation of charge up of dust grains seems to not play a significant role in the trend of [C ii]. Instead we suggest that the decrease could be attributed to either the increase in the de-excitation of the [C ii]158 m and/or the decrease in the ionized gas component. The former possibility has been pointed out also by Genzel & Cesarsky (Genzel (2000)). The latter possibility can be examined by observations of [N ii]205 m which together with the [N ii]122 m intensity allow a better estimate of [C ii]158 m emission from the ionized gas. The decrease in the ionized gas component may be a consequence of the relative increase in the far-infrared intensity related to the activities. Helou et al. (Helou2001 (2001)) have also suggested that the decrease of the ratio could result from the decrease in the importance of PAHs or small grains in gas heating based on the observed correlation between [C ii]158 m and the m intensities.
Based on the observations of H, H i, CO, and far-infrared continuum, Kennicutt (Kennicutt (1998)) has investigated the global Schmidt law in galaxies and found that the disk-averaged star formation surface density is proportional to with , where is the surface density of the gas. The present results indicate with (see Sect. 3). If simply indicates the global star-formation rate (SFR) in galaxies, this relation suggests a similar dependence of SFR on the volume gas density of star-forming regions and little variation in the scale height of star-forming gas distribution in galaxies.
The present galaxy sample contains AGNs, starburst, and normal galaxies, and the present results are quite similar to those for the normal galaxy sample (Malhotra et al. 2001b ). Thus they are thought to indicate general characteristics of far-infrared properties for a wide range of galaxies, though irregular, early-type, and quiescent spiral galaxies may show slightly different characteristics (see Smith & Madden Smith (1997); Leech et al. Leech (1999); Malhotra et al. 2001a ; Hunter et al. Hunter (2001)). We do not see any clear difference in the trends for AGNs in the present sample, suggesting that the far-infrared properties in AGNs are also driven by star-forming activities. A similar conclusion has been drawn for Cen A by Unger et al. (Unger (2000)). ISOPHT observations of CfA Seyfert sample by Pérez García et al. (Perez (1998)) also indicate that FIR SED of Seyferts can be interpreted in terms of the thermal emission from star-forming regions.
We summarize the general trends in the far-infrared properties:
| (6) |
| (7) |
| (8) |
and
| (9) |
The last relation of [O iii] has a large scatter and should be taken with caution.
The present analysis also suggests a general relation between the typical density in the galaxy and the far-infrared color as
| (10) |
These relations suggest a possibility that the physical properties of distant galaxies can be estimated solely from the far-infrared color. They can also be used in the comparison of the physical properties of distant galaxies to examine differences from nearby galaxies in the activities, if any, in observations by future space missions, such as SIRTF, ASTRO-F, and Herschel Space Observatory.
5 Summary
We have investigated the LWS spectra of m for 34 nearby galaxies. In addition to the detected emission line intensities, we estimated the far-infrared intensity from submicron grains from the continuum emission of m and derived the average dust temperature. We obtained the following results.
-
1.
We have found that the ratios of [C ii]158 m and [N ii]122 m flux to the total far-infrared flux decrease as the far-infrared color becomes bluer, but the ratio of [O i]63 m to does not show a systematic trend with the color. The ratio of [O iii]88 m to shows a large scatter with a weak trend of increase with the color. These are similar to those obtained for the normal galaxy sample by Malhotra et al. (2001b ).
-
2.
There is no clear difference seen between AGNs and starburst galaxies in the present sample in these trends, suggesting that even in AGNs the far-infrared properties are dominated by star-formation activities.
-
3.
Based on the comparison with the PDR model by Kaufman et al. (Kaufman (1999)), we found that the typical neutral gas density in galaxies increases linearly with the radiation field intensity.
-
4.
About a half of the observed [C ii]158 m emission is estimated to come from PDRs. The rest can be attributed to that coming from the diffuse ionized gas that emits the [N ii]122 m line.
-
5.
The observed decrease in [C ii]158 m with the FIR color can be interpreted in terms of either the increase in the collisional de-excitation in the [C ii] transition at high density or the decrease in the ionized component. Decrease in the photoelectric yield due to the charge up of dust grains does not seem to play a primary role in the observed trend.
-
6.
We summarize the relations among the far-infrared properties for the present sample galaxies. These are thought to indicate the general characteristics for a wide range of galaxies, including starburst, AGNs, and normal galaxies and can be used as a measure in the investigation of activities in distant galaxies in future observations.
Acknowledgements.
The authors thank all the members of Japanese ISO group, particularly H. Okuda, K. Kawara, and Y. Satoh for their continuous help and encouragement and Y. Okada for her help in the calculation of the line ratios. K.W.C. was supported by the JSPS Postdoctoral Fellowship for Foreign Researchers. This work was supported in part by Grant-in-Aids for Scientific Research from the JSPS.References
- (1) Aalto, S., Booth, R. S., Black, J. H., Johansson, L. E. B. 1995, A&A, 300, 369
- (2) Bakes, E. L. O., & Tielens, A. G. G. M. 1994, ApJ, 427, 822
- (3) Becker, R. H., White, R. L., & Edwards, A. L. 1991, ApJS, 75, 1
- (4) Bennett, C. L., Fixsen, D. J., Hinshaw, G., et al. 1994, ApJ, 434, 587
- (5) Braine, J., Hughes, D. H. 1999, A&A, 344, 779
- (6) Carral, P., Hollenbach, D. J., Lord, S. D., et al. 1994, ApJ, 423, 223
- (7) Clegg, P. E., Ade, P. A. R., Armand, C., et al. 1996, A&A, 315, L38
- (8) Colbert, J. W., Malkan, M. A., Clegg, P. E., et al. 1999, ApJ, 511, 721
- (9) Condon, J. J., Helou, G., Sanders, D. B., Soifer , B. T. 1990, ApJS, 73, 359
- (10) Condon, J. J., Helou, G., Sanders, D. B., Soifer , B. T. 1996, ApJS, 103, 81
- (11) Crawford, M. K., Genzel, R., Townes, C. H., Watson, D. M. 1985, ApJ, 291, 755
- (12) Curran, S. J., Johansson, L. E. B., Berman, P., Heikkilä, Aalto, S. 2001, A&A, 367, 457
- (13) Dale, D. A., Helou, G., Contursi, A., Sibermann, N. A., Kolhatkar, S. 2001, ApJ, 549, 215
- (14) de Jong, T. 1977, A&A, 55, 137
- (15) Desert, F. X., Boulanger, F., Shore, S. N. 1986, A&A, 160, 295
- (16) Dwek, E., Arendt, R. G., Fixsen, D. J., et al. 1997, ApJ, 475, 565
- (17) Eckart, A., Cameron, M., Rothermel, H., et al. 1990, ApJ, 363, 451
- (18) Elfhag, T., Booth, R. S., Höglund, B., Johansson, L. E. B., Sandqvist, Aa. 1996, A&AS, 115, 439
- (19) Fischer, J. 2000, ESASP, 456, 239
- (20) Genzel, R., Cesarsky, C. J. 2000, ARA&A, 38, 761
- (21) Gregory, P. C. & Condon, J. J. 1991, ApJS, 75, 1011
- (22) Gregory, P. C., Vavasour, J. D., Scott, W. K., Condon, J. J. 1994, ApJS, 90, 173
- (23) Griffith, M. R., Wright, A. E., Burke, B. F., Ekers, R. D. 1994, ApJS, 90, 179
- (24) Gry, C., The ISO Handbook, Volume IV: LWS - The Long-Wavelength Spectrometer
- (25) Habing, H. J. 1968, Bull. Astro. Inst. Netherlands, 19, 421
- (26) Hayes, M. A. & Nussbaumer, H. 1984, A&A, 134, 193
- (27) Heiles, C. 1994, ApJ, 436, 720
- (28) Helou, G., Khan, I. R., Malek, L., Boehmer, L. 1988, ApJS, 68, 151
- (29) Helou, G., Malhotra, S., Hollenbach, D. J., et al. 2001, ApJ, 548, L73
- (30) Hollenbach, D. J., Tielens, A. G. G. M. 1997, ARA&A, 35, 179
- (31) Hollenbach, D. J., Takahashi, T., Tielens, A. G. G. M. 1991, ApJ, 377, 192
- (32) Hunter, D., Kaufman, M., Hollenbach, D., et al. 2001, ApJ, 553, 121
- (33) Kaufman, M. J., Wolfire, M. G., Hollenbach, D. J., Luhman, M. L. 1999, ApJ, 527, 795
- (34) Kennicutt, R. C. 1998, ApJ, 498, 541
- (35) Leech, K. J., Völk, H. J., Heinrichsen, I., et al. 1999, MNRAS, 310, 317
- (36) Li, A., & Draine, B. T. 2001, ApJ, in press
- (37) Lord, S. D., Malhotra, S., Lim, T., et al. 1996. A&A, 315, L117
- (38) Luhman, M. L., Satyapal, S., Fischer, J., et al. 1998, ApJ, 504, L11
- (39) Madden, S. C., Geis, N., Genzel, R., et al. 1993, ApJ, 407, 579
- (40) Malhotra, S., Helou, G., Stacey, G., et al. 1997, ApJ, 491, L27
- (41) Malhotra, S., Hollenbach, D. Helou, G., et al. 2001, ApJ, 543, 636
- (42) Malhotra, S., Kaufman, M. J., Hollenbach, D., et al. 2001, ApJ, submitted
- (43) Meyer, D. M., Cardelli, J. A., Sofia, U. J. 1997, ApJ, 490, L103
- (44) Mochizuki, K., & Nakagawa, T. 2000, ApJ, 535, 118
- (45) Mochizuki, K., & Onaka, T. 2001, A&A, 370, 868
- (46) Mochizuki, K., Nakagawa, T., Doi, Y., et al. 1994, ApJ, 436, L37
- (47) Moorwood, A. F. M., Baluteau, J.-P., Anderegg, M., et al, ApJ, 238, 565
- (48) Onaka, T. 2000, Adv. Space Res., 25, 2167
- (49) Pérez García, A. M., Rodríguez Espinosa, J. M., Santolaya Rey, A. E. 1998, ApJ, 500, 685
- (50) Petuchowski, S. J., Bennett, C. L., Haas, M. R., et al. 1994, ApJ, 427, L17
- (51) Pierini, D., Leech, K. J., Tuffs, R. J., Völk, H. J. 1999, MNRAS, 303, L29
- (52) Shibai, H., Okuda, H., Nakagawa, T, et al. 1991, ApJ, 374, 522
- (53) Smith, B. J. & Harvey, P. M. 1996, ApJ, 468, 139
- (54) Smith, B. J. & Madden, S. C. 1997, AJ, 114, 138
- (55) Sofia, U. J., Cardelli, J., Guerin, K. P., Meyer, D. M. 1997, ApJ, 482, L105
- (56) Spitzer, L. 1978, Physical Processes in the Interstellar Medium (New York: Wiley)
- (57) Sreekumar, P., Bertsch, D. L., Hartman, R. C., Nolan, P. L., Thompson, D. J. 1999, Astroparticle Physics, 11, 221
- (58) Stacey, G. J., Geis, N., Genzel, R., et al. 1991, ApJ, 373, 423
- (59) Stafford, R. P., Bell, K. L., Hibbert, A., Wijesundera, W. P. 1994, MNRAS, 268, 816
- (60) Tielens, A. G. G. M. & Hollenbach, D. 1985, ApJ, 291, 722
- (61) Unger, S. J., Clegg, P. E., Stacey, G. J., et al. 2000, A&A, 355, 885
- (62) Watson, W. D. 1972 ApJ, 176, 103
- (63) Watson, W. D. 1984, in Galactic and Extragalactic Infrared Spectroscopy, ed. M. F. Kessler & J. P. Phillips (Dordrecht: Riedel), p195
- (64) Wolfire, M. G., Tielens, A. G. G. M., & Hollenbach, D. 1990, ApJ, 358, 116
- (65) Wright, E. L., Mather, J. C., Bennett, C. L., et al. 1991, ApJ, 381, 200
- (66) Young, J. S., Xie, S., Tacconi, L., et al. 1995, ApJS, 98, 219