Horizontal-Branch Models and the Second-Parameter Effect.
IV. The Case of M3 and Palomar 3
Abstract
We present a detailed analysis of the “second-parameter pair” of globular clusters M3 (NGC 5272) and Palomar 3. Our main results can be summarized as follows: i) The horizontal-branch (HB) morphology of M3 is significantly bluer in its inner regions (observed with the Hubble Space Telescope) than in the cluster outskirts (observed from the ground), i.e., M3 has an internal second parameter. Most plausibly the mass loss on the red giant branch (RGB) has been more efficient in the inner than in the outer regions of the cluster. ii) The dispersion in mass of the Pal 3 HB is found to be very small—consistent with zero—and we argue that this is unlikely to be due to a statistical fluctuation. It is this small mass dispersion that leads to the most apparent difference in the HB morphologies of M3 and Pal 3. iii) The relative HB types of M3 and Pal 3, as measured by mean colors or parameters involving the number of blue, variable, and red HB stars, can easily be accounted for by a fairly small difference in age between these clusters, of order 0.5–1 Gyr—which is in good agreement with the relative age measurement, based on the clusters’ turnoffs, by VandenBerg (2000).
1 Introduction
Many recent studies of the globular clusters (GCs) in the outer halo of our Galaxy have focused on the age difference between these distant clusters and those located in the inner halo. Since Mironov & Samus (1974) and Searle & Zinn (1978), it has been widely recognized that the possible existence of such age differences would have important implications for our understanding of the early stages of the formation of the Galaxy (e.g., van den Bergh 1993; Zinn 1993; Lee, Demarque, & Zinn 1994; Majewski 1994). While in these early studies the morphology of the horizontal branch (HB) was assumed to be a safe relative age indicator—a critical working hypothesis in those days, given the tremendous challenge that accurate and precise photometry reaching below distant clusters’ turnoffs (the primary stellar evolution “clock”) represented—more recently Hubble Space Telescope (HST) photometry of the most distant GCs in the Galaxy have allowed a direct and precise estimate of the position of their main-sequence turnoffs, thus enabling the direct determination of their ages as compared to closer GCs with good ground-based photometry (Harris et al. 1997; Stetson et al. 1999; VandenBerg 2000).
As a result, it was found that the most massive of the extreme outer-halo GCs, NGC 2419, has the same age as the well-studied metal-poor, inner-halo GC M92 = NGC 6341 (Harris et al. 1997). It is worth noting that M92 is often considered to be one of the oldest GCs in the Galaxy (e.g., Bolte & Hogan 1995). This result gives support to the growing notion that the first episodes of star formation occurred more or less simultaneously throughout most of the Local Group (van den Bergh 1999, 2000; Grebel 2001; and references therein).
![[Uncaptioned image]](/html/astro-ph/0106554/assets/x1.png)
On the other hand, recent HST studies of the sparse outer-halo GCs Palomar 3, Palomar 4, and Eridanus have indicated that they, unlike NGC 2419, might be younger than inner-halo GCs of similar metallicity.111For the definition of “outer” and “inner” halo, see the discussion in §7 of Borissova et al. (1997). Since these globulars are also commonly considered typical cases of loose GCs with predominantly red HBs, they are often quoted as “second-parameter” GCs. For instance, Gratton & Ortolani (1984) note that the HBs of Pal 3 and Pal 4 “are too red for [their] metal abundances,” thus confirming “the need of a second parameter to explain the morphology of the red HBs of outer halo clusters” (see also Stetson et al. 1999 and VandenBerg 2000, who explicitly compare Pal 3 against M3, on the one hand, and Pal 4/Eridanus against M5, on the other hand).
As widely discussed in the literature, perhaps the primary second-parameter candidate is age, though it remains to be proved that age is the only, or even the most important, second parameter (see, e.g., Stetson, VandenBerg, & Bolte 1996; Sarajedini, Chaboyer, & Demarque 1997; Fusi Pecci & Bellazzini 1997; Catelan 2000 and references therein).
This notwithstanding, that age is the second parameter has been a frequently adopted assumption in the astronomical literature, both for Galactic and extragalactic GCs (e.g., Sarajedini et al. 1998). Therefore, it is of paramount importance to investigate whether the observed HB morphology differences are consistent with such a hypothesis for systems with detected turnoff age differences. Arguably, this is also a necessary step before we can be in a position to reliably explore the role (if any) of other second parameter candidates besides age; after all, if age differences can be shown to be compatible with the observed differences in HB morphology for second-parameter pairs, one might invoke Occam’s Razor in support of the view that, since no other second parameters besides age are required, then no other second parameters besides age actually exist.
Original work by Ortolani & Gratton (1989) had previously hinted that the “second parameter,” in the case of Pal 3 and M3, might indeed be age. On the other hand, the preliminary HST report by Richer et al. (1996; see their Table 1) supported an age difference of Gyr between Pal 3 and M3, which—if confirmed—would obviously rule out age as the second parameter for this pair.
More recently, both Stetson et al. (1999) and VandenBerg (2000) conducted much more detailed comparisons of the HST turnoff ages of the outer-halo GCs Pal 3, Pal 4, and Eridanus with those of M3 = NGC 5272 (in the case of Pal 3) and M5 = NGC 5904 (in the cases of Pal 4 and Eridanus). Curiously, the age differences favored by Stetson et al. and by VandenBerg differ by , even though they are based on the same HST data—with VandenBerg’s analysis generally supporting smaller age differences for the same second-parameter pairs. (The reasons for such differences are discussed in great detail by VandenBerg.) Two additional extreme outer-halo GCs, Pal 14 and AM-1, were observed by the same team during HST’s Cycle 6 (GO-6512, PI Hesser), but, to the best of our knowledge, no results of this investigation have been reported in the literature as yet.
In the previous paper of this series (Catelan 2000), we analyzed the outer-halo GCs Pal 4 and Eridanus in the context of the “second-parameter” phenomenon. In particular, we have quantitatively investigated whether the turnoff ages of these outer-halo GCs, as compared to M5, are consistent with their HB morphologies (M5 having by far the bluer HB). The main conclusion of that study was that the HST turnoff age difference, whether as measured by Stetson et al. (1999) or by VandenBerg (2000), is too small to fully explain the second-parameter effect seen in the case of Pal 4/Eridanus vs. M5.
The purpose of the present paper is to extend Catelan’s (2000) analysis of the outer-halo GCs by carrying out a detailed investigation of M3 and Pal 3, which we shall assume to be a bona-fide “second-parameter pair” (Burbidge & Sandage 1958; Gratton & Ortolani 1984; Ortolani & Gratton 1989; Stetson et al. 1999; VandenBerg 2000). In particular, our goal is to answer the following question: Assuming that M3 and Pal 3 is a bona-fide second-parameter pair, are the HB morphology differences between these clusters consistent with the hypothesis that age is the second parameter of HB morphology?
We begin in the next section by describing the HB morphology of M3 as a function of distance from the cluster center, showing that the HB of the cluster is significantly bluer in its center than in the outermost regions. The CMD of Pal 3, as obtained from the HST-WFPC2 data of Stetson et al. (1999), is also presented and discussed; previous ground-based photometry of the cluster is also briefly addressed. In §3, we build synthetic models of the HBs of the two clusters, and present our best-fitting solutions. In §4, the relative turnoff ages of M3 and Pal 3, as determined by Stetson et al. and by VandenBerg (2000), are compared with the relative ages that are required to account for their different HB types, under the assumption that age is the second parameter of HB morphology. Our concluding remarks, with emphasis on the evidence of “local” second parameters leading to the most apparent difference in HB morphology between M3 and Pal 3, are finally presented in §5.
2 Observational Data
2.1 HB Morphology of M3
During the last 10 years we collected and published a large photometric data base on M3. Using different techniques (photographic plates: Buonanno et al. 1994; ground-based CCD photometry: Ferraro et al. 1993, Ferraro et al. 1997a, Carretta et al. 1998; HST-WFPC2: Ferraro et al. 1997b), we secured a huge sample covering the entire cluster extension from the very center of the cluster up to . On the basis of this dataset we constructed one of the largest and most complete luminosity functions for evolved stars (brighter than the main-sequence turnoff) ever published for a GC (Rood et al. 1999).
Using such a dataset we investigated the HB morphology in M3 and discovered that it turns out to be significantly bluer in the inner region than in the outskirts. While a full paper (in preparation) is devoted to accurately discussing the HB morphology variation as a function of the distance from the cluster center, here we want to point out the sharp difference in the HB star distribution between the innermost and the outermost regions. Figure 1 shows the M3 CMDs for the innermost (, panel a) and the outermost (, panel b) samples. A box has been plotted to schematically indicate the location of the variable (RR Lyrae–type) stars; the corresponding number is also provided. Figs. 1c–f, as well as Figs. 2–5, refer to our theoretical modelling of the cluster, and will be discussed in §3.1.
More information on population ratios is summarized in Table 1. In column 1, the radial range is given. In column 2, the type of data utilized (HST-WFPC2, ground-based photographic photometry) is indicated. In columns 3, 4, and 5, one finds , , and values, respectively. The corresponding ratios are listed in column 6. In columns 7 through 9, the values of the Mironov (1972), Lee–Zinn (Zinn 1986; Lee et al. 1994), and Buonanno (1993) HB morphology parameters, respectively, are given. The last three columns provide the values of some additional HB morphology parameters defined by Catelan et al. (2001); we briefly recall that represents the number of HB stars redder than , whereas and represent the number of blue HB stars redder than and , respectively.
As can be seen from Fig. 1, in selecting different groups along the HB we followed the criteria described in Buonanno et al. (1994) and Ferraro et al. (1997a): in particular, both “Extreme Blue” (EB), with , and “Extreme Red” (ER), with or , HB stars have been excluded from the and number counts, respectively. In fact, these stars might be “non genuine” HB stars, in the sense that they may derive from different (non-canonical) phenomena: ER objects might represent the progeny of the large blue straggler population discovered in this cluster (Ferraro et al. 1993, 1997b); and EB stars could derive from (say) late collisonal mergers (Bailyn & Iben 1989). In any event, ER and EB stars represent a very minor fraction of the total HB population of M3—3.3% and 2.6%, respectively—so that the results of this paper are not seriously affected by our not having included them in the number counts reported in Table 1.
As can be seen from the data plotted in Figs. 1a,b and summarized in Table 1, the detected difference in the M3 HB morphology is sharp and significant. It is difficult to attribute it to any spurious effects (due to crowding, etc.) or to any additional source of error associated with the photometry. Furthermore, the limiting magnitude of the M3 photometry is several magnitudes below the instability strip level in Figs. 1a,b, ruling out significant differential incompleteness in HB star detection from one side of the HB to the other. In our view this represents clear-cut evidence that a mechanism able to modify the star distribution along the HB is at work in M3 and is more effective in the central region of the cluster. The problem is surely worthy of further investigation since anomalous radial behaviour has been seen before in other stellar populations in this cluster (see the case of the blue straggler radial distribution discussed in Ferraro et al. 1993 and Ferraro et al. 1997b).
2.2 HB Morphology of Palomar 3
The dereddened , Pal 3 CMD, based on HST-WFPC2 data kindly provided to us by Dr. P. B. Stetson, is shown in Figs. 6a,b. RR Lyrae variables are indicated by circled dots. The adopted reddening comes from the Schlegel, Finkbeiner, & Davis (1998) dust maps, which give mag at the position of Pal 3, and the assumption that (see Stetson et al. 1999 and references therein). The adopted reddening is in excellent agreement with the value tabulated by Harris (1996) in the June 1999 update of his catalog, mag—an estimate which is completely independent of the Schlegel et al. maps. For reference purposes, a vertical dotted line representing the mean dereddened color of the combined HBs of Pal 4 and Eridanus [ mag; see Catelan 2000] is overplotted on the Pal 3 CMD of Figs. 6a,b. In Fig. 6b, the zero-age HB for is overplotted on the data, as is an evolutionary track for a star, after appropriately applying a shift in by 19.67 mag.
Mean colors and magnitudes for the Pal 3 RR Lyrae variables were obtained by constructing their light curves. This was achieved by matching the Borissova et al. (1998) and Stetson et al. (1999) photometries, which allowed light curve types, pulsation periods and mean properties to be evaluated (J. Borissova 2000, priv. comm.). While these cannot yet be considered the definitive light curves for the Pal 3 variables, they certainly represent a substantial improvement in comparison with Stetson et al., where only a global “mean” color/magnitude was provided for the cluster variables. Importantly, it seems particularly clear that: i) All of the Pal 3 RR Lyrae variables pulsate in the fundamental (ab) mode; ii) All of the Pal 3 RR Lyrae variables are redder than mag: this is the blue limit for RRab pulsation in M3, the prototypical Oosterhoff type I cluster (Bakos & Jurcsik 2000; Corwin & Carney 2001). Note that RRab’s are even redder in Oosterhoff type II globulars (e.g., Bono, Caputo, & Marconi 1995).
From Figs. 6a,b, it is immediately obvious that the HB of Pal 3 is much bluer than the HBs of Pal 4 and Eridanus (whose mean combined color is indicated, in these plots, by a vertical dotted line, from Catelan 2000). However, blue-HB stars appear to be entirely absent from all these outer-halo globulars. Pal 3 appears to be just slightly more metal-poor than Pal 4 and Eridanus (see Stetson et al. 1999 for a detailed discussion). The small metallicity difference between Pal 3 and Pal 4/Eridanus suggests that metallicity differences alone cannot explain the difference in HB color between these clusters as seen in Figs. 6a,b. As a matter of fact, Burbidge & Sandage (1958), in their analysis of Pal 3 and Pal 4 (which they call the “10h” and the “11h” clusters in their paper, respectively) had already pointed out that the Pal 3 CMD is “more normal” than that of Pal 4 “because the HB extends to bluer colors.” In spite of that remark, and the existence of several RR Lyrae variables in the cluster (unlike in Pal 4 and Eridanus) notwithstanding, Pal 3 has usually been considered as good an example of a “second-parameter” cluster as any of the other red-HB globulars in the outer halo. Our qualitative analysis of the CMD presented in Fig. 6 suggests, in line with Burbidge & Sandage, that Pal 3 is a much less extreme second-parameter cluster than Pal 4 and Eridanus. As we shall see below, a detailed quantitative analysis confirms that this is indeed the case.
![[Uncaptioned image]](/html/astro-ph/0106554/assets/x6.png)
As already pointed out, the RR Lyrae population of Pal 3 has not been extensively investigated to date. However, the currently known RR Lyrae variables in the cluster all appear to be of the ab-type—i.e., fundamental pulsators (Borissova et al. 1998; Borissova 2000, priv. comm.; Stetson et al. 1999 and references therein). RRab Lyrae variables are well known to be redder than RRc variables, implying that the HB of Pal 3, which lacks either blue HB or RRc stars, has a narrow dispersion in color. Note that this argument independs on the reliability of the individual RR Lyrae colors. The mean color of the Pal 3 HB stars, variable and non-variable, appears to coincide with the red edge of the instability strip, at mag (see Figs. 6a,b). We shall argue, in the next section, that the three fairly bright stars at the red extension of the HB, at mag, are red HB stars on their way to the asymptotic giant branch (AGB), even though the average expected number of such evolved stars is . Taking this into consideration in the number counts, we conclude that the most representative number ratios and mean color describing the HB morphology of Pal 3 are and mag, respectively.
Gratton & Ortolani (1984) suggest that “one or two stars may be present on the blue side of the RR Lyrae strip” of Pal 3. Even though these two stars are very likely cluster members (K. Cudworth 2000, priv. comm.), independent photometry by K. Cudworth and by S. Ortolani (2000, priv. comm.) shows that they are both variable stars (at least one of which almost certainly being an RR Lyrae variable), and not blue-HB stars as had originally been suggested. In fact, Ortolani has imaged a Pal 3 field of about using the ESO-NTT in 1993, not finding any blue HB star in the cluster. Ortolani points out that Pal 3, in his images, seems to have a diameter much smaller than his observed field—namely, no more than . Independently, Borissova (2000, priv. comm.) has reduced and images taken with the Rozhen telescope and covering a field of centered on the Pal 3 center. The limiting magnitude, in her study, is 23 mag in (compare with Fig. 6). Her analysis of 25 images taken in and 20 images taken in also confirms that Pal 3 contains no blue HB stars. Given that the Pal 3 half-light radius is only (Harris 1996), the conclusion that Pal 3 does entirely lack blue HB stars seems inescapable. Hence the absence of blue HB stars in the HST CMD of Figs. 6a,b is not an artifact of the relatively small field of view of WFPC2 (compared to the ground-based ones).
Of course, it would obviously be desirable to have a larger sample of HB stars. Note however that even photometry covering the entire cluster out to its tidal radius is not likely to yield a large sample. Pal 3’s tidal radius is (Harris 1996); a simple integration assuming a King profile suggests that the number of HB stars in the range not covered by the Borissova (2000, priv. comm.) or Ortolani (2000, priv. comm.) photometries mentioned in the previous paragraph—i.e., in between about and —is very small, of order a few percent of the total inside only, or less than one HB star. On the other hand, it is possible to estimate the “total” number of Pal 3 HB stars from Eq. (14) in Renzini & Buzzoni (1986), which gives the expected number of stars in any given post-main sequence stage as a function of the duration of that stage and of the total luminosity of the sampled population. Adopting a lifetime of yr for the HB, and a total integrated magnitude mag for Pal 3 (from Harris 1996), we find that . This number seems surprisingly large in comparison with the number of HB stars detected in the cluster so far. We have no explanation at present for this discrepancy, but believe that it is highly unlikely that the answer will be found in the form of blue HB stars outside the currently observed cluster regions.
3 Theoretical Framework
In this section, our goal is to determine the mean HB mass and HB mass dispersion parameters (, ) in the simulations that best account for the observed characteristics of the M3 (§3.1) and Pal 3 (§3.2) CMDs in the HB region.
The basic theoretical framework adopted (HB and RGB evolutionary tracks, color transformations) is the same as in Catelan (2000 and references therein), and need not be repeated here; we refer the interested reader to that paper for further information. Our employed HB synthesis code, sintdelphi, is the latest version of the Catelan et al. (1998 and references therein) code, which includes several numerical improvements and has now been translated to delphi.
Our most important working hypothesis is that age is the second parameter of HB morphology. We also assume, in line with previous authors, that M3 and Pal 3 represent a “bona fide” second-parameter pair, thus adopting the same metallicity for the two clusters—which appears to be supported by the available data (see Stetson et al. 1999 and references therein). In particular, Armandroff, Da Costa, & Zinn (1992) have measured a metal abundance for Pal 3 using the Caii triplet method, and found dex on the Zinn & West (1984) scale. This value is to be compared with for M3, as provided by Harris (1996), on the same scale. It should be noted that the implied identity between the Pal 3 and M3 metal content will eventually have to be placed on a firmer footing with the use of high-dispersion spectroscopy; in particular, a much smaller error bar than provided for Pal 3 in the Armandroff et al. study will be needed to verify the assumption that Pal 3 and M3 have indeed the same metallicity.
Again as in Catelan (2000), we assume that the underlying zero-age HB mass distributions can be characterized by Gaussian deviates (see Catelan et al. 1998 for a detailed discussion).
3.1 The Case of M3
Extensive grids of synthetic HBs have been computed aiming at estimating the optimum parameters (mean mass) and (mass dispersion) required to reproduce the observed HB morphology of M3 at both its bluest and reddest extremes (see §2.1).
Random “observational scatter” has also been included, according to the following exponential “laws” that were fitted to the observational data:
We find that these formulae reproduce the errors in the photometry over the whole range of magnitudes more accurately than do similar ones adopting Robertson (1974) profiles.
The width of the theoretical instability strip was assumed to be , which leads to a very good agreement with the empirical blue and red edges of the M3 RR Lyrae strip as reported by Sandage (1990), Bakos & Jurcsik (2000), and Corwin & Carney (2001). Moreover, the adopted width also leads to a nice agreement between the model predictions and the observed red edge of the instability strip in the case of Pal 3, which is particularly important for our present purposes (see below).
We have computed series of 1000 synthetic HBs assuming an overall number of HB stars and 103 for the “blue” and “red” HB cases, respectively. These numbers correspond to the actual number counts in the inner and outer regions of the cluster, respectively (see Table 1), and were allowed to fluctuate following the Poisson distribution.
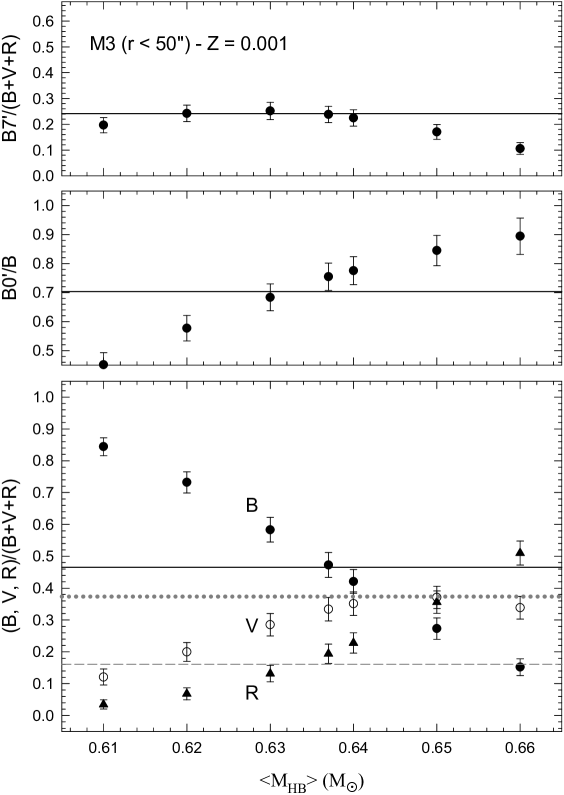
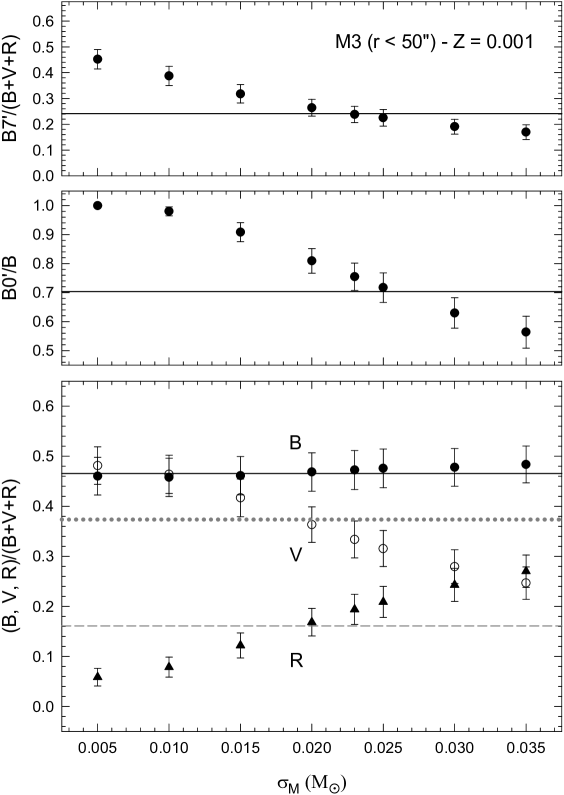
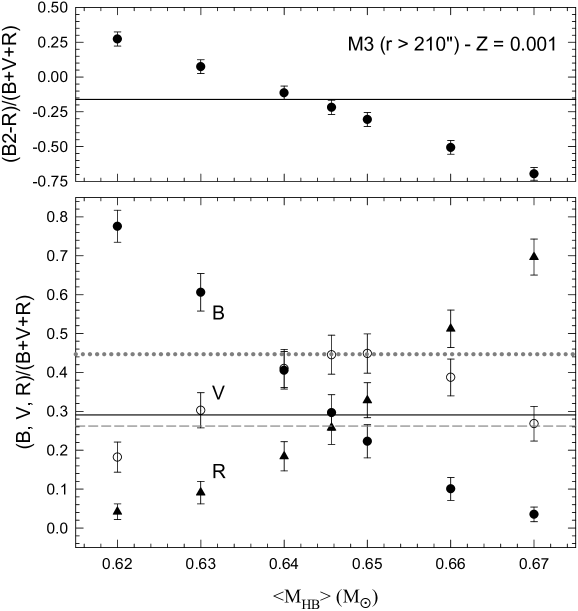
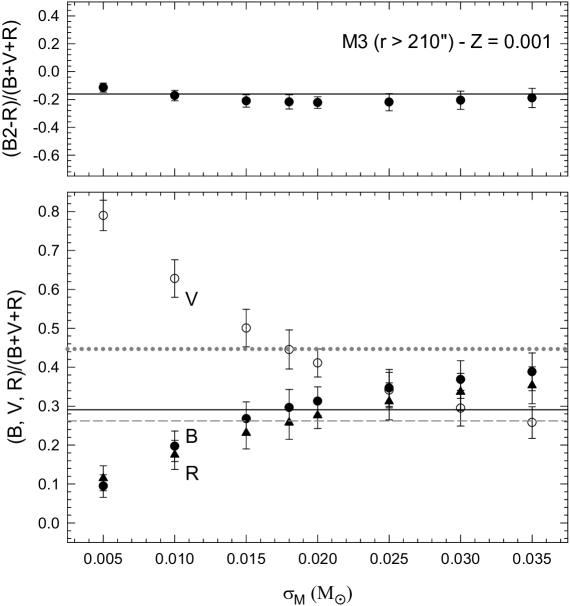
The number ratios provided in Table 1, as well as the dispersion in color in the observed HBs, allowed us to iteratively fine-tune the model simulation parameters (, ) until the best combinations were obtained. Figures 2 and 3 illustrate the dependence of the employed HB morphology parameters on the mean HB mass and HB mass dispersion, respectively, for the inner regions of the cluster. Figures 4 and 5 are analogous and refer to the outer regions of M3. Such figures were also used to obtain approximate estimates of the corresponding errors in the best-fitting values. We found that the following provides the best match to the observed HB morphology of M3 in its inner regions:
whereas, for the outer regions, the best match is found for:
Such combinations lead, in the mean, to the HB morphology parameters displayed in Table 2 (where the numbers in parentheses represent the standard deviation of the mean over the corresponding set of 1000 simulations). Note the nice agreement between the observed (Table 1) and theoretical (Table 2) number counts. We also emphasize the agreement between observed and simulated values of the Mironov (1972) parameter—which, unlike the Lee-Zinn parameter, is immune to possible extant uncertainties in the RR Lyrae number counts in the innermost regions of M3 observed only with HST. Note also that the best-fitting mass dispersion appears to be slightly larger in the inner than in the outer regions of M3, although it will immediately be recognized that this result does not bear great statistical significance.
Four simulations were randomly drawn from the two sets of 1000 simulations whose mean HB morphology parameters best reproduce the observed M3 ones over the two radial regions considered. The corresponding synthetic CMDs are plotted in Figs. 1c,e [, plane] and Figs. 1d,f [, plane] for the inner and outer regions, respectively. For each simulation, the total number of HB stars, as well as the relative fractions , are indicated. The simulations do not include the AGB phase.
Our simulations allow us to address the question whether the difference between the “inner cluster” and the “outer cluster” HB populations is significant or not. We have proceeded as follows. For the set of simulations which best reproduces, in the mean, the observed number counts in the inner regions of M3, we have selected those for which (i.e., more RR Lyrae variables than blue-HB stars)—a characteristic of the outer regions of M3. We find that only about of the “inner cluster” synthetic HBs have “outer cluster” characteristics, with more RR Lyrae variables than blue-HB stars. Likewise, about of the “outer cluster” simulations have “inner cluster” characteristics, in the sense that they show . Moreover, since the number of RR Lyrae and (especially) red HB stars are essentially the same for the inner and outer samples (cf. Table 1 and Figs. 1a,b), the difference arises mainly from the number of blue HB stars. If the two populations are indeed the same our best estimate of the number of blue HB stars in each sample is 55.5. If only Poisson statistics were acting the observed inner sample is a 3.5– deviation upward occuring simultaneously with a 3.5– deviation downward in the outer sample. Other scenarios are similarly improbable on a purely statistical basis. Hence the difference in HB morphology between the inner and outermost regions of M3 is clearly of very high statistical significance.
3.2 The Case of Pal 3
The HB of Pal 3 that we set out to simulate theoretically, from the HST observations of Stetson et al. (1999), completely lacks blue HB stars (see Figs. 6a,b). Inspection of Figs. 6a,b clearly shows that the bulk of the HB stars cluster around the red edge of the instability strip, which is located at a color mag. With the exception of the three bright, likely evolved stars at mag, the dispersion in color among the HB stars appears to be surprisingly small, especially given the strong sensitivity of temperature to mass variations at these intermediate colors (e.g., Sweigart, Renzini, & Tornambè 1987). This is confirmed by the fact that all known or suspected RR Lyrae variables in the cluster are fundamental (i.e., ab-type) pulsators (Borissova et al. 1998; Stetson et al. 1999; Borissova 2000, priv. comm.).
The adopted procedure in the synthetic computations is entirely analogous to the one already described in the case of M3. “Observational scatter” has been randomly included following exponential “laws” that were fitted to the HST data. The best-fitting error formulae are as follows:
In these simulations, the number of HB stars was allowed to fluctuate around the observed number, , following the Poisson distribution.
As a result, we find that the following parameters lead, in the mean, to the best overall match between the observed and simulated Pal 3 HBs:
The mean number ratios and color for this set of simulations is given in Table 3. A sample of six simulations, drawn randomly from the pool of 1000 models, is displayed in Figs. 6c–h. Comparison between Figs. 6a,b and Figs. 6c–h confirms the good agreement between the simulations and the observed CMD. Note, in particular, that the mean computed color is in excellent agreement with the one based on the HST data (§2.2). The only aspect of the observed CMD which may perhaps be argued not to be well matched by the simulations is the slope of the HB. However, much of the sloping nature of the Pal 3 HB is due to a single red HB star, at around mag, that appears to be significantly fainter than the remaining red HB stars; this is certainly not expected on the basis of our simulations (see also VandenBerg 2000). The comparison between the models and the observations carried out in Fig. 6b suggests that, with the exception of this intriguingly faint star, there is no obvious discrepancy between the evolutionary models and the observations.
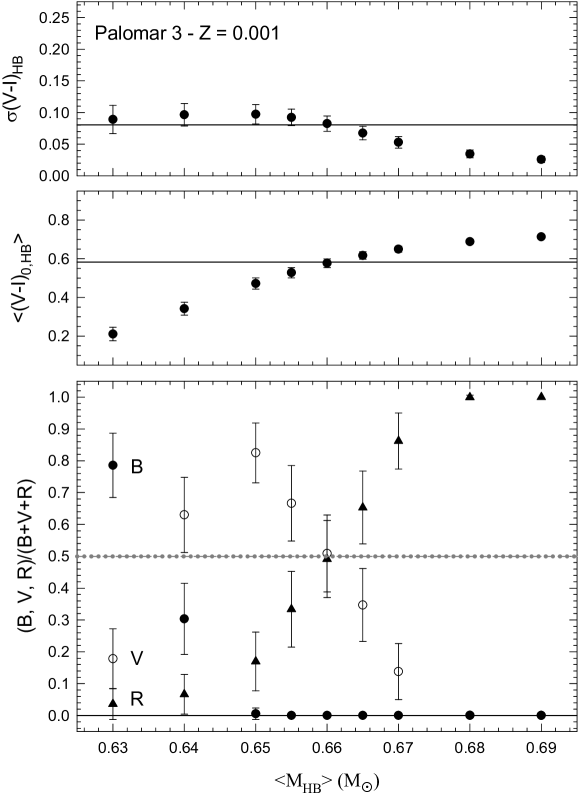
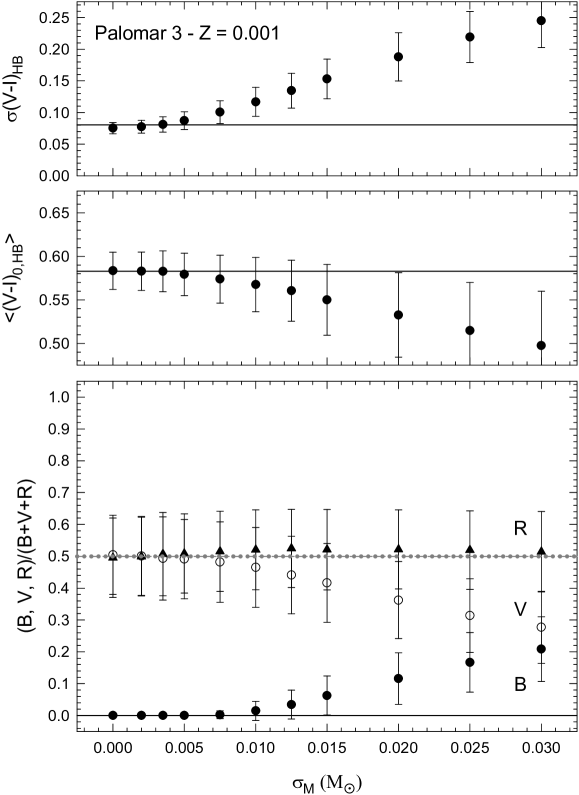
Figures 7 and 8 show the run of several HB morphology parameters for Pal 3 as a function of the adopted and , respectively. It will be noted that, whereas the HB number counts do play an important role when choosing the best-fitting value (Fig. 7, bottom panel), the mean HB color, , is (not unexpectedly) another extremely important quantity constraining the solution. On the other hand, Fig. 8 shows that the traditionally employed number counts , , do not pose useful constraints on , and neither does the mean HB color; in order to estimate the best-fitting value, the standard deviation in the HB color, , is clearly the most important quantity (Fig. 8, upper panel). It is important to note, at this point, that in order to maximize the sensitivity of to the HB mass dispersion, evolved stars were avoided both in the models and in the observations. In the latter case, the three evolved Pal 3 HB stars were not included when computing ; in the former, we have decided to simply exclude from the computations any star approaching helium exhaustion in the core, or (equivalently) the final of HB evolution. For these reasons, it is not surprising that provides a very good diagnostic of mass dispersion on the zero-age HB.
The displayed models also shed light on the nature of the three red and bright stars lying to the red of the “main” Pal 3 HB distribution. For instance, one of the displayed simulations, labeled #942 (Fig. 6c), shows two bright and red HB stars, bearing great resemblance to the observed distribution. These stars are approaching their final stages of HB evolution, on their way up to the AGB. As shown in the figure, the existence of such bright and red HB stars is not unexpected from our models (see also Catelan 2000), although we find that the typical number to be expected in a sample the size of Pal 3’s (16 HB stars) is . This is due to the relatively short duration of the final stages of HB evolution close to core helium exhaustion. Though suggestive, the three observed bright and red HB stars in Pal 3 cannot be considered a serious discrepancy between theory and observations in their own right.
One particularly interesting result of our model computations is the extremely small value of that we have obtained for Pal 3. Such a small mass dispersion is largely a consequence of: i) The lack of blue HB stars in the cluster; ii) The lack of first-overtone RR Lyrae variables (RRc’s). One may, however, question the statistical significance of this result, given that the Pal 3 field that we are modelling has a mere 16 HB stars. For this reason, we have computed a new set of simulations for Pal 3 with the same value of as derived above, but changing the mass dispersion to a value that appears more appropriate for M3, namely: (see §3.1).
A random sample of six simulations drawn from the so computed pool of 1000 models is displayed in Fig. 9. It is readily apparent that the typical Pal 3 simulation with an M3-like mass dispersion on the HB shows an HB distribution which does not provide a good match to the Pal 3 CMD. In particular, we find that only of these simulations entirely lack blue-HB stars, as in the HST CMD. Even in these cases, however, good morphological agreement with the observed Pal 3 CMD is generally not obtained. To illustrate this, a random sample of six simulations drawn from the (already small) subset of simulations with is shown in Figs. 10c–h. None of the examples shown has a narrow HB color dispersion resembling the observed one (compare with Figs. 10a,b), and RRc stars are often present in these simulations (as indicated by the instability strip being populated to bluer colors than in Figs. 6c–h, where very few RRc’s are present). As a matter of fact, the bluest of the stars plotted in Figs. 10a,b has a color mag, whereas all of the simulations displayed in Figs. 10c–h contain stars bluer than mag. From the entire pool of simulations for this M3-like mass dispersion case, we indeed find that as many as contain one or more stars bluer than mag; this percentage increases to if one considers mag as the “cutoff color” on the blue side. We conclude that the small HB mass dispersion that we found for Pal 3 is most likely an intrinsic characteristic of Pal 3, and not a chance result due to statistical fluctuations. This conclusion is also strongly supported by the upper panel of Fig. 8, which clearly shows not only that the HB mass dispersion of Pal 3 is smaller than —but also that it is, perhaps somewhat surprisingly, entirely consistent with zero. Such a small mass dispersion for the Pal 3 HB is due to the fact that the HB evolutionary tracks, at the Pal 3 mean color, already encompass a significant range in color at this metallicity. This is clearly demonstrated by Fig. 6b, which shows an evolutionary track from Catelan et al. (1998) for an HB star with a mass very similar to Pal 3’s best-fitting overplotted on the observed CMD.
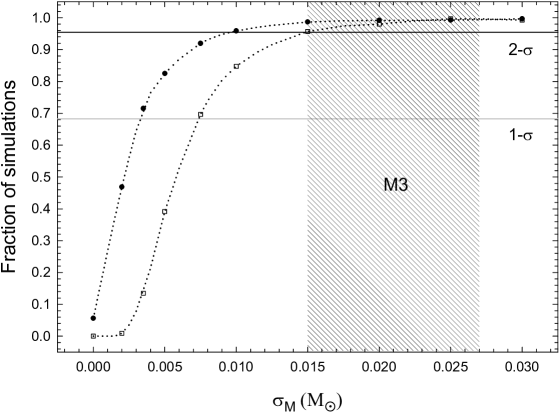
To put these results on a firmer statistical basis, we have computed many additional sets of simulations in which the mean HB mass was held fixed at the “optimum” value for Pal 3, namely , but allowing the mass dispersion to vary between (“single HB evolutionary track case”) and . For each value, Monte Carlo simulations with 16 HB stars in each (as observed), plus Poisson noise, were computed, and the number of those simulations showing one or more HB star bluer than the “cutoff colors” mag and mag obtained. The results of these simulations are summarized in Fig. 11, where the percentage of simulations containing one or more star bluer than the indicated cutoffs is plotted as a function of the mass dispersion . The range of mass dispersion values found for M3 (from §3.1) is also schematically indicated; note that these may be underestimates, in case any of the rejected “ER” and “EB” stars (§2.1), particularly the latter, turn out to be “bona fide” HB stars.
Figure 11 clearly confirms that the lack of bluer HB stars in the Pal 3 HST-WFPC2 CMD implies that the HB mass dispersion in this cluster is smaller than M3’s at the – level. This is true even when the cutoff color is placed at mag, which is 0.06 mag bluer than the reddest point on the HST-WFPC2 CMD. The choice of such a significantly bluer cutoff color was motivated by the fact that, in spite of recent efforts, the Pal 3 RR Lyrae light curves are still not very well determined, so that their individual colors remain somewhat uncertain. However, we again emphasize that all RR Lyrae stars found to date in Pal 3 appear to be fundamental pulsators. From Fig. 2 in Bakos & Jurcsik (2000) and from Corwin & Carney (2001) it is clear, in turn, that all RRab stars in M3 (a prototypical Oosterhoff type I cluster) are redder than mag; RRab’s are even redder in Oosterhoff type II globulars (e.g., Bono et al. 1995).
In conclusion, it appears clear that the mass dispersion on the Pal 3 HB is very small, being not only intrinsically smaller than M3’s but also indistinguishable from zero.
![[Uncaptioned image]](/html/astro-ph/0106554/assets/x10.png)
![[Uncaptioned image]](/html/astro-ph/0106554/assets/x11.png)
4 Estimating Relative Ages from Differences in the HB Morphology
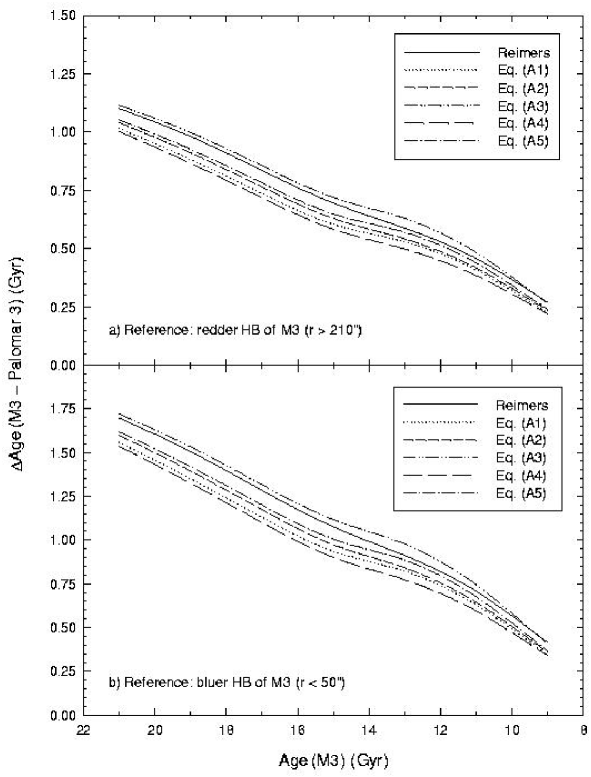
In order to estimate the relative ages required to produce the relative HB types of M3 and Pal 3, we follow the same approach described in Catelan (2000) in the case of M5 and Pal 4/Eridanus. As in that paper, we shall evaluate the effects of an age-dependent mass loss on the RGB, as implied by the several different analytical formulae discussed in Catelan’s Appendix. As argued by Catelan, at the present time it does not appear possible to strongly argue in favor of any of his recalibrated equations over the others, so that a safer approach is to use all of them simultaneously whenever an estimate of the amount of mass loss on the RGB is needed. We briefly recall here that equations (A1) through (A4) of Catelan are “generalized,” empirically recalibrated variations of the analytical mass loss formulae previously suggested by Reimers (1975a, 1975b), Mullan (1978), Goldberg (1979), and Judge & Stencel (1991), respectively. In this paper, RGB mass loss was estimated on the basis of the RGB models of VandenBerg et al. (2000) for a chemical composition , .
We follow the same approach described in Catelan (2000) to measure the age difference between the two clusters, as required from their HB morphologies under the assumption that age is the second parameter. Given the variation in HB morphology as a function of radial position in the case of M3, we are forced to study the M3 inner regions (bluer HB) and outer regions (redder HB) as limiting cases for deriving the HB morphology-based age difference between M3 and Pal 3; we assume that the most appropriate age difference estimate will lie somewhere in between these limits. In particular, the “integrated” HB morphology of M3 can be characterized by the number ratios , which would correspond to a synthetic HB falling in between the two limiting cases considered above (compare with Tables 2 and 3).
For each of the Catelan (2000) mass loss formulae, and also for Reimers’ (1975a, 1975b) formula, the resulting values and “HB morphology ages” for M3 and Pal 3 are given in Table 4 (“red HB” case for M3) and Table 5 (“blue HB” case for M3). These results are also shown in Fig. 12, where one can find our theoretical age difference vs. absolute age curves for each mass loss formula (see labels) both in the “red HB” and “blue HB” limits for M3 (upper panel and lower panel, respectively).
VandenBerg (2000), on the basis of deep WFPC2 photometry for Pal 3, has recently found a turnoff (TO) age “of Gyr for Pal 3, which is to be compared with Gyr for M3” (see his §2.4.2)—implying a favored age difference for the M3–Pal 3 pair of Gyr. Comparing such a TO age difference with the HB morphology-based results displayed in Fig. 12, we find that the relative TO ages favored by VandenBerg are largely consistent with the relative HB types of the M3 and Pal 3 HBs.
On the other hand, Stetson et al. (1999) state that “the [deep WFPC2] data are consistent with an age difference of some 2 Gyr between M3 and Pal 3 (Pal 3 younger) if their abundances are the same.” Fig. 12 clearly shows that such a larger TO age difference is not favored by the present models under the same assumption as adopted by Stetson et al., namely: identical abundances. Age differences for this pair in the 2 Gyr range might still be reconciled with the HB morphologies of the studied clusters, provided other “second parameters” vary in such a way as to “compensate” the effects of such relatively large age differences upon the predicted HB morphologies. The -element abundance is one such plausible candidate; indeed, [/Fe] has been observed to be lower in the “young,” loose GCs Pal 12 and Ruprecht 106 (Brown, Wallerstein, & Zucker 1997) than in the vast majority of Galactic GCs (Carney 1996 and references therein). However, a lower [/Fe] for Pal 3 would drive a bluer HB type for the cluster, thus decreasing even further the (already small) age difference needed to account for the difference in HB morphology between M3 and Pal 3. Hence a lower [/Fe] for Pal 3 would work in the opposite sense, from the standpoint of HB models, to what would be needed to produce agreement between the present results and a TO age difference of about 2 Gyr.
Of course, it may also be that future observations will reveal that the [Fe/H] values of Pal 3 and M3 differ, thus removing these clusters from the “bona fide second parameter pair” category which they currently seem to occupy. Empirically, one can see, from an HB morphology–metallicity diagram such as the one presented in Fig. 1 of Catelan & de Freitas Pacheco (1993), that an increase in [Fe/H] by 0.2 dex (i.e., within the Armandroff et al. 1992 derived uncertainty) could move the Pal 3 HB to the red, compared to that of M3, by approximately the right amount, even if no age difference is present. (We have, of course, ignored, for the sake of argument, both the internal second parameter in M3 and the intrinsically narrower mass distribution of Pal 3.) Conversely, it is conceivable that, if Pal 3 turns out to be more metal-poor than M3 by 0.2 dex, a larger TO age difference with respect to this cluster will be required in order to reproduce its red HB. Unfortunately, our imperfect (at best) knowledge of the variation of RGB mass loss with metallicity prevents us from carrying out a more meaningful analysis of the effects of metallicity variations upon the HB morphology of Pal 3; again, the importance of improving our knowledge of mass loss in first-ascent giants cannot be overemphasized.
5 Conclusions and Discussion
In the present paper, we have carried out a detailed analysis of the “second-parameter pair” of globular clusters M3 and Palomar 3, based both on observational data and theoretical models. We have shown that the HB morphology of M3 is significantly bluer in its inner regions (observed with HST) than in the cluster outskirts (observed from the ground), and have presented Monte Carlo simulations which support the view that this difference in HB type is unlikely to be due to statistical fluctuations. This result leads to the conclusion that some “local” second parameter(s) is acting between the inner and outer parts of M3.
Our Monte Carlo simulations also suggest that the dispersion in mass of the Pal 3 HB is very small (consistent with zero), which is unlikely to be due to a statistical fluctuation in spite of the small sample size in the cluster CMD. In this regard, the difference in HB mass dispersion between M3 and Pal 3 is clearly found to be statistically significant.
Ignoring the internal second parameter in M3 and the narrow mass distribution in Pal 3, we can do a traditional analysis searching for a global second parameter acting between the two clusters. For example, we can search for an age difference based on the mean color or HB mass of each cluster. In this case, under the assumption that the two clusters have the same metallicity, the relative HB types of M3 and Pal 3 can easily be accounted for by a fairly small difference in age between them, of order 0.5–1 Gyr—which is in good agreement with the relative age measurement, based on the clusters’ turnoffs, recently presented by VandenBerg (2000). Hence age could be the primary “global” second parameter for the pair M3–Pal 3.
Even though there may be a small age difference between M3 and Pal 3 (Stetson et al. 1999; VandenBerg 2000), the dramatically different HB morphologies obvious from a cursory examination of the CMDs appears to arise from another factor—the small mass dispersion of the Pal 3 HB. For some reason the star-to-star differences that lead to in most GCs do not seem to occur in Pal 3. What possible mass loss-driving stellar parameter could have such a behavior?
M3’s internal second parameter adds additional complexity to the problem of identifying a global second parameter acting between M3 and any other cluster. It is unlikely that age is the internal second parameter because over the Gyr age of the cluster dynamical mixing should have eliminated any initial radial separation of two age groups. On the other hand dynamical separation of stars which have undergone differential mass loss is unlikely to occur on a time scale comparable to or less than the HB lifetime. Even if it did, the settling of the more massive red HB stars to the center would produce a result opposite that observed. The most plausible internal second parameter is that some environmental factor leads to enhanced mass loss for the inner stars. One can at least imagine that stellar encounters could affect rotation rates which could in turn affect mass loss. If this is the case other clusters with HBs similar to M3, e.g., M5, might show an internal second parameter; it would be interesting to investigate this possibility further using a combination of HST and ground-based photometry (as done in this paper for M3). Perhaps the density of the stellar medium, at least in this case and in Pal 3’s, will turn out to be the culprit, provided it can be shown that RGB mass loss and the density of stars in globular clusters are somehow related (with higher density leading to an increase in the overall amount of mass loss on the RGB and in the dispersion around the mean value). At least in the case of M3, another intriguing possibility is that the detected radial variation in HB morphology is somehow related to the peculiar radial variations observed in the blue stragglers populations in the same cluster (Ferraro et al. 1997b). Again we find ourselves in the position where a detailed analysis of a second parameter pair does not lead to a simple answer.
References
- (1)
- (2) Armandroff, T. E., Da Costa, G. E., & Zinn, R. 1992, AJ, 104, 164
- (3)
- (4) Bailyn, C. D., Iben, I., Jr. 1989, ApJ, 347, L21
- (5)
- (6) Bakos, G. A., & Jurcsik, J. 2000, in ASP Conf. Ser. Vol. 203, The Impact of Large-Scale Surveys on Pulsating Star Research, ed. L. Szabados & D. W. Kurtz (San Francisco: ASP), 255
- (7)
- (8) Bolte, M., & Hogan, C. J. 1995, Nature, 376, 399
- (9)
- (10) Bono, G., Caputo, F., & Marconi, M. 1995, AJ, 110, 2365
- (11)
- (12) Borissova, J., Catelan, M., Spassova, N., & Sweigart, A. V. 1997, AJ, 113, 692
- (13)
- (14) Borissova, J., Spassova, N., Catelan, M., & Ivanov, V. D. 1998, in ASP Conf. Ser. Vol. 135, A Half-Century of Stellar Pulsation Interpretations, ed. P. A. Bradley & J. A. Guzik (San Francisco: ASP), 188
- (15)
- (16) Buonanno, R. 1993, in ASP Conf. Ser. Vol. 48, The Globular Cluster-Galaxy Connection, ed. G. H. Smith & J. P. Brodie (San Francisco: ASP), 131
- (17)
- (18) Buonanno, R., Corsi, C. E., Buzzoni, A., Cacciari, C., Ferraro, F. R., & Fusi Pecci, F. 1994, A&A, 290, 69
- (19)
- (20) Brown, J. A., Wallerstein, G., & Zucker, D. 1997, AJ, 114, 180
- (21)
- (22) Burbidge, E. M., & Sandage, A. 1958, ApJ, 127, 527
- (23)
- (24) Carney, B. W. 1996, PASP, 108, 900
- (25)
- (26) Carretta, E., Cacciari, C., Ferraro, F. R., Fusi Pecci, F., Tessicini, G. 1998, MNRAS, 298, 1005
- (27)
- (28) Catelan, M. 2000, ApJ, 531, 826
- (29)
- (30) Catelan, M., Bellazzini, M., Landsman, W. B., Ferraro, F. R., Fusi Pecci, F., & Galleti, S. 2001, AJ, submitted
- (31)
- (32) Catelan, M., Borissova, J., Sweigart, A. V., & Spassova, N. 1998, ApJ, 494, 265
- (33)
- (34) Catelan, M., & de Freitas Pacheco, J. A. 1993, AJ, 106, 1858
- (35)
- (36) Corwin, T. M., & Carney, B. W. 2001, preprint
- (37)
- (38) Ferraro, F. R., Fusi Pecci, F., Cacciari, C., Corsi, C. E., Buonanno, R., Fahlman, G. G., & Richer, H. B. 1993, AJ, 106, 2324
- (39)
- (40) Ferraro, F. R., Carretta, E., Corsi, C. E., Fusi Pecci, F., Cacciari, C., Buonanno, R., Paltrinieri, B., & Hamilton, D. 1997a, A&A, 320, 757
- (41)
- (42) Ferraro, F. R., et al. 1997b, A&A, 324, 915
- (43)
- (44) Fusi Pecci, F., & Bellazzini, M. 1997, in The Third Conference on Faint Blue Stars, ed. A. G. Davis Philip, J. W. Liebert, & R. A. Saffer (Schenectady: L. Davis Press), 255
- (45)
- (46) Fusi Pecci, F., Bellazzini, M., Cacciari, C., & Ferraro, F. R. 1995, AJ, 110, 1664
- (47)
- (48) Fusi Pecci, F., Ferraro, F. R., Bellazzini, M., Djorgovski, S., Piotto, G., & Buonanno, R. 1993, AJ, 105, 1145
- (49)
- (50) Goldberg, L. 1979, QJRAS, 20, 361
- (51)
- (52) Gratton, R. G., & Ortolani, S. 1984, A&AS, 57, 177
- (53)
- (54) Grebel, E. K. 2001, in ASP Conf. Ser., Microlensing 2000: A New Era of Microlensing Astrophysics, eds. J. W. Menzies & P. D. Sackett, in press (astro-ph/0008249)
- (55)
- (56) Harris, W. E. 1996, AJ, 112, 1487 (June 22nd, 1999 version)
- (57)
- (58) Harris, W. E., et al. 1997, AJ, 114, 1030
- (59)
- (60) Judge, P. G., & Stencel, R. E. 1991, ApJ, 371, 357
- (61)
- (62) Lee, Y.-W., Demarque, P., & Zinn, R. 1994, ApJ, 423, 248
- (63)
- (64) Majewski, S. R. 1994, ApJ, 431, L17
- (65)
- (66) Mironov, A. V. 1972, AZh, 49, 134
- (67)
- (68) Mironov, A. V., & Samus, N. N. 1974, Peremennye Zvëzdy, 19, 337
- (69)
- (70) Mullan, D. J. 1978, ApJ, 226, 151
- (71)
- (72) Ortolani, S., & Gratton, R. G. 1989, A&AS, 79, 155
- (73)
- (74) Reimers, D. 1975a, in Problems in Stellar Atmospheres and Envelopes, ed. B. Baschek, W. H. Kegel, & G. Traving (Berlin: Springer-Verlag), 229
- (75)
- (76) Reimers, D. 1975b, in Problèmes D’Hydrodynamique Stellaire, Mémoires de la Societé Royale des Sciences de Liége, 6e serie, tome VIII, 369
- (77)
- (78) Renzini, A., & Buzzoni, A. 1986, in Spectral Evolution of Galaxies, ed. C. Chiosi & A. Renzini (Dordrecht: Reidel), 195
- (79)
- (80) Richer, H. B., et al. 1996, ApJ, 463, 602
- (81)
- (82) Robertson, J. W. 1974, ApJ, 191, 67
- (83)
- (84) Rood, R. T., et al. 1999, ApJ, 523, 752
- (85)
- (86) Sandage, A. 1990, ApJ, 350, 603
- (87)
- (88) Sarajedini, A., Chaboyer, B., & Demarque, P. 1997, PASP, 109, 1321
- (89)
- (90) Sarajedini, A., Geisler, D., Harding, P., & Schommer, R. 1998, ApJ, 508, L37
- (91)
- (92) Schlegel, D. J., Finkbeiner, D. P., & Davis, M. 1998, ApJ, 500, 525
- (93)
- (94) Searle, L., & Zinn, R. 1978, ApJ, 225, 357
- (95)
- (96) Stetson, P. B., et al. 1999, AJ, 117, 247
- (97)
- (98) Stetson, P. B., VandenBerg, D. A., & Bolte, M. 1996, PASP, 108, 560
- (99)
- (100) Sweigart, A. V., Renzini, A., & Tornambè, A. 1987, ApJ, 312, 762
- (101)
- (102) van den Bergh, S. 1993, ApJ, 411, 178
- (103)
- (104) van den Bergh, S. 1999, A&A Rev., 9, 273
- (105)
- (106) van den Bergh, S. 2000, PASP, 112, 932
- (107)
- (108) VandenBerg, D. A. 2000, ApJS, 129, 315
- (109)
- (110) VandenBerg, D. A., Swenson, F. J., Rogers, F. J., Iglesias, C. A., & Alexander, D. R. 2000, ApJ, 532, 430
- (111)
- (112) Zinn, R. 1986, in Stellar Populations, ed. C. A. Norman, A. Renzini, & M. Tosi (Cambridge: CUP), 73
- (113)
- (114) Zinn, R. 1993, in ASP Conf. Ser. Vol. 48, The Globular Cluster–Galaxy Connection, ed. G. A. Smith & J. P. Brodie (San Francisco: ASP), 38
- (115)
- (116) Zinn, R., & West, M. J. 1984, ApJS, 55, 45
- (117)