Long-Slit Observations of Extended C II 1335 Emission Around V854 Centauri and RY Sagittarii1
Abstract
We have obtained long-slit far-ultraviolet (1150–1730 Å) spectra of the R Coronae Borealis (RCB) stars V854 Cen and RY Sgr, near maximum light and pulsational phase zero, with the Space Telescope Imaging Spectrograph (STIS) on Hubble Space Telescope (HST). The far-UV spectrum of each star shows a photospheric continuum rising steeply toward longer wavelengths, and a prominent emission feature at C II 1335. RY Sgr displays a second, but fainter, emission attributed to Cl I 1351 (which is radiatively fluoresced by C II 1335), but Cl I is weak or absent in V854 Cen. Most surprisingly, the C II emission of V854 Cen is significantly extended along the slit by 2.5″, about AU at the distance of the star. The C II feature of RY Sgr exhibits no such gross extension. Nevertheless, subtle broadenings of the C II emissions beyond the point response profile suggests inner clouds of radius 01 (250 AU) around both stars. V854 Cen is only the third RCB star after R CrB and UW Cen known to have a resolved shell.
1 Introduction
The R Coronae Borealis (RCB) stars are a small group of hydrogen-deficient carbon-rich supergiants which undergo spectacular declines in brightness at apparently irregular intervals tied to their pulsation cycles (Clayton 1996). A cloud of carbon-rich dust forms along the line of sight, eclipsing the photosphere. As the photospheric light is extinguished, a rich narrow-line ( km s-1) emission spectrum appears.
In the visible, the narrow-line spectrum—referred to as E1—consists of many lines of neutral and singly ionized metals (e.g., Alexander et al. 1972). Most of the lines in the E1 spectrum are short-lived, fading within two or three weeks. What remains is primarily a broad-line (BL: 100–200 km s-1) spectrum consisting of fewer lines. Some of the early-decline emissions—primarily multiplets of Sc II and Ti II, also narrow and referred to as E2—remain strong for an extended period of time; especially Sc II (7) 4246. The E2 lines primarily are low excitation. The Balmer lines typically are very weak owing to the hydrogen deficiency of the RCB stars, and do not go into emission except in the case of the relatively hydrogen-rich V854 Cen. The late-decline visible BL spectrum is dominated by Ca II H and K, the Na I D lines, and He I 3888. He I 10830 also has been seen in R CrB (Querci & Querci 1978; Rao et al. 1999). The BL spectrum remains visible until the star returns to maximum light (when the BL emissions are overwhelmed by the rejuvenated photospheric continuum). A few optical nebular lines, such as [O II], also are seen in emission (Herbig 1949; Rao & Lambert 1993).
The UV spectrum undergoes a similar evolution (Clayton et al. 1992a; Lawson et al. 1999). The very early-decline spectrum (E1) is dominated by blends of many emission lines which form a pseudo-continuum. The Mg II doublet is present, but not particularly strong during the E1 phase. The E2 spectra still show substantial blended emission, but Mg II, Mg I 2852, and some of the Fe II resonance lines have strengthened. The late-decline BL spectrum is thought to be characterized by blended emission from multiplets of Fe II (2) 2400, Fe II (1) 2600, Fe II (62, 63) 2750, as well as Mg II and Mg I. C II 1335 and C III] 1909 also are seen, although their behavior is not as well documented; they are thought to be in the BL class as well (Lawson et al. 1999). Unlike other emission lines, C II 1335 can be seen at all times, perhaps thanks to its location deep in the UV where the stellar continuum is faint.
Here, we describe and compare high sensitivity far-UV observations of two key RCB stars—V854 Cen and RY Sgr—obtained with the HST Space Telescope Imaging Spectrograph (Woodgate et al. 1998). Our objective was to extend the exploration of the dusty ejections of these enigmatic objects to a spectral region where the photospheric continuum is weak, and thus emissions from the nebular environment of the stars could be probed more directly.
2 Target Stars
RY Sgr and V854 Cen are among the brightest of the RCB stars at maximum light. On the one hand, RY Sgr is a relatively normal RCB star, with a helium/carbon atmosphere (He/C 100) showing only trace amounts of hydrogen. On the other hand, V854 Cen is the least hydrogen-deficient RCB star, with H/C2, while the He/C ratio is 10–60, with the lower value the most likely (Asplund et al. 1998). Perhaps related to the high hydrogen abundance, the UV decline spectra of V854 Cen differ from those of RY Sgr (and R CrB) in an important respect: the presence of strong BL emission from C II] 2325 and C I 2965 (Clayton et al. 1992a,b).
Previously, Holm & Wu (1982) reported C II 1335 emission in an IUE low-dispersion spectrum of RY Sgr at a level of 10-14 ergs cm-2 s-1. C II has been detected in IUE spectra of R CrB and V854 Cen as well (Holm & Wu 1982; Holm et al. 1987; Clayton 1996). Both of these stars have measured integrated fluxes in C II of 10-14 ergs cm-2 s-1 (Brunner, Clayton, & Ayres 1998). Lawson et al. (1999) reported integrated 1335 fluxes of 110-13 ergs cm-2 s-1 for V854 Cen from 1991–1993. At these flux levels, both RCB’s would be easy targets for the low-resolution G140L mode of STIS.
The distance to V854 Cen, assuming M mag and 1, is 2.5 kpc (Lawson et al. 1990; Alcock et al. 2001). With the same assumptions, RY Sgr is at a distance of 1.5 kpc.
3 Observations
Both RCB stars were observed near maximum light. The RY Sgr pointing was on 1998 April 25 (JD 2450929), at of its 38-day pulsational cycle (ephemeris of Lawson & Cottrell 1990). We utilized the G140L mode with the 52 slit, covering the spectral range 1150–1730 Å at 2 Å resolution, with 01 resolution along the slit. Following a standard CCD acquisition, we obtained exposures of 1.97 ks and 2.65 ks in consecutive orbits. V854 Cen was observed on 1999 April 17 (JD 2451286), at of its 43.2-day pulsational cycle (ephemeris of Lawson et al. 1992, 1999). We obtained exposures of 2.01 ks and 2.94 ks in consecutive orbits. The STIS spectrum of RY Sgr was discussed previously by Clayton et al. (1999a).
We reprocessed both sets of observations according to the prevailing STIS calibrations in late 2000, using the on-the-fly facility of the HST archive. We co-registered each pair of 2-D long-slit spectral frames by measuring the cross-dispersion (“”) centroid of the spatial profile extracted from a continuum region 152030 Å; and the in-dispersion (“”) position by fitting the isolated C II 1335 feature. After co-adding the registered frames, we determined the image background in two bands flanking the spectral trace, beginning 125 pixels (1 pixel = 00244) on either side of the center, and extending for 75 pixels. The background levels appeared to be slightly asymmetric along the axis of the image, so we allowed for a linearly sloping correction. We extracted a 1-D spectrum for each bin by accumulating the intensities in a 20 pixel (05) band111This spatial interval should contain essentially all of the flux of a normal point source. centered on the centroid of the spectral stripe.
Figure 1 illustrates the 2-D and extracted 1-D spectra of V854 Cen and RY Sgr. In the spatially resolved images (lefthand panels), the central 05 is displayed on a linear scale, while the outer region has a logarithmic stretch to emphasize low-intensity spatial/spectral structure. The faint extended “peppering” in both images near 1300 Å represents enhanced residual photometric noise from the subtraction of the diffuse atomic oxygen airglow feature (which fills the 05 wide slit). The extended C II emission near 1335 Å in the V854 Cen image is conspicuous. In the 1-D spectral traces, the solid curves represent the extracted fluxes, while the dashed lines are the 1 photometric noise levels. The jagged intervals near 1215 Å are residuals (mostly noise) from the subtraction of the bright atomic hydrogen airglow feature. Note the logarithmic flux scale.
Both stars display prominent C II 1335 emission, which dominates the spectrum below 1400 Å. RY Sgr also shows, weakly, the C III 1175 multiplet, and Cl I 1351 (which likely is radiatively pumped by C II 1335: see Clayton et al. 1999a). However, V854 Cen lacks both features, at least at the sensitivity levels of our STIS G140L spectroscopy. V854 Cen has a step-like energy distribution longward of 1400 Å (probably due to the photoionization edges of C I at 1349 Å and 1444 Å), punctuated by strong absorptions due to the C I resonance multiplets at 1560 Å and 1657 Å. RY Sgr has a more smoothly rising continuum distribution, with only weak 1657 Å absorption apparent, flanked by Al I 1670. Additional absorption structure common to both stars is thought to be due to carbon monoxide A–X 4th-positive system bands (Clayton et al. 1999a). Integrated fluxes (or upper limits) of key spectral features are listed in Table 1. In the case of C II 1335, the line fluxes were integrated over the interval 1326–1344 Å, after a small background continuum level was removed (see Fig. 1). Because of the low resolution (2 Å), we cannot confirm from these data that the C II 1335 line is a broad line.
The STIS C II flux for RY Sgr is in good agreement with the IUE value reported by Holm & Wu (1982). However, the STIS measurement of the point-like C II emission in V854 Cen is much smaller than the IUE fluxes published by Brunner, Clayton, & Ayres (1998) and Lawson et al. (1999). The origin of the discrepancy can be traced to the importance of the extended diffuse emission component, as will be described shortly.
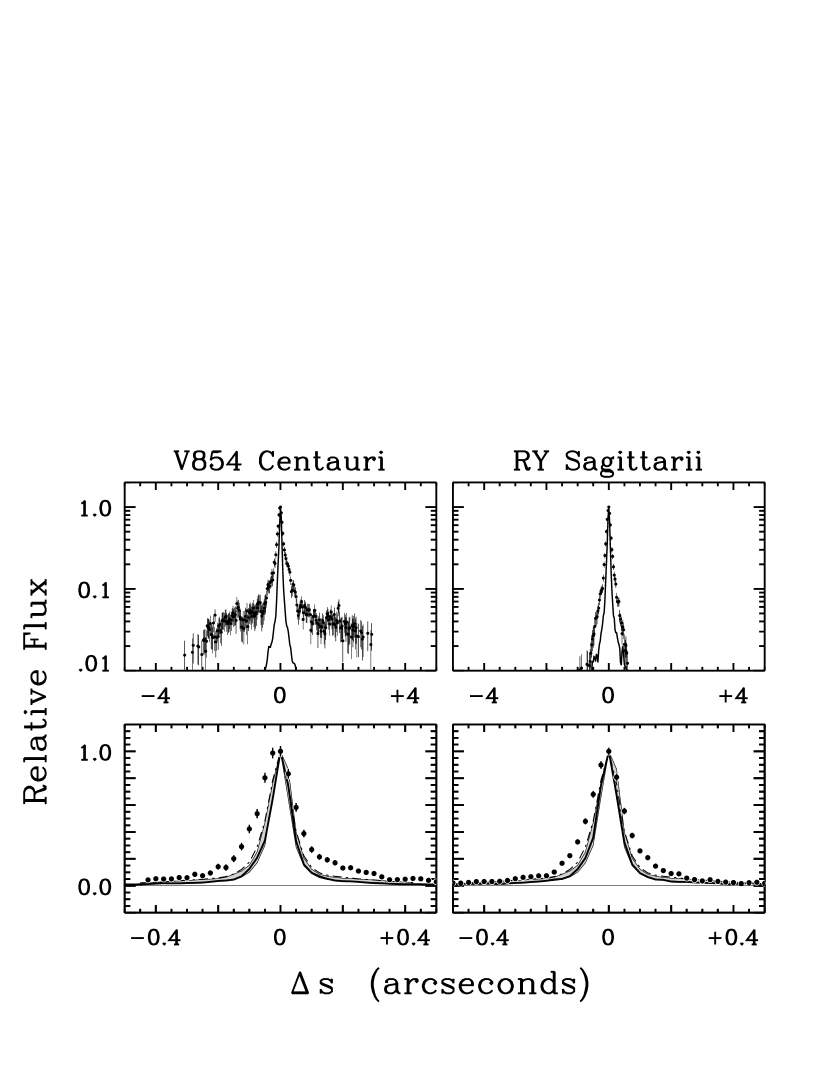
Figure 2 compares the cross dispersion profiles of C II 1335 in the two RCB stars. The upper panels illustrate the behavior well beyond the stellar core. The lower panels depict the near-star region. Points and error bars are the observed spatial profiles at 1335 Å, while the thin solid curves refer to the continuum band 152030 Å (we would have used the continuum in the immediate vicinity of the C II feature, but it is too weak to yield a suitable “core” profile). V854 Cen exhibits smoothly-extended C II emission, limb-darkened rather than brightened, reaching out to about 25. No comparable diffuse extended feature is apparent around RY Sgr.
However, as shown in the lower panels, both stars display broader C II spatial profiles in the near-star region than the continuum trace; and indeed the V854 Cen inner profile is offset from the stellar continuum “core” by about 10 milliarcseconds (25 AU at the distance of the star). The continuum spatial profiles of each star are the thicker solid curves in the lower panels. The shaded profile represents a 1520 continuum trace 1 based on an average of G140L 52″05 observations of several unresolved white dwarf (WD) stars (obtained from the HST archive); the dot-dashed curve is the 1335 trace from the same observations (without errors, which are of similar magnitude to the 1520 example). The 1335 WD profile is slightly wider than the longer wavelength trace at a level that is significant with respect to the standard error of the mean, but which hardly would be noticeable in the comparisons, for example, in the upper panels. (In the near-star examples, a background was determined in the zone (05–25), so that the influence of the extended emission of V854 Cen would be suppressed, and all the stars—including the comparison WDs—would be treated on the same basis.)
4 The Extended C II Emission
4.1 The outer 2 5
The surface intensity of the extended C II emission of V854 Cen has an average value of ergs cm-2 s-1 (′′)-2, having compensated for 9 of absorption at 1335 Å [assuming 1]. The appearance of the emission suggests that it comes from a filled volume or thick shell; rather than a thin shell, which would be strongly limb-brightened. For the sake of argument, we assume that the extended emission represents material ejected in a steady wind, with an density fall-off. The relatively mild decline of the observed surface intensity away from the star suggests that the inner part of the volume–perhaps 50% in radius–is evacuated, otherwise the C II flux would fall off much more rapidly.
Although we have only a 05 wide cut across the structure, we will assume that it is a uniform disk on the sky of radius 25. Integrating the specific intensity over that area yields a total dereddened emission of ergs cm-2 s-1, corresponding to ergs s-1 () at the 2.5 kpc distance of V854 Cen. Since the extended emission has a significantly larger total flux than the C II point source, and would fall entirely within the IUE 10″20″ large aperture, the spatially integrated emission ( ergs cm-2 s-1 before the reddening correction) is what should be compared to the IUE measures given previously, thereby accounting for the apparent discrepancy mentioned above.
There are two general possibilities to explain the extended C II emission: (1) collisional excitation in a warm ( K), perhaps shock-heated, gas; or (2) resonance scattering of the intrinsic stellar C II emission feature in an optically thick evelope. In the latter case, the gas could be collisionally ionized (and therefore warm), or photoionized (and thus potentially much cooler). Since atomic carbon can be photoionized out of the low-lying metastable 2p2 1D state (1 eV above ground; edge at 1239 Å) by H I Ly, and since V854 Cen has considerably more hydrogen than typical RCB’s, the latter case is a very real possibility.
4.1.1 Collisional excitation
In the collisionally excited warm plasma case, we can infer the emission measure () from the apparent flux of C II radiation. The emissivity of C II at K is ergs cm3 s-1 (cf., Kaastra, Mewe, & Nieuwenhuijzen [1996]; for a solar carbon to hydrogen ratio of ). We infer cm-3 (assuming that all of the electrons come from carbon, and that all of the carbon is singly ionized, i.e., ). The radius of the region is 25, or AU (0.03 pc) at the distance of V854 Cen.
Given the thick-shell geometry described previously, and the assumption of an outward decline in density, one can relate the average carbon density (which equals the electron density), and the total carbon number , to the emission measure. We find 1.2 cm-3 (which corresponds to an average particle density of 17 cm-3 for H/C= 2 and He/C= 10), and . The mean mass per carbon atom, with the abundances given above, is g; so the total mass of material in the shell is about g, or . To fill such a shell would require a wind of 200 km s-1 (such as is seen in the gas associated with dust formation in RCB stars) acting for a period of about 75 yr (to achieve the proposed AU thickness of the structure); the steady mass loss rate would have to be of order yr-1. The lifetime of the RCB evolutionary phase is uncertain, but R CrB, itself, has been an RCB star for at least 200 yr (Clayton 1996). If the gas is cooler than the temperature of maximum C II emissivity, the inferred densities could increase substantially.
A difficulty with the collisional excitation model—which leads directly into consideration of the scattering case—is that the predicted column density of C II is substantial, and resonance absorption of the intrinsic stellar C II emission feature should be severe (line center optical depths of , or so); unless the majority of the envelope material is strongly blueshifted (by more than the 200 km s-1 line width, if C II is a member of the broad-line class) and the internal velocity dispersion is low ( km s-1). That would require the envelope material to be suddenly accelerated to its terminal velocity, which seems unlikely.
4.1.2 Photoexcitation
In the scattering case, we imagine that atomic carbon gas streaming away from the star, perhaps dragged along with radiatively accelerated dust grains, becomes photoionized by a flux of H I Ly radiation from the star (produced by the same “chromospheric” processes that account for the intrinsic C II emission), creating a C+ Stromgren sphere. The C+ ions, in turn, could resonantly absorb the C II 1335 multiplet emission from the star; strongly attenuating the stellar emission and redistributing it throughout the Stromgren sphere by multiple scatterings. The process would be nearly conservative because the envelope density is so low that collisional deactivations would be negligible. Since the extended 1335 emission of V854 Cen appears to be about 7 the flux of the stellar point source, we infer that the average optical depth across the stellar C II features must be 2. If we imagine that the flow smoothly accelerates away from the star up to a terminal velocity of –200 km s-1, such that each velocity bin has equal C II column density, the optical depth at each point across the stellar emission feature will be , where the line oscillator strength is 0.1 for the two strong transitions of the multiplet, the line center wavelength is in Å, the flow terminal velocity is in km s-1, and is the column density of C+ ions in the ground state (cm-2). For the indicated , one infers a column density of about cm-2. If the shell thickness is AU, then the average C+ density would be about 0.02 cm-3, considerably smaller than we found for the collisionally excited case ( cm-3). The mass-loss requirements for filling the volume would be reduced dramatically as well.
The one caveat is that since the Ly photoionization of carbon occurs from an excited state, the local population of susceptible atoms depends very sensitively on the temperature (unlike a normal H II region where the photoionization is from the ground state, and locally virtually every H atom can be ionized, if sufficient hard photons are present). In a partially ionized carbon envelope, the local density could be significantly higher than indicated by the C II resonance absorption. We do see strong C I 1560 and 1657 resonance absorptions in the point source spectrum of V854 Cen, but the extent to which these are intrinsic to the stellar photosphere or contributed by the shell cannot be established with these low-resolution traces. There do not appear to be any sensible extended C I emission zones at those wavelengths in the spectral image, however, suggesting that the carbon probably is mostly ionized in the 25 shell; but the faintness of an extended C I region might simply be due to strong photospheric C I absorption that suppresses the photon flux available to excite the neutral gas.
Undoubtedly, one of the key differences between V854 Cen and RY Sgr, as far as revealing an extended carbon envelope, is the large hydrogen abundance of the former: the associated strong Ly emission might be instrumental in ionizing the envelope so that it would be susceptible to illumination by the stellar C II emission. On the other hand, the fact that both stars apparently possess inner C II emission zones might indicate that the near-star regions are collisionally ionized and excited, rather than photo-dominated.
Many of these issues could be addressed more definitively with higher spectral resolution measurements, which, for example, could disentangle Doppler shifted shell absorptions, if present, from the intrinsic stellar emission features.
4.2 The inner 0 1
We can obtain estimates for the inner emission zone of V854 Cen. We fitted a simple model to the apparent cross-dispersion profile of the C II feature, using the 1520 continuum profile as an estimate of the line spread function at 1335 Å. The model consisted of a point source, and two uniform surface brightness disks, one 01 in radius, the other 03. The best fit was achieved by shifting the point source by 001 relative to the continuum “core,” the smaller disk by 002 in the same direction, and the larger disk by 002 in the opposite direction. The relative fluxes were in the ratio 1.0 : 1.0 : 0.75. The innermost disk has a surface brightness about 40 times that of the 25 extended diffuse component.
At the distance of V854 Cen, the inner 01 disk has a radius of about 250 AU, and the average excess C II flux, corrected for reddening, is ergs cm-2 s-1. The corresponding C II luminosity is ergs s-1, and the carbon emission measure is cm-3 (again assuming the collisional excitation model in which carbon is the major electron donor, and is mostly singly ionized). Unfortunately, converting the emission measure into an average carbon density is more difficult in this situation, because the inner radius of the zone could be quite small (i.e., ): For a mass-conservative density law (for a constant velocity outflow), the average density scales as , if the inner radius is much smaller than the maximum radial extent of the zone.
We can, however, set an upper limit to the average density by assuming that the region is spherical with uniform density. In that case, 17 cm-3 (yielding an average particle density of 240 cm-3 for H/C= 2 and He/C= 10). The total mass of material in the volume would be about g, or , where again this would be an upper limit. The crossing time for a 200 km s-1 wind would be about 7 yr, so the upper limit to the steady mass loss rate would be y-1, significantly smaller than the mass flux required to fill the outer shell.
Similar intensity and emission measure estimates would apply to the inner emission zone of RY Sgr (which could be fitted adequately using only the point source plus a 01 radius inner disk). However, the He/C abundance ratio could be as much as that of V854 Cen, leading to a corresponding order of magnitude increase in the total particle density and mass of the emitting material.
5 Discussion
The BL lines such as Ca II and Na I require relatively modest energies ( eV) for ionization and excitation. But, other features such as C II , C III] and He I 10830 require significantly higher energies. The ionization potentials are 11 and 24 eV, respectively, to C+ and C++. The lower level of the He I 10830 transition is 20 eV above ground. It is metastable and could be populated from below by collisions or from above by cascades following recombination from He II (Geballe et al. 2001). Since the RCB stars discussed here have only modest photospheric temperatures, –7000 K, they cannot produce He II through photoionization. At the same time, it is likely that there are enough UV photons to singly ionize carbon (Rao & Lambert 1993), particularly from its low-lying 2p2 1D and 2p2 1S states (with edges at 1239 Å and 1444 Å, respectively).
Rao et al. (1999) suggested that the high-excitation lines arise in an accretion disk around a white dwarf secondary. In that model, the formation zone for the hot-broad lines would be relatively small ( AU) assuming cm-3, and offset a few AU from the primary. The apparent displacement of the C II emitting region by 001 or 25 AU, seen in V854 Cen, fits that model in a qualitative way. However, the fact that the majority of the C II 1335 emission of V854 Cen arises in an outer diffuse zone thousands of AU from the star renders the WD model less appealing. Collisional excitation in the extended thick shell perhaps is more plausible. High velocities (up to 400 km s-1) are seen in absorption and emission lines during declines, probably originating from gas dragged along with the dust blown away from the star by radiation pressure (Rao & Lambert 1993; Feast 1996, 2001; Clayton 1996). Rao & Lambert (1993) suggest that V854 Cen may have a high velocity bipolar outflow. In these fast-moving clouds, excitation might take place through atomic collisions or shocks (Feast 2001).
An additional curiosity of the BL region are the so-called “decline eclipses.” The BL lines often are constant throughout declines, but sometimes are seen to fade significantly over 100 days indicating that a portion of the BL emission is coming from within a few AU of the star (Herbig 1949; Clayton et al. 1992a; Lawson et al. 1999). The extended C II emission regions reported here bear some resemblance to the BL region deduced for V854 Cen by Rao & Lambert (1993) using forbidden lines. Assuming a homogeneous spherical nebula with = = 50 cm-3 they infer r 930 AU for V854 Cen at a distance of 2.5 kpc. If the filling factor is , then r AU. Our results are complementary in the sense that while we have the advantage of directly measuring the apparent size of the emission region(s) on the sky, we lack a diagnostic to establish the mean density, and thus the filling factor if the material is highly clumped. Unfortunately, a similar comparison cannot be applied to RY Sgr, because the same range of decline spectra do not exist.
Although, it is difficult to make definitive statements regarding the absence of an extended emission region around RY Sgr, we point out the following: On the one hand, RY Sgr is believed to be less distant than V854 Cen so a similar emission region would appear to be even more extended. Such an envelope around RY Sgr, with the same mass content as that of V854 Cen, would have as little as one tenth the carbon (owing to the larger He/C ratio), and thus only one hundredth the potential C II emission measure (if carbon is the major electron donor). Alternatively, the C II envelope of V854 Cen might be ionized into visibility by a significant H I Ly emission flux, whereas the H I resonance emission of RY Sgr would be much less prominent, owing to the severely reduced hydrogen abundance.
On the other hand, perhaps an extended low density BL region simply is not present around RY Sgr. V854 Cen arguably is significantly different from RY Sgr—and the majority of RCB stars—in its hydrogen and other element abundances, its high level of decline activity, and its emission line spectrum (Clayton 1996, Asplund et al. 2000). So, perhaps it would not be surprising if it differs in this manner as well.
The behavior of the V854 Cen lightcurve over the last century provides some support for the finding in §4.1 that the 25 shell likely is filled in the outer 50% and of lower density in the inner part. Although V854 Cen is one of the most active RCB stars today, it had an even higher mass loss rate in the period of 1913–1952 when it was generally fainter than 13th magnitude (Clayton 1996, and references therein). The shell could be filled by gas traveling at 200 km s-1 in 75 yr, which matches well with the observed timescales of the decline activity in V854 Cen. Approximately 50 yr of high activity followed by 50 yr of lesser activity could result in a relatively greater density in the outer part of the shell.
Other than V854 Cen, the only resolved RCB spatial structures are the large IRAS shell of R CrB (Gillett et al. 1986), and a tenuous 7″ radius envelope around UW Cen seen in dust-reflected visible light (Pollacco et al. 1991; Clayton et al. 1999b). At the assumed—but very uncertain—distance of UW Cen, the radius would be 0.2 pc (4 AU). It has been suggested that the UW Cen nebula is a fossil planetary nebula shell created by a slow-moving outflow from the star over thousands of years (Clayton et al. 1999b). But, in analogy with V854 Cen, such a shell also might be produced by high velocity ejections during the present RCB-star epoch.
References
- (1)
- (2)
- (3) Alcock, C. et al. 2001, ApJ, 554, 298
- (4)
- (5) Alexander, J. B., Andrews, P. J., Catchpole, R. M., Feast, M. W., Lloyd Evans, T., Menzies, J. W., Wisse, P. N. J., and Wisse, M. 1972, MNRAS 158, 305
- (6)
- (7) Asplund, M., Gustafsson, B., Rao, N.K., & Lambert, D. L. 1998, A&A, 332, 651
- (8)
- (9) Asplund, M., Gustafsson, B., Lambert, D. L., & Rao, N.K. 2000, A&A, 353, 287
- (10)
- (11) Brunner, A., Clayton, G.C, & Ayres, T.R. 1998, PASP, 110, 1412
- (12)
- (13) Clayton, G.C., Whitney, B.A., Stanford, S.A., & Drilling, J. S. 1992a, ApJ, 397, 652
- (14)
- (15) Clayton, G.C., Whitney, B.A., Stanford, S.A., Drilling, J. S., & Judge, P.G. 1992b, ApJ, 384, L19
- (16)
- (17) Clayton, G.C. 1996, PASP, 108, 225
- (18)
- (19) Clayton, G.C., Ayres, T.R., Lawson, W.A., Drilling, J.S., Woitke, P., & Asplund, M. 1999a, ApJ, 515, 351
- (20)
- (21) Clayton, G.C., Kerber, F., Gordon, K.D., Lawson, W.A, Wolff, M.J., Pollacco, D.L., and Furlan, E. 1999b, ApJ Letters, 517, L143
- (22)
- (23) Feast, M. 1996, A.S.P. Conf. Ser., 96, 3
- (24)
- (25) Feast, M. 2001, in Eta Carina and Other Mysterious Stars, ASP Conf. Ser., in press
- (26)
- (27) Geballe, T.R., Evans, A.E., Smalley, B., Tyne, V.H., & Eyres, S.P.S. 2001, astro-ph/0102043
- (28)
- (29) Gillett, F. C., Backman, D. E., Beichman, C., and Neugebauer, G. 1986, ApJ, 310, 842
- (30)
- (31) Herbig, G.H. 1949, ApJ, 110, 143
- (32)
- (33) Holm, A. V., & Wu, C. C. 1982, in Advances in Ultraviolet Astronomy: Four Years of IUE Research, NASA CP-2238, p. 429
- (34)
- (35) Holm, A. V., Hecht, J., Wu, C. C., & Donn, B. 1987, PASP, 99, 497
- (36)
- (37) Kaastra, J. S., Mewe, R., & Nieuwenhuijzen, H. 1996, in UV and X-ray Spectroscopy of Astrophysical and Laboratory Plasmas, Eds. K. Yamashita and T. Watanabe (Tokyo: Universal Academy Press), p. 411
- (38)
- (39) Lawson, W. A., & Cottrell, P. L. 1990, MNRAS, 242, 259
- (40)
- (41) Lawson, W. A., Cottrell, P. L., Kilmartin, P. M., and Gilmore, A. C. 1990, MNRAS, 247, 91
- (42)
- (43) Lawson, W.A.,Cottrell, P.L., Gilmore, A.C., & Kilmartin, P.M. 1992, MNRAS, 256, 339
- (44)
- (45) Lawson, W.A., Maldoni, M.M., Clayton, G.C., Valencic, L., Jones, A.F., Kilkenny, D., van Wyk, F., Roberts, G., & Marang, F. 1999, AJ, 117, 3007
- (46)
- (47) Pollacco, D. L., Hill, P. W., Houziaux, L., and Manfroid, J. 1991, MNRAS, 248, 572
- (48)
- (49) Querci, M., & Querci, F. 1978, A&A, 70, L45
- (50)
- (51) Rao, N. K., and Lambert, D. L. 1993, AJ, 105, 1915
- (52)
- (53) Rao, N. K., et al. 1999, MNRAS, 310, 717
- (54)
- (55) Woodgate, B. E., et al. 1998, PASP, 110, 1183
- (56)
| Star | C III 1175 | C II 1335 | Cl I 1351 |
|---|---|---|---|
| ( ergs cm-2 s-1) | |||
| V854 Cen | 0.5 | 14.90.31 | 0.2 |
| RY Sgr | 1.10.2 | 23.50.4 | 1.20.1 |