NGC 3310, a galaxy merger?
The H i structure and kinematics of the peculiar starburst galaxy NGC 3310 (Arp 217, UGC 5786) are discussed. New evidence bearing on the origin of the starburst is presented. The bulk of H i coincides with the bright optical disk and shows differential rotation. Its velocity dispersion is, however, unusually large for a spiral galaxy (up to 40 km s-1), suggesting that the disk is highly perturbed as already indicated by optical emission line spectroscopy. There are, in addition, two prominent H i tails, one extending to the north-west and the other, somewhat patchy, to the south. These H i tails, the perturbed kinematics and the peculiar optical morphology strongly suggest a recent merger between two gas-rich galaxies. This seems to have been a major merger in which most of the gas in the inner parts has been preserved in neutral atomic form and either one of the progenitor disks has survived or a new disk has formed.
Key Words.:
galaxies: individual: NGC 3310 – galaxies: starburst – galaxies: interactions – galaxies: kinematics and dynamics – radio lines: galaxies1 Introduction
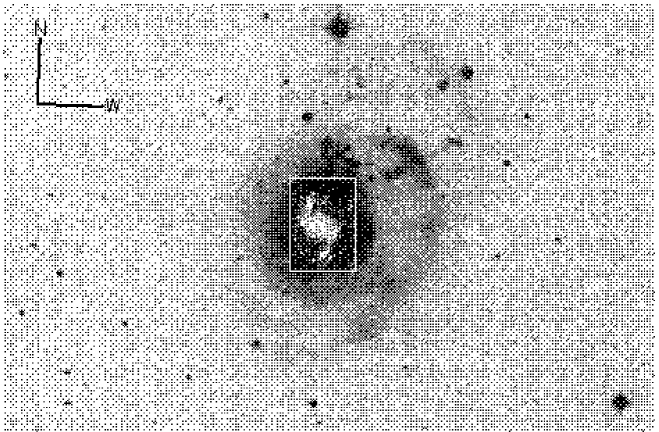
The galaxy NGC 3310, located in the vicinity of the Ursa Major cluster, lies at a distance of 13 Mpc111All distance dependent parameters are calculated using km s-1 Mpc-1 and is classified as SABbc(r)pec (de Vaucouleurs et al. 1991). Van der Kruit and de Bruyn (1976) have investigated its group membership and its environment and have concluded that it has no companions. Its main global properties are listed in Table 1. NGC 3310 is a relatively small system undergoing a strong starburst (Telesco & Gatley 1984; Smith et al. 1996). The optical morphology is illustrated in Fig. 1. The bright inner region is dominated by a two-armed open spiral pattern in H (van der Kruit & de Bruyn 1976; Balick & Heckman 1981; Mulder & van Driel 1996). The inner part of this well-developed pattern connects to a diameter starburst ring, surrounding the blue compact nucleus. The circumnuclear regions show a moderately low metallicity, whereas the nucleus has solar abundances (Pastoriza et al. 1993). The Far UV and B–band surface brightness profiles of NGC 3310 are very similar and seem to follow an R1/4 law outside the inner starburst ring (Smith et al. 1996). The outer parts of NGC 3310 are dominated by the so-called ‘bow-and-arrow’ structure (Walker & Chincarini 1967). The diffuse ‘bow’ at the western side is a ripple (at 6 kpc from the center) consisting primarily of late-type stars, possibly debris from an accreted disk (Schweizer & Seitzer 1988). A second fainter ripple can be seen farther out to the north-west. The ‘arrow’ (extending from 4 to 9 kpc from the center to the north-west) is a chain of bright knots consisting of stellar clusters most likely containing young massive stars and has a similar age as the central starburst ring (Smith et al. 1996). The ‘bow-and-arrow’ structure has been interpreted as a one-sided jet emanating from the nucleus (Bertola & Sharp 1984) or as the result of the accretion of a small gas-rich galaxy (Balick & Heckman 1981; Schweizer & Seitzer 1988; Mulder et al. 1995; Smith et al. 1996). Besides the ‘arrow’, other knots with recent star formation are seen at the northern and southern part of the disk (van der Kruit & de Bruyn 1976, their fig. 1).
| Quantity | Units | NGC 3310 | Ref.1 |
| Names | UGC 5786 | ||
| ARP 217 | |||
| PGC 31650 | |||
| Hubble type | SABbc(r)pec | V91 | |
| V91 | |||
| V91 | |||
| distance (adopted) | Mpc | 13.3 | |
| arcmin | V91 | ||
| kpc | |||
| mag | 10.92 | V91 | |
| 2 | 1.18 | ||
| mag | 0.32 | V91 | |
| 1.10 | S96 | ||
| SFRglobal | M☉ yr-1 | 8.5 | S96 |
| inclination angle (H) | degrees | K76 | |
| inclination angle (H i) | degrees | M95 | |
| position angle (H) | degrees | K76 | |
| position angle (H i) | degrees | M95 |
The ionized gas shows large streaming motions (up to 60 km s-1) along the arms (van der Kruit 1976; Grothues & Schmidt-Kaler 1991), which are consistent with the presence of a strong density wave (van der Kruit 1976; Mulder & van Driel 1996). The H rotation curve in the nuclear region is one of the steepest rising rotation curves found in spiral galaxies (van der Kruit 1976; Grothues & Schmidt-Kaler 1991). Another peculiarity is the offset between the dynamical center and the stellar nucleus of pc (Walker & Chincarini 1967; van der Kruit 1976; Balick & Heckman 1981).
Radio continuum maps (van der Kruit & de Bruyn 1976; Balick & Heckman 1981; Duric et al. 1986) show extended, remarkably bright synchotron emission from the inner regions and strong sources coincident with the giant H ii regions in the arms, in the inner ring, and in the nucleus. The strong IR emission correlates well with both the continuum and H emission (Telesco & Gatley 1984).
An earlier study of the neutral hydrogen (Mulder et al. 1995) revealed an H i extension of the optical ‘arrow’ out to kpc and extended H i at kpc to the south of the nucleus with no optical counterpart. Another peculiarity was a ‘hole’ in the H i distribution centered on the south-eastern part of the optical ring (SN 1991N is situated near the center of this ‘hole’). The molecular gas shows a clumpy distribution and is primarily associated with the spiral arms (Kikumoto et al. 1993; Mulder et al. 1995). In the nucleus it is less clear: a small amount of molecular gas is not ruled out. The total H2 mass, obtained using the Galactic CO–H2 conversion factor, is 2 108 M☉ (Kikumoto et al. 1993; Mulder et al. 1995), a value typical for late-type galaxies.
In summary, many features of NGC 3310 – the unusual morphology, the starburst features, the streaming of ionized gas along the arms, the offset between the dynamical center and the nucleus, the ripples in the outer parts, the ‘arrow’ and its H i counterpart – indicate that some major disturbance has affected gas and stars and has led to massive star formation. These features together with the Far UV and B–band R1/4 surface brightness profiles indicate that NGC 3310 may well be the result of a merger event.
New H i data, obtained with the Westerbork Synthesis Radio Telescope (WSRT) and combined with those of Mulder et al. (1995) are presented here. They give additional information concerning the origin of the starburst and of the optical and H i peculiarities.
| Observation | A | |
| 12hrs, 36m | 16 July 1997 | |
| 12hrs, 72m | 11 June 1997 | |
| B | ||
| 12hrs, 72m | 15 Jan. 1987 | |
| Field centers | A | |
| B | ||
| Central velocity (km s-1) | A | 970.00 |
| B | 1000.00 | |
| Baselines (m) | A | 36:2736:36 |
| B | 36:2700:72 | |
| Bandwidth (MHz) | 5 | |
| Number of channels | 63 | |
| Channel separation (km s-1) | 16.6 | |
| Velocity weighting | A | Uniform |
| B | Hanning | |
| Synthesized beam (FWHM) | C | |
| Velocity resolution (km s-1) (FWHM) | C | 33.3 |
| Noise level (1) (mJy beam-1) | C | 0.8 |
| (K) | 1.92 |
2 Observations and Data Reduction
The new 21-cm line observations of NGC 3310 were obtained with the WSRT as a part of WHISP (Westerbork H i Survey of Spiral and Irregular Galaxies) (Swaters et al. 2001). Due to telescope maintainance only 27 interferometers were available during these observations.
The main observational parameters are listed in Table 2, where ‘A’ denotes the WHISP observations, ‘B’ the observations obtained by Mulder et al. (1995) and ‘C’ the combination of ‘A’ and ‘B’ (described below). The combined observations were smoothed to and to study the extended, low surface brightness structures.
The map of the radio continuum was obtained from a linear fit of a baseline over the line free channels on either side of the band (28 channels in total) and was subsequently subtracted from the datacube. The resulting line maps were cleaned to correct for instrumental effects like sidelobes, grating rings and offset baselevels. The search area was determined for each channel map separately, in some cases after smoothing to 90″ to identify the regions containing extended emission. After cleaning, the new data and those of Mulder et al. (1995) were combined.
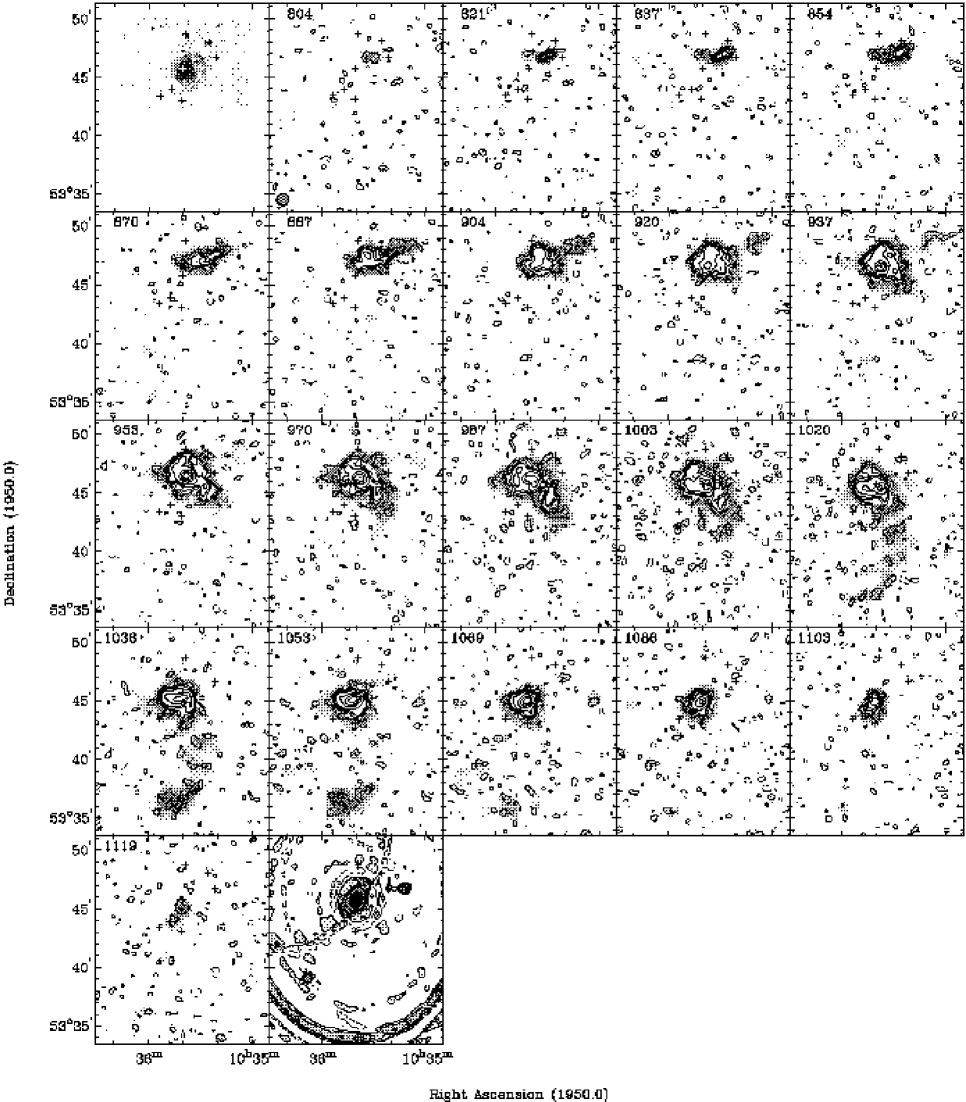
The H i channel maps are shown in Fig. 4. The contours show the distribution of H i intensity at 30″ resolution. The extended emission is shown at 60″ resolution by the shaded areas. The optical picture and the ‘dirty’ 30″ radio continuum map are also shown.
3 Analysis
3.1 Radio Continuum
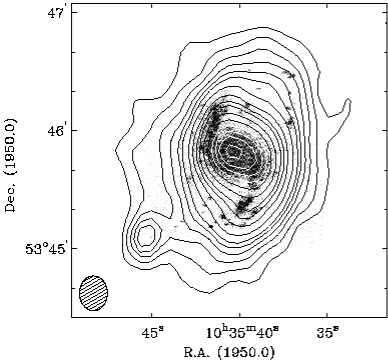
Figure 2 shows the cleaned radio continuum map of NGC 3310 at full resolution. The extended source of emission includes nucleus, central ring and spiral arms; its peak surface brightness is 63 mJy beam-1. The 5.5 mJy beam-1 point source, visible 1′ south-east of the nucleus, is probably a background source. The position of the nucleus cannot be determined accurately for such an extended source. The value of the continuum flux at 1.42 GHz (Table 3) agrees with those published by Lequeux (1971) and by Duric et al. (1986). The total power is ( (P1.42GHz/ W Hz-1)).

| Quantity | Units | Value | |
|---|---|---|---|
| Jy km s-1 | |||
| Jy | |||
3.2 Anomalous H i
The H i line flux was determined in each channel map at 60″ resolution. The resulting global H i profile is shown in Fig. 3. It is similar to that obtained by Mulder et al. (1995). The asymmetric structure and the remarkable tail on the low velocity side clearly point at some anomaly in the H i distribution and/or kinematics. The integral quantities derived from the global profile are listed in Table 3.
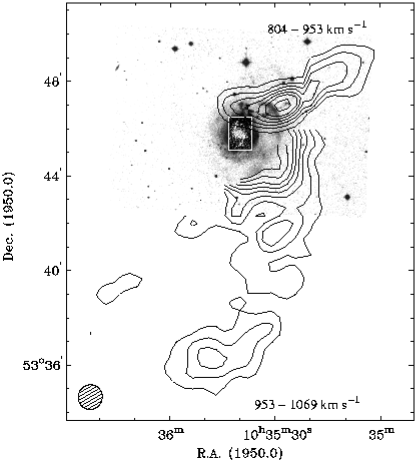
The channel maps (Fig. 4) show that the bulk of H i coincides with the bright optical disk and has the characteristic pattern of differential rotation. There are, in addition, two extended features, one on the north-west side visible in the velocity range 870 to 953 km s-1 and the other to the south, clearly visible (shaded) at velocities 1003 to 1069 km s-1. Both have already been noticed and reported by Mulder et al. (1995). The better sensitivity of the data presented here makes it possible, however, to significantly improve the study of their structure and kinematics. In the following, these two extended features will be referred to as the northern and the southern tail.
a) Northern tail
The H i extension to the north-west (Fig. 4) coincides with the already mentioned and well-known ‘arrow’. One cannot fail to notice the continuity in space and velocity of this feature with the emission in the channel maps at lower velocities, from 854 to 804 km s-1. It should also be noted that these are precisely the velocities of the anomalous tail in the global H i profile. It is therefore natural to associate the H i in the anomalous 804–854 km s-1 velocity range with the anomalous H i pointing away from the main body (the ‘arrow’) in the adjacent, higher velocity channels 870 to 953 km s-1. The resulting structure has the shape of a tail (see Fig. 5) located on the northern edge of the disk, slightly curved and elongated from the east to the north-west. It has been obtained by adding the H i over the whole velocity range 804 to 953 km s-1 and by taking, at velocities 887 to 953 km s-1, only the emission from the arrow. There is a striking coincidence of this H i tail not only with the optically bright knots of the ‘arrow’ itself but also with the bright compact knots seen along a curve on the northern side of the bright disk of NGC 3310. Since the tail is unresolved at 60″, the same procedure as described above was repeated at 30″ and the result is shown in Fig. 6a. The coincidence with the optical knots is even clearer, suggesting a physical association of the knots with the H i tail. These knots should then have the same velocity as the H i; but according to the H data published by Mulder & van Driel (1996), their velocities seem to be around 950 km s-1, difficult to reconcile with the velocity of the H i indicated here.
The kinematics and structure of the tail are illustrated in the position–velocity map of Fig. 6b which was constructed along the path marked by the crosses in Fig. 6a. The distance along the tail in Fig. 6b is measured with respect to the most eastern marker. The figure shows the H i of the disk, which is centered at 950 km s-1, and the tail (shaded), which is in the velocity range 800 to 940 km s-1. There is a dip in the tail at a distance of 150″ and a velocity of 850 km s-1. The main properties of the tail are listed in Table 4. Its H i mass is about 8% of the total hydrogen mass of NGC 3310.
Clearly, if the above analysis is valid and it is correct to connect the
kinematically anomalous H i with that of the ‘arrow’ as we have done,
a completely new physical picture emerges: instead of a straight jet
pointing outward from the nucleus as suggested before (Bertola & Sharp 1984), we
have a curved tail-like structure attached to the northern edge of the
bright optical disk.
b) Southern tail
The channel maps in Fig. 4 show an extended, peculiar feature (shaded area) on the southern side of NGC 3310 at radial velocities ranging from 953 up to . It has a somewhat patchy, but coherent tail-like structure (see also Fig. 5) connecting smoothly to the H i disk on its western side. The southern structure shown in Fig. 5 was obtained by adding all channel maps in the above velocity range.
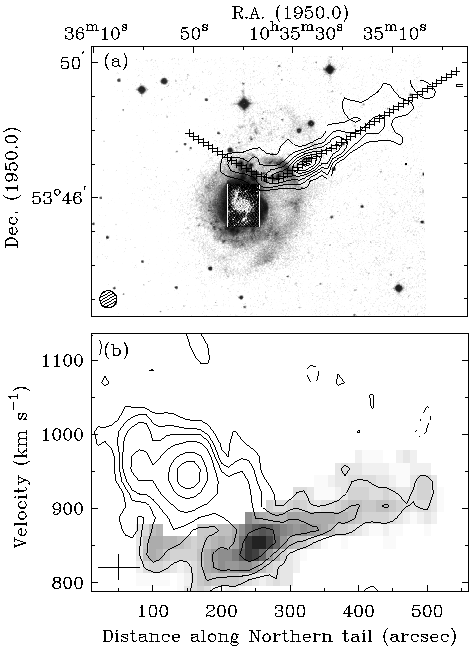
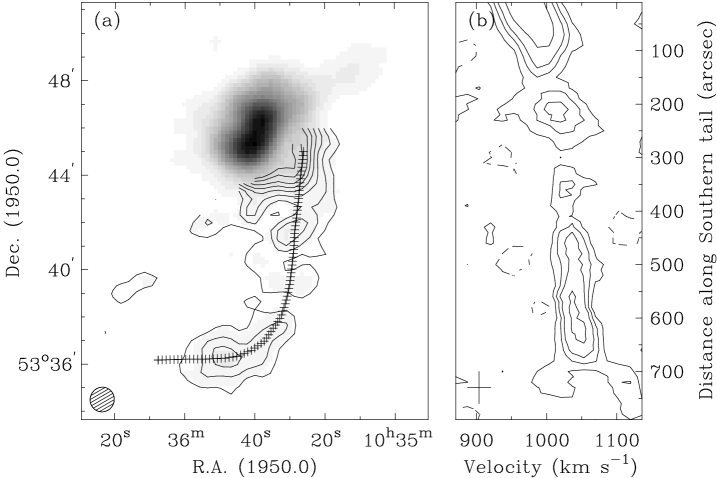
Fig. 7a shows the tail and the total H i at 60″ resolution. The crosses mark the path along which the position–velocity map shown in Fig. 7b was constructed. The distance along the tail in Fig. 7b is with respect to the most northern marker. The figure shows a clear continuity in both space and velocity from the inner to the outer regions. The tail seems to be an extension of the western part of the H i disk (the emission closer to the bright disk has been omitted because of confusion). Its main properties are given in Table 4. Its H i mass is at least 9% of the total hydrogen mass of NGC 3310.
| Quantity | Units | Northern | Southern |
|---|---|---|---|
| 108 M☉ | |||
| Length | kpc | 23 | 51 |
| 1020 cm-2 | 7.5 | 1.5 | |
| km s-1 | 17 | 13 |
In addition to the two well-developed H i tails, Fig. 5 also shows hints of an isolated feature to the south-east of NGC 3310, visible (faint shaded areas) in Fig. 4 at velocities of 1053 and 1069 km s-1. This could be part of the southern tail described above. The present observations, however, are not sensitive enough to be sure of the reality of this feature.
3.3 H i disk
The overall H i density distribution and the velocity field in and around NGC 3310 are shown in Figs. 9a and b. More detailed maps of the H i disk, at 20 arcsec resolution, are presented in Figs. 9c and d. The high-resolution total H i map was obtained by defining the area of the emission for each channel map using the lower-resolution maps as masks. The velocity field was obtained by taking the density weighted mean with a 1.7 mJy beam-1 (2) cutoff. In the construction of these maps, the emission from the northern and southern tails, clearly visible in the 60″ channel maps, was masked out in order to have a clearer picture of the disk structure and kinematics.
In the 60″ map, the central surface density reaches 2.4 1021 cm-2 which corresponds to 11 M☉ pc-2 in the plane of the galaxy. This is similar to the values found for normal high surface brightness galaxies (Broeils & van Woerden 1994; Rhee & van Albada 1996). The 20″ resolution map shows that the peak surface density is actually 4.5 1021 cm-2 and is reached about 30″ south of the optical center.
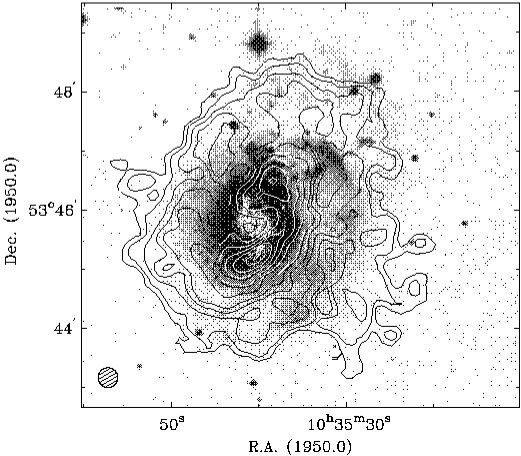
The 20″ map (Fig. 9c) shows a disk with a bright inner part and a large depression centered 8″ ( 500 pc) south-east of the optical center. This depression coincides with the brightest region of Far UV emission (Smith et al. 1996). The bright inner part is surrounded on all sides by low surface density structures (average densities about 5 M☉ pc-2). In Fig. 8 this H i map is compared with the optical image. The highest H i density features appear to coincide with the extensions of the optical spiral arms (compare Fig. 8 and Fig. 9c). The outer low surface brightness H i seems to coincide only partly with the optical ripple (the ‘bow’) in the north-west and on the southern side.
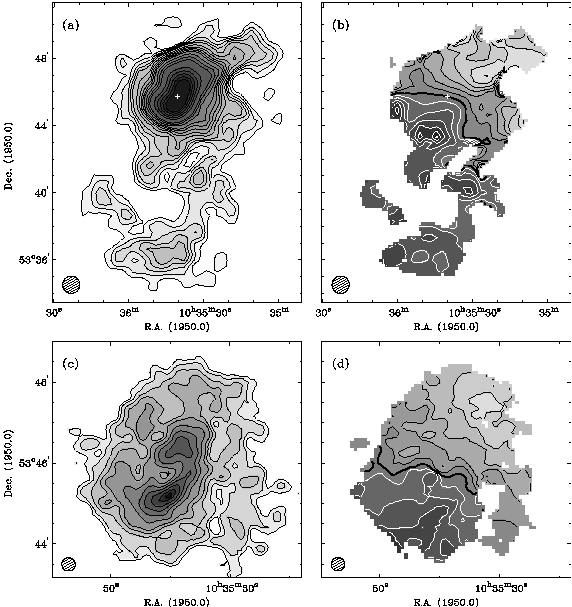
The motion of the H i disk is clearly dominated by differential rotation although there are irregularities, especially in the outer parts (Fig. 9b and d). At 60″ resolution such irregularities are partly due to the presence of the anomalous H i.
The H i velocity dispersion is unusually large (ranging from 20 to 40 km s-1), especially in the inner high-density regions which coincide with the stellar disk. H i position-velocity maps taken from the 20″ data at various position angles (see e.g. Fig. 10b) show this very clearly and reveal the presence of faint velocity tails even extending to the quadrant of forbidden velocities (across the systemic velocity line). In the same areas of the disk, H ii regions also show large (30–40 km s-1) velocity dispersions and large deviations from circular motion (van der Kruit 1976; Grothues & Schmidt-Kaler 1991; Mulder & van Driel 1996).
A tilted-ring model (cf. Begeman 1989) was fitted to the velocity field to determine the center of rotation and the inclination angle. This led to an inclination of 567 degrees for the H i disk, significantly larger than found for the optical disk (Table 1).
The azimuthally–averaged radial density distribution of the H i was calculated from the data at 30″ resolution by averaging the signal in circular rings in the plane of the galaxy. The inclination angle was kept fixed at 56 degrees and the major axis position angle at 150 degrees. The H i distribution is approximately exponential. The scalelength () and the radius at a level of 1 M☉ pc-2 () are given in Table 5. They are similar to those found for galaxies of the same Hubble type (Sbc) as NGC 3310 (Verheijen 1997).

The tilted-ring model fits were also used to derive the rotational velocity. Inclination and position angles were kept fixed. The rotational velocities obtained for an inclination angle of 56 degrees, a position angle of 150 degrees and systemic velocity of 1006 km s-1 and estimated for each side separately, are presented in Fig. 10a as dots (approaching side) and crosses (receding side). The H i rotational velocity is 60 km s-1 at 15″ from the center, just outside the optical ring, and slowly increases further out. Beyond the optical disk, the velocity of the approaching side rises up to 120 km s-1 whereas the velocities of the receding side level off at 80 km s-1. The curve derived from the H observations (van der Kruit 1976) is also shown (rescaled using the H i inclination). It shows solid body rotation in the inner region up to the starburst ring at 10″ reaching a maximum of 105 km s-1. This is followed by a sharp drop-off down to 60 km s-1 and a slight increase up to 80 km s-1 at 70″. The sharp drop in the curve is steeper than Keplerian, indicating that there are non-circular motions present in the inner region (van der Kruit 1976).

Figure 10b shows the rotation curves of the approaching and receding sides superposed (after projection to ) on the H i position-velocity map along the major axis. The projected H velocities (van der Kruit 1976) are also shown (dotted line). There is good agreement between the H i and H: although the H i data are too coarse to get a good estimate of the rotation near the center, the lowest contours in the H i position-velocity map show that the H i motion is consistent with the H velocities. Figure 10b shows clearly that, in spite of its overall rotation, the H i has a peculiar kinematics characterized by a large velocity dispersion and asymmetric profiles. The H i rotation curve derived here has large uncertainties, especially because of the large deviations from circular motion. This uncertainty is of order km s-1. However, the agreement of the H i and H curves between 20 and 60 arcsec (Fig. 10) indicates that the amplitude of the projected rotation curve adopted here is probably correct. The optical and H i inclination and position angles (Tables 1 and 5) are also very uncertain and do show large discrepancies.
Because of all these problems and uncertainties the standard analysis with the well-known decomposition in luminous (stars and gas) and dark components (Begeman 1989) may be doubtful. In the following, the results obtained on the mass distribution, the total mass and the mass-to-light ratio should therefore be taken with caution.
The R–band surface brightness profile (Fig. 11, dots) was derived from an optical (R–band) image of NGC 3310 (Swaters et al. 2001) using the inclination and position angles as determined from the H i (Table 5). It is best described by an R1/4 law (Fig. 11, the effective parameters and are given in Table 5), except for the inner 10″ (the compact nucleus and the starburst ring). For comparison an exponential disk fit to the bright disk gives a scalelength (0.6 kpc) and R–mag arcsec-2. The surface brightness profile as derived using the inclination and position angle of the optical disk is also shown (circles).
| Quantity | Units | Value |
|---|---|---|
| inclination angle (H i) | degrees | |
| position angle (H i) (NE) | degrees | |
| (heliocentric) | km s-1 | |
| 109 M☉ | ||
| arcsec | ||
| arcsec | ||
| mag | mag | |
| 1 | ||
| arcsec | ||
| R–mag arsec-2 | ||
| (maximum disk) | 1010 M☉ | |
| (inside r=110″) | 1010 M☉ | |
| / | M☉/LR,☉ | |
| / | M☉/LR,☉ | 3.4 |
| / | ||
| / |
-
1.
The R–band magnitude is converted to luminosity in solar units using M.
The rotation curve for the disk was calculated from the R–band photometric profile (Fig. 11, dots) assuming a truncated disk potential (Casertano 1983) and a mass-to-light ratio constant with radius. The rotation curve of the gas was derived from the H i density distribution after multiplication by a factor of 1.32 to correct for the presence of helium. The maximal rotation curve of the luminous matter (gas & stars) is shown in Fig. 10a (dashed curve). A clear discrepancy with the observed rotation curve is visible in the outer parts. Such discrepancies are usually taken to be evidence for the presence of a dark halo. In the inner ring there is a large difference between the maximal rotation curve and the H curve. This would imply a mass discrepancy also in the inner region and the presence of a dark mass of about 5 109 M☉. However, the sharp drop in the H curve is steeper than Keplerian (van der Kruit 1976), indicating that at least part of the discrepancy is caused by non-circular motions.
The mass derived for the maximum disk and the total mass out to 110″ (= 7.1 kpc) are given in Table 5. When compared to regular spiral galaxies of similar rotational velocity (e.g. Verheijen, 1997) NGC 3310 has a rather large R–band luminosity (Table 5) and low values for the mass-to-light ratio of the maximum disk (/ = M☉/LR,☉) and for the global mass-to-light ratio inside 110″ (/ = 3.4 M☉/LR,☉). The amplitude of the rotation curve may have been underestimated due to our choice of inclination angle. This may have led to a factor 2 underestimate of the maximum disk and total masses.
4 Discussion & Conclusions
The H i observations presented in the previous section have provided new evidence bearing on the dynamics of NGC 3310 and on the origin of the starburst. The main results are the two conspicuous H i tails connected to the northern and southern sides of the disk and the unusually large velocity dispersion of the H i in the disk.
The velocity dispersion of the H i in the disk, of up to 40 km s-1, quite large compared to the values of 7 to 12 km s-1 usually found in spiral galaxies, can be attributed for only a small part to profile broadening caused by differential rotation inside the instrumental beam. Most of it must come from an intrinsically high gas turbulence or, more likely, to deviations from circular motion, like the streamings seen in H. Such deviations would cause, because of the relatively large beam (20 arcsec = 1.3 kpc), broad velocity profiles. The H i data confirm the results of optical spectroscopy and indicate that the gaseous disk of NGC 3310 is highly disturbed. Large deviations from circular rotation must be present all over the disk and it is not clear whether all non-circular motions are in the plane of the disk.
The two extended tails on opposite sides of the NGC 3310 disk have similar H i masses but different morphologies and kinematics. The one to the south is more extended, reaching out to 51 kpc, broader on the sky and more patchy and has almost constant radial velocity (close to the systemic velocity). It has lower H i surface density and no optical counterpart. Its velocity dispersion is around 13 km s-1. The tail on the northern side is less extended, half the length, narrower and covers a larger velocity range. Its velocity dispersion is very similar to that of the southern tail.
The northern tail has been constructed with the assumption that the H i emission with anomalous velocities 804 to 854 km s-1 on the northern side of NGC 3310 and the H i coinciding with the ‘arrow’ form one continuous structure. This is clearly in contrast with the interpretation of the arrow as a one-sided jet violently emitted from a compact central source as proposed by Bertola & Sharp (1984). According to the interpretation favoured here, the chain of compact H ii regions visible to the north of the bright optical disk would be part of a curved structure continuing to the west with the ‘arrow’ and coinciding with the H i tail. On Plate 2 of Bertola & Sharp (1984) the continuity between the arrow and the chain of northern optical knots seems obvious. This would imply, however, similar radial velocities of H i and H ii, whereas the measurements by Mulder & van Driel (1996) seem to indicate that the H ii velocities are about 100 km s-1 higher. It is possible that there is confusion with H ii emission from the disk. At any rate, it is clear that this point is important for the interpretation proposed here and should be verified by accurately determining the optical radial velocities.
In conclusion, it seems that in all their properties the two H i tails found associated with NGC 3310 resemble the tidal tails seen in gravitationally interacting systems and mergers. It should be noted, however, that in this respect the relative orientation of the two tails may pose a problem (see below).
All the evidence discussed above –the optical ripples, the disturbed kinematics of the gaseous disk and the two H i tails– seems to point to a recent merger event. A merger or a major accretion event for NGC 3310 has been suggested before (Balick & Heckman 1981; Schweizer & Seitzer 1988). One possibility is the type of encounter in which an Irr I galaxy is being cannibalized by NGC 3310 as proposed by Balick & Heckman (1981). Any such explanation should, however, also account for the presence of the two gaseous tails revealed by the present study. The two equal mass, extended tails, the H i gas content and the small total mass seem to point to a merger between two galaxies of small and comparable masses, of which at least one gas-rich. Indeed, Schweizer’s (1978) five characteristics to be expected for a recently merged pair of galaxies –a pair of long tails, an isolated merger-remnant candidate, a single nucleus, chaotic motions and the tails moving in opposite directions – seem to be all present for NGC 3310. For the fifth condition –the two tails moving in opposite directions–, there may be a problem concerning the orientation of the northern tail. It is possible, however, that the tail is not in one plane and that the optical and HI pictures are the projection of a more complex structure. The cluster of northern HII regions does suggest a possible turn of direction from north-north-east to the south-west (see Plate 2 of Bertola and Sharp Bertola & Sharp 1984). The actual merger process may have been more complex and has, perhaps, involved a third small object as the ‘bow’ and the other ripples seem to suggest. It is remarkable, at any rate, that after such an apparently ‘major’ merger event there should still be a disk. This is clearly different in many respects (in spite of the remarkable R1/4 photometric profile) from the well studied merger case NGC 7252, the ‘Atoms-for-Peace’ (Hibbard et al. 1994). The unsettled disk we observe now in NGC 3310 could then be either a newly formed disk with spiral arms and star formation going on, or the disturbed disk of one of the progenitors which has survived the merger and is now undergoing new star formation. This would argue in favour of the robustness of disks.
The present observations have added a few more pieces to the interesting puzzle of NGC 3310. It is clear, however, that for a better understanding of the origin of its peculiar morphology and kinematics detailed numerical simulations as done for example by Hibbard & Mihos (1995) for NGC 7252 are needed.
Acknowledgements.
We wish to thank Rob Swaters and Marc Balcells for providing the R–band image of NGC 3310, and Tjeerd van Albada and Piet van der Kruit for helpfull comments. We have used the GIPSY package, developed at the Kapteyn Astronomical Institute, for the data reduction and analysis. The Westerbork Synthesis Radio Telescope is operated by the Netherlands Foundation for Research in Astronomy (NFRA / ASTRON), with financial support by the Netherlands Organization for Scientific Research (N.W.O.).References
- Balick & Heckman (1981) Balick, B. & Heckman, T. 1981, A&A, 96, 271
- Begeman (1989) Begeman, K. G. 1989, A&A, 223, 47
- Bertola & Sharp (1984) Bertola, F. & Sharp, N. A. 1984, MNRAS, 207, 47
- Broeils & van Woerden (1994) Broeils, A. H. & van Woerden, H. 1994, A&AS, 107, 129
- Casertano (1983) Casertano, S. 1983, MNRAS, 203, 735
- de Vaucouleurs et al. (1991) de Vaucouleurs, G., de Vaucouleurs, A., Corwin, H. G., et al. 1991, Third Reference Catalogue of Bright Galaxies (New York: Springer)
- Duric et al. (1986) Duric, N., Seaquist, E. R., Crane, P. C., & Davis, L. E. 1986, ApJ, 304, 82
- Grothues & Schmidt-Kaler (1991) Grothues, H. G. & Schmidt-Kaler, T. 1991, A&A, 242, 357
- Hibbard et al. (1994) Hibbard, J. E., Guhathakurtha, P., van Gorkum, J. H., & Schweizer, F. 1994, AJ, 107, 67
- Hibbard & Mihos (1995) Hibbard, J. E. & Mihos, J. C. 1995, AJ, 110, 140
- Kikumoto et al. (1993) Kikumoto, T., Taniguchi, Y., Suzuki, M., & Tomisaka, K. 1993, AJ, 106, 466
- Lequeux (1971) Lequeux, J. 1971, A&A, 15, 30
- Mulder & van Driel (1996) Mulder, P. S. & van Driel, W. 1996, A&A, 309, 403
- Mulder et al. (1995) Mulder, P. S., van Driel, W., & Braine, J. 1995, A&A, 300, 687
- Pastoriza et al. (1993) Pastoriza, M. G., Dottori, H. A., Terlevich, E., Terlevich, R., & Diaz, A. I. 1993, MNRAS, 260, 177
- Rhee & van Albada (1996) Rhee, M.-H. & van Albada, T. S. 1996, A&AS, 115, 407
- Schweizer (1978) Schweizer, F. 1978, in Structure and Properties of Nearby Galaxies, ed. E. Berkhuijsen & R. Wielebinski (Reidel), pp.279
- Schweizer & Seitzer (1988) Schweizer, F. & Seitzer, P. 1988, ApJ, 328, 88
- Smith et al. (1996) Smith, D. A., Neff, S. G., Bothun, G. D., et al. 1996, ApJ, 473, L21
- Swaters et al. (2001) Swaters, R. A., van Albada, T. S., Sancisi, R., & van der Hulst, J. M. 2001, A&A, submitted
- Telesco & Gatley (1984) Telesco, C. M. & Gatley, I. 1984, ApJ, 284, 557
- van der Kruit (1976) van der Kruit, P. C. 1976, A&A, 49, 161
- van der Kruit & de Bruyn (1976) van der Kruit, P. C. & de Bruyn, A. G. 1976, A&A, 48, 373
- Verheijen (1997) Verheijen, M. A. W. 1997, PhD thesis, University of Groningen
- Walker & Chincarini (1967) Walker, M. F. & Chincarini, G. 1967, ApJ, 147, 416