The Thermal X-ray Emitting Shell of LMC Supernova Remnant 0540-69.3
Abstract
We use data from the Advanced CCD Imaging Spectrometer (ACIS) on the Chandra X-ray Observatory to image the shell surrounding the pulsar B0540-69, and to measure its spectral properties. Weak emission line features, notably of Fe, Mg and Si, indicate that the shell is composed primarily of ambient material heated by the blast wave. The shell emission in the east is faint and circular in appearance, with a temperature and ionization age of approximately 5 keV and s, respectively. The emission in the west is brighter and has a more complex, distorted morphology, and is fitted with significantly lower average temperatures and higher ionization ages. An image with photon energies above 2 keV shows two hard arcs of emission located diametrically opposite each other at the outer boundary of the remnant shell; the spectra from these regions could include a substantial nonthermal component.
1 Introduction
The 50 ms pulsar B0540-69 in the Large Magellanic Cloud (LMC) has often been compared to the Crab: both are young and bright, have similar periods and ages, and have been detected at X-ray through radio wavelengths. The pulsar spindown age is 1660 yr (Seward, Harnden, & Helfand 1984), making 0540-69.3 the second youngest known supernova remnant in the Large Magellanic Cloud after SNR 1987A, which is located nearby in the same neighborhood of 30 Doradus.
In the radio, PSR B0540-69 is surrounded by a well-defined shell of radius (Manchester, Staveley-Smith, & Kesteven, 1993). This supernova remnant has the distinction of being classified as oxygen-rich because it appears in the optical as a small 4′′ radius shell of emission bright in [OIII], presumably from ejecta (Mathewson et al. 1980, Chanan, Helfand, & Reynolds 1984, Kirshner et al. 1989, Caraveo et al. 1992); some patchy [OIII] emission is also detected at a larger radius just south of the indentation in the radio shell to the west (Seward & Harnden 1994, Mathewson et al. 1980). Both the presence of the pulsar and the oxygen-rich ejecta are consistent with a massive progenitor for SNR 0540-69.3. Reynolds (1985) constructed a scenario for this remnant based on all the data then available, pointing out that the optical emission probably arises from ejecta that have been shocked and accelerated by the expanding bubble of relativistic gas associated with the pulsar. This situation is similar to that in the Crab, where the weak [OIII] emission surrounding the synchrotron nebula is produced by a radiative shock driven into the freely-expanding ejecta by a bubble of relativistic gas, while the bright optical filaments are formed via the Rayleigh-Taylor instability (Hester et al. 1996). The probable age of the remnant 0540-69.3 is 8001000 yr, according to Reynolds (1985); the age of 762 yr implied by the optical expansion velocities (Kirshner et al. 1989) is likely to be an underestimate because the ejecta are expected to have been accelerated by the pulsar nebula.
The pulsar nebula dominates the X-ray emission from SNR 0540-69.3 (Clark et al. 1982), but diffuse X-rays corresponding roughly to the radio shell were imaged with the ROSAT High Resolution Imager (Seward & Harnden, 1994). A recent Chandra High Resolution Camera calibration observation provides a much improved image clearly showing a distorted X-ray emitting shell, much brighter towards the west (Gotthelf & Wang 2000). The diffuse X-rays are presumed to be thermal emission associated with the blast wave, but neither the ROSAT nor Chandra imaging observations provide spectral information. Kaaret et al. (2001) used these and other Chandra calibration observations to study the pulsar, for which we present our results in a separate paper (Petre et al. 2001, in preparation).
The recent XMM-Newton observation of SNR 0540-69.3 (van der Heyden et al. 2001) gave the first conclusive proof of thermal X-ray emission associated with the remnant. Spectra from the Reflection Grating Spectrometers (RGS) on XMM show blueshifted (radial velocities km/s) emission lines of O VIII from the southwestern part of the remnant, where the line emission is most prominent. A temperature of =0.6 keV and an ionization age (the product of electron density and the time since shock heating) of =2.5 cm-3 s are inferred for this region. The roughly 1′ diameter of the remnant, compared to the spatial resolution of the XMM mirrors, interferes with the ability to make more definite statements about the origin of the thermally emitting gas. The thermal spectra are all blended with emission from the pulsar nebula, and while the RGS provide excellent high-resolution soft X-ray spectra, their sensitivity to X-rays with energies above about 2 keV is low.
We report here on Chandra X-ray observations of SNR 0540-69.3 with the Advanced CCD Imaging Spectrometer (ACIS). These data show a complete ring of X-ray emission surrounding the pulsar with a striking correspondence to the radio shell. Furthermore, ACIS allows us to isolate the diffuse thermal X-ray emission from this remnant from that of the pulsar, and to detect its spatial variations.
2 Observations and Images
Chandra observed SNR 0540-69.3 on 22-23 November 1999 for 27.4 ks with the primary back-illuminated CCD chip ACIS-S3. The remnant was imaged entirely on readout node 1 of the CCD, and the data were accumulated in faint mode; the reader is referred to the Chandra documentation for technical details about ACIS and Chandra111(http://asc.harvard.edu/udocs/docs/docs.html). The total count rate was stable during this observation, with no indication of strong background flares.
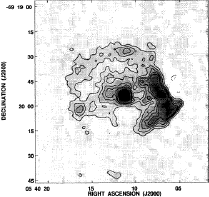
Figure 1 shows the ACIS broadband (0.3-10 keV) image, both raw and adaptively smoothed with a boxcar filter of variable size containing a minimum of 25 counts per smoothing beam; the 5 GHz radio image and contours from Manchester et al. (1993) are also shown on roughly the same angular scale. The high X-ray count rates in the vicinity of the pulsar result in two image artifacts: 1) low detected counts where the true count rate exceeds the pile-up threshold (this effect is not visible in Figure 1 as the image of the pulsar nebula has been overexposed to enhance visibility of the faint shell), and 2) symmetrical trails along the y-axis of the detector (diagonal in the figure, which is oriented with north towards the top of the page) due to trapping of large charge amounts in the piled-up region. Weisskopf et al. (2000) give a brief but informative discussion of pile-up in ACIS.
The X-ray shell imaged by ACIS closely follows the radio morphology at 5 GHz, as can be seen by comparing the panels of Figure 1. In the east, the emission appears circular, with a slight enhancement at the limb. The brightest portions of the shell are to the west, and the shell is markedly indented in the northwest. The angular distance from the pulsar to the edge of the shell varies from 20′′ (5 pc for a distance of 50 kpc to the LMC) at the northwest indentation, up to about 40′′ (10 pc) in the faint portions of the shell to the east and south. The bright spot just south of east in the 5GHz radio image is not comparably bright in X-rays, but the bright radio and X-ray features are otherwise well matched.
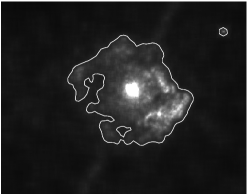
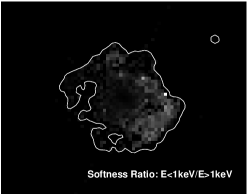
X-ray color images of the remnant are shown in Figure 2. The left panel shows the ratio image of counts with energies below 1 keV relative to counts with energies above 1 keV in each 2′′ pixel. As expected, the hardest emission (with ratios as low as 0.06) is associated with the plerion in the center, but hardness variations are clearly evident around the shell. In particular, soft emission is associated with the bright, high surface brightness emission throughout the west (ratios of 24), and to a lesser extent with the region just north of the plerion. The eastern part of the remnant is relatively much harder (ratios of about 0.5).
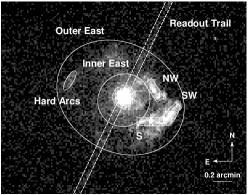
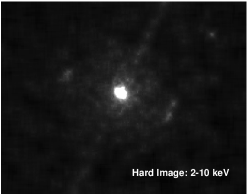
The right panel of Figure 2 shows the ACIS image for events with pulse heights corresponding to energies in excess of 2 keV. Two faint arcs are located roughly equidistant from the pulsar on opposite sides of the remnant; the east and west hard arcs contain 30 and 57 counts at energies above 2 keV, respectively. Both arcs lie at the outer boundary of the shell, with the brighter arc in the west being just south of the indentation. There are no obvious radio counterparts to these arcs.
3 Spectral Analysis
Approximately 15,000 counts were collected from the SNR in this observation, excluding the pulsar readout trail and a 7′′ radius region in the center enclosing both the pulsar nebula and the optically emitting oxygen ring. We carried out spectral fits at energies between 0.5 and 10 keV for different regions of the shell, shown in the middle panel of Figure 1. Our goal was to obtain measurements of the average temperature, ionization age, and element abundances for each region. The region eastward (to the left) of the readout trail was fitted as a single spectrum, labelled “Outer East”, while an annulus fitting inside this region was also fitted separately and labelled “Inner East”. There are 15002000 counts in the individual spectra, except for the large eastern regions, which contain 30004000 counts each.
The spectral response of the backside illuminated CCD chips is complicated, largely because of the strong position and temperature dependence of charge transfer inefficiency in the CCDs, with differences in the detector gain being most pronounced at the boundaries between readout nodes. For this reason, we positioned the source to fall entirely on an area of the focal plane read out by a single node. For spectral fitting, we use response matrices for the appropriate region of the detector based on calibration data from 2000 May for a CCD temperature of 110C, and effective areas from the 1999 September release.
At energies below 0.35 keV and above 7 keV, the instrument background dominates strongly for this source, while the local sky background towards the LMC is thermal and spatially varying. The ACIS image of the entire chip (not shown in the figures) reveals that SNR 0540-69.3 is located on what appears to be a large, faint, but coherent ring of thermal gas featuring prominent emission lines, particularly of Si. We tried local spectral backgrounds taken from various regions of the S3 chip and found that our spectral results are not particularly sensitive to the exact background used.
Our basic spectral model is a plane-parallel shock with a single electron temperature and a range of ionization ages from zero up to a fitted maximum value (in XSPEC v11.0, Borkowski et al. 2001). The ionization age parameterizes the time-dependent, nonequilibrium ionization of cold gas that has suddenly been heated to a high temperature by the passage of a shock wave, and is formally the product of the ambient electron density and the time since the gas was shocked; collisional ionization equilibrium corresponds to cm-3 s or higher. This model provides a simple, but fairly plausible characterization of the spectra of relatively small spatial regions.
The presence of emission lines of Mg (near 1.3 keV), Si (near 1.85 keV), and Fe (the L blend near 1 keV) in the spectra indicates that the X-ray emission from the shell has a significant thermal component (see Figure 3). The element abundances, if fitted freely, are characteristic of the overall element abundances in the LMC at roughly 0.3 times the solar value (Russell & Dopita 1992). The X-ray spectra of the shell are therefore consistent with the emission arising predominantly from shock heated ambient material (note that van der Heyden 2001 infer a roughly 23 times enhancement in the Ne and Fe abundance towards the southwest, but do not give errors). We therefore present results in Table 1 and Figure 3 for fits to a single shock component where the element abundances have been fixed at the LMC values (He=0.89, C=0.30, N=0.12, Fe=0.36, Russell & Dopita, 1992; O=0.19, Ne=0.29, Mg=0.32, Si=0.31, S=0.36, Ca=0.34, Hughes, Hayashi, & Koyama, 1998; given by number relative to H relative to the solar photospheric abundances of Anders & Grevesse 1989).
The fits give lower temperatures and higher ionization ages for the regions NW, SW, and S in the western part of the remnant than for regions in the eastern half. We did additional fits to allow for an additional underlying hard spectral component in the west by using either a thermal shock model with the temperature and ionization age fixed at their values for the Outer East, or a power-law with a fixed photon spectral index of 2.7; these results are also shown in Table 1. The fitted temperatures for NW and S are not affected, but the temperature for SW and the Hard Arcs, which had been somewhat higher than in the other western regions for the single component fits, are reduced significantly. Ionization ages in all regions tend to be higher than their values for only one spectral component. The actual statistical significance of adding the hard spectral components is low, but the results demonstrate how the spectral complexity can affect the interpretation of the fitting results. The relative contribution of the hard component is indicated by the fractional detected flux given in the table. This is the ratio of the detected flux in the the hard component, i.e., either the 5 keV shock or the power-law, relative to the total detected flux at energies 0.510 keV. This fractional flux is 34 times higher in the Hard Arcs than in any other region.
One puzzle is that the fitted column densities for the spectrally soft regions in the west are between cm-2, roughly a factor of two lower than in the east. Because of the complicated low energy response of ACIS, we are not yet able to ascertain whether this difference indicates a true variation in the obscuring column. If the column density is fixed at cm -2, closer to the value found in the east, the fits are slightly worse, with the reduced increasing by up to 0.3. The only significant change in the fitted temperatures is the 40% change in the SW; the best-fit ionization ages all tend to decrease by up to a factor of two (see the Table).
4 Discussion
Because the X-ray spectrum of the shell of SNR 0540-69.3 is evidently dominated by emission from ambient material swept up by the forward shock, we estimate evolutionary parameters assuming that the remnant shell is in the adiabatic phase. We fitted a Sedov model to the spectrum of just the eastern half of the remnant to avoid the complications in the west. The fit yields parameters listed at the bottom of Table 1. The average radius in the east is 30′′ measured from the position of the pulsar, yielding a physical radius of 7 pc for an assumed distance of 50 kpc to the LMC. Based on this radius and the measured temperature ( = 4.1 keV) and ionization age ( = 3.7 cm-3 s), the energy of the explosion is 2 ergs, the ambient H density is 0.8 cm-3, and the swept-up mass is 40 M⊙. The deduced age of the remnant is 1500 yr, which is consistent with the pulsar spin-down age = 1660 yr (Seward, Harnden, & Helfand 1984). Seward & Harnden (1994) deduced similar parameters for the remnant using its extent in the ROSAT HRI image, having assumed an explosion energy of 2 ergs and an age close to the characteristic pulsar age.
The Sedov age is considerably higher than the age of 8001000 yr given by Reynolds (1985). The true age could be lower than suggested by the Sedov analysis if the remnant is actually still in transition from the free-expansion phase. For an age of 1000 year and a radius of 7 pc, the average expansion velocity must have been about 7000 km/s, implying a mean post-shock temperature of 50 keV that is much higher than the 5 keV electron temperature actually measured in the east. A low electron temperature may be expected if the electrons are not significantly heated by collisionless processes behind the shock, and are instead equilibrating slowly by Coulomb collisions with the ions. A low level of collisionless heating would be consistent with the relatively high shock speed, as there appears to be an inverse correlation between Mach number and the efficiency of collisionless heating (Laming 1998, Ghavamian et al. 2001). Another possibility is that particle acceleration at the shock is nonlinear and highly efficient (Decourchelle et al. 2000), deflecting energy from the thermal gas; this could be tested with a proper motion measurement of the current shock velocity, and deeper spectral observations (see Hughes et al. 2000).
A tantalizing suggestion of a possible nonthermal X-ray emission component in SNR 0540-69.3 is provided by the hard arcs shown in Figure 2. In the best fitting model for the combined arcs (which includes a power-law component), nearly half of the X-ray flux can be attributed to a nonthermal component: the corresponding unabsorbed 0.5-10 keV luminosity in the power-law is several times ergs/s (for a distance to the LMC of 50 kpc), which is comparable to the integrated nonthermal X-ray luminosity of SN 1006 (Dyer et al. 2001, computed for a distance of 1.8 kpc to SN 1006 taken from Laming et al. 1996). A nonthermal luminosity of this magnitude, together with the bipolar X-ray symmetry of the arcs, suggests that electrons are being accelerated to X-ray emitting energies behind the shock in SNR 0540-69.3 in a manner similar to that in SN1006.
Compared to the XMM-Newton results of van der Heyden et al. (2001), we obtain a similar temperature of 0.6 keV for the regions in the west, but our fitted ionization ages are generally higher by factors of a few to ten. Their fitted ionization age is closer to the typical value that we measure for the hard emission in the east. The spectral parameters measured by the XMM RGS should be robust, as they are determined by the measured intensities of individually detected O VII and O VIII emission lines, whereas those determined by Chandra are driven by the shape of the (relatively weak) Fe L emission; however, the XMM gratings suffer from the blending of emission from different regions of the remnant, for which we have shown that there are strong variations in the spectrum. The discrepancy in may therefore stem in part from this blending, and should be investigated with deeper observations by both instruments. The blueshifts detected by XMM in the O VIII lines are difficult to confirm in our data, as the line emission overall is weak and we can neither directly identify nor isolate the oxygen lines; indeed, we do not observe strong oxygen lines even the central region of the remnant that contains both the plerion and the optical ring (Petre et al. 2001). The fits to the SW region are slightly improved if the gains are adjusted to mimic the Doppler shifts, but fits to the other regions are not improved by the gain shift; in any case, the fitted parameter values are essentially unchanged.
Very little of the X-ray emitting gas located between radii of 7 and 30′′ appears to be enriched with supernova ejecta, since our spectra are well-fitted using element abundances appropriate for the LMC. The ring of optically emitting oxygen ejecta is located very close to the center of the remnant, but this is not likely to be associated with the reverse shock, which is not expected to be so close to the remnant center for some 10,000 yr (Reynolds & Chevalier 1984). As mentioned earlier, the optically emitting ring is believed to be associated with a shock driven into the inner ejecta by the expanding synchrotron nebula, as is the case in the Crab (Reynolds 1985). The reverse shock should be located relatively close behind the blast wave for a remnant of 0540-69.3’s age, but its presence is not evident in our data. The reverse shock might not be well-defined if the ambient medium has a very low density, but our inferred densities of 1 cm-3 are not particularly low. Perhaps the remnant has encountered relatively dense ambient material only relatively recently so that the reverse shock has not yet had time to develop strongly. A significant synchrotron component present throughout the shell could reduce the apparent line equivalent widths and lead us to infer element abundances that were too low, but then the good agreement with LMC abundances would have to be attributed to a strong coincidence.
The western region is clearly more complex than the east. The boundary of the shell at the western indentation is sharper and better-defined than elsewhere in the remnant, and it is the brightest part of the shell at both X-ray and radio wavelengths. It is also the only location on the shell where optical [OIII] emission has been detected, and XMM-Newton, with its higher spectral resolution and better sensitivity at low energies, detects X-ray OVIII emission both from this southwestern region and from the central regions, which presumably correspond to the optical [OIII] ring (van der Heyden et al. 2001). Overall, temperatures in the western region are significantly lower than in the east, and ionization ages correspondingly higher (in the SW region, the differences are less marked, but the hard arcs shown in Figure 2 overlap this region, and it is possible that they are influencing the spectral fits). The emission measures indicate that the densities in the west are significantly higher than in the east by roughly a factor of ten, and this is further supported by the higher ionization ages in the west. An approximate pressure balance is broadly suggested in that regions with lower temperatures generally have higher ionization ages, but this does not appear to be borne out by a detailed examination of the fitted parameters. We are hesitant to assign too much significance to the exact numerical values from our fits, however, as they based on rather simplified models for data that are complex, but limited in photon statistics. We instead prefer to state that the correlation of spectral softness with high surface brightness and the pronounced indentation are qualitatively consistent with the interaction of the blast wave with a much denser environment in the west.
The source of denser material in the west is difficult to ascertain, however. Cohen et al. (1988) show that a CO cloud is located to the west of the remnant, but their map has a rather coarse spatial scale of 8.8′, and it is not clear that the cloud is close enough for the remnant to be interacting with it. The highest resolution HI map available (Kim et al. 1999) has a 1′ resolution comparable to the size of the remnant, but does show that the region surrounding SNR 0540-69.3 has a rich HI structure.
We mention, in closing, that an alternative explanation of the enhanced radio emission in the western part of the remnant is that energy is injected by the pulsar in two oppositely directed jets (Manchester et al. 1993). Though the radio data show a knot of emission located opposite the bright indentation in the west, this knot is not bright in X-rays. The hard X-ray arcs might be conjectured to be associated with some process involving jets from the pulsar, but they probably cannot explain the brightness enhancement: the arcs appear to be localized to a rather small area, and there is no comparable brightness enhancement associated with the eastern arc. Moreover, Gotthelf & Wang (2000) suggest that there is a hint of a jet-like feature near the pulsar, and that it is oriented perpendicular to the arcs so that the overall X-ray morphology of the pulsar nebula is similar to that of the Crab nebula.
In summary, our spatially resolved observations with the Chandra Observatory have revealed strong variations in temperature and ionization age around the X-ray emitting shell of SNR 0540-69.3. These variations appear to be related to the interaction of the forward shock with its nonuniform surroundings. The element abundances are consistent with the mean for the LMC, indicating that we are primarily observing interstellar material heated by the forward shock. The question of why we have not yet observed the emission from the reverse-shocked ejecta remains to be answered. Spectral imaging at energies above 2 keV have revealed two arcs of emission that are suggestive of nonthermal emission from shock acceleration. Their true nature remains veiled, however, until they can be studied further with deeper observations.
References
- (1) Anders, E., & Grevesse, N. 1998, Geochimica et Cosmochimica Acta, 53, 197
- (2) Borkowski, K. J., Lyerly, W. J., & Reynolds, S. P. 2001, ApJ, 548, 820
- (3) Caraveo, P. A., Bignami, G. F., Mereghetti, S., & Mombelli, M. 1992, ApJL, 395, L103
- (4) Chanan, G. A., Helfand, D. J., & Reynolds, S. P. 1984, ApJ, 287, L23
- (5) Clark, D. H., Tuohy, I. R., Dopita, M. A., Mathewson, D. S., Long, K. S., Szymkowiak, A. E., & Culhane, J. L. 1982, ApJ, 255, 440
- (6) Cohen, R. S., Dame, T. M., Montani, J., Rubio, M., & Thaddeus, P. 1988, ApJ, 331, L95
- (7) Decourchelle, A., Ellison, D. C., & Ballet, J. 2000, ApJL, 543, L57
- (8) Dyer, K. K., Reynolds, S. P., Borkowski, K. J., Allen, G. E., & Petre, R. 2001, ApJ, in press, astro-ph/0010424
- (9) Ghavamian, P., Raymond, J., Smith, R. C., Hartigan, P. 2001, ApJ, 547, 995
- (10) Gotthelf, E. V., & Wang, Q. D. 2000, ApJL, 532, L117
- (11) Hester, J. J., et al. 1996, ApJ, 456, 225
- (12) Hughes, J. P., Hayashi, I., & Koyama, K. 1998, ApJ, 505, 732
- (13) Hughes, J. P., Rakowski, C. E., & Decourchelle, A. 2000, ApJ, 543, L61
- (14) Kaaret, P., et al. 2001, ApJ, 546, 1159
- (15) Kim, S., Staveley-Smith, L., Dopita, M. A., Freeman, K. C., Sault, R. J., Kesteven, M. J., & McConnell, D. 1998, ApJ 503, 729
- (16) Kirshner, R. P., Morse, J. A., Winkler, P. F., & Blair, W. P. 1989, ApJ, 342, 260
- (17) Laming, J. M. 1998, ApJ, 499, 309
- (18) Laming, J. M., Raymond, J. C., McLaughlin, B. M., & Blair, W. P. 1996, ApJ, 472, 267
- (19) Manchester, R. N., Staveley-Smith, L., & Kesteven, M. J. 1993, ApJ, 411, 756
- (20) Mathewson, D. S., Dopita, M. A., Tuohy, I. R., & Ford, V. L. 1980, ApJ, 242, L73
- (21) Reynolds, S. P. 1985, ApJ, 291, 152
- (22) Reynolds, S. P., & Chevalier, R. A. 1984, ApJ, 278, 630
- (23) Russell, S. C., & Dopita, M. A. 1992, ApJ, 384, 508
- (24) Seward, F. D., & Harnden, F. R. 1994, ApJ, 421, 581
- (25) Seward, F. D., Harnden, F. R., & Helfand, D. J. 1984, ApJ, 287, L19
- (26) van der Heyden, K. J., Paerels, F., Cottam, J., Kaastra, J. S., & Branduardi-Raymont, G. 2001, A&A, 365, L254
- (27) Weisskopf, M., et al. 2000, ApJL, 536, L81
| Region | ( cm-2) | (keV) | (1010 cm-3 s)b | Fractional Hard Fluxc | |
|---|---|---|---|---|---|
| NEI Single-Temperature Plane Parallel Shock | |||||
| Outer East | 179.2, 1.6 | 0.50 (0.470.52) | 4.8 (3.86.3) | 1.5 (1.31.7) | … |
| Inner East | 171.2, 1.7 | 0.39 (0.370.41) | 5.5 (4.47.0) | 1.9 (1.72.2) | … |
| Hard Arcs | 73.6, 1.25 | 0.41 (0.360.43) | 2.1 (1.63.0) | 1.2 (1.01.5) | … |
| NW | 103.7, 2.1 | 0.33 (0.300.40) | 0.64 (0.590.78) | 28 (1155) | … |
| S | 72.6, 1.25 | 0.24 (0.180.28) | 0.62 (0.590.66) | 39 (2764) | … |
| SW | 114.5, 1.7 | 0.26 (0.230.30) | 1.33 (1.121.57) | 3.6 (2.84.9) | … |
| NW | 107.6, 2.2 | 0.50 (fixed) | 0.77 (0.640.88) | 3.6 (2.48.1) | … |
| S | 108.9, 1.8 | 0.50 (fixed) | 0.47 (0.420.52) | 13 (7.121) | … |
| SW | 167.3, 2.5 | 0.50 (fixed) | 0.60 (0.550.65) | 1.9 (1.62.4) | … |
| NW | 104.8, 2.1 | 0.40 (fixed) | 0.65 (0.580.84) | 19 (7.333) | … |
| S | 92.3, 1.6 | 0.40 (fixed) | 0.55 (0.500.60) | 18 (1127) | … |
| SW | 138.0, 2.0 | 0.40 (fixed) | 0.89 (0.811.0) | 2.1 (1.82.7) | … |
| Two Shock Components: Fixed component with =5.0 keV, cm-3 s | |||||
| Hard Arcs | 69.3, 1.2 | 0.43 (0.390.48) | 1.05 (0.63-1.80) | 1.14 (0.941.67) | 0.45 |
| NW | 80.2, 1.7 | 0.29 (0.240.36) | 0.60 (0.550.64) | 97 ( 40) | 0.26 |
| S | 64.5, 1.1 | 0.21 (0.180.26) | 0.60 (0.570.63) | 81 (41212) | 0.18 |
| SW | 108.9, 1.65 | 0.25 (0.210.28) | 0.73 (0.681.03) | 13 (5.826) | 0.32 |
| NW | 85.7, 1.75 | 0.40 (fixed) | 0.54 (0.490.61) | 37 (2267) | 0.19 |
| S | 89.3, 1.5 | 0.40 (fixed) | 0.50 (0.460.54) | 23 (1439) | 0.09 |
| SW | 125.0, 1.9 | 0.40 (fixed) | 0.56 (0.450.69) | 4.4 (3.08.5) | 0.20 |
| Shock + Power-Law with = 2.7 | |||||
| Hard Arcs | 64.7, 1.1 | 0.46 (0.380.50) | 0.42 (0.350.57) | 7.3 (3.219) | 0.40 |
| NW | 77.4, 1.6 | 0.28 (0.240.33) | 0.60 (0.550.64) | 52 (21112) | 0.16 |
| S | 70.9, 1.2 | 0.23 (0.190.26) | 0.62 (0.580.63) | 42 (2866) | 0.04 |
| SW | 113.1, 1.7 | 0.27 (0.240.32) | 0.88 (0.671.49) | 6.1(3.211) | 0.10 |
| Sedov | |||||
| Outer East | 177.4, 1.6 | 0.50 (0.470.52) | 4.1 (3.45.7) | 3.7 (3.34.4) | … |