Nuclear Components in the Bulges of Disk Galaxies
Abstract
By combining surface brightness profiles from images taken in the HST/NICMOS F160W and ground-based (GB) bands, we have obtained NIR profiles for a well studied sample of inclined disk galaxies, spanning radial ranges from 20 pc to a few kpc. We fit PSF-convolved Sersic-plus-exponential laws to the profiles, and compare the results with the fits to the ground-based data alone. HST profiles show light excesses over the best-fit Sersic law in the inner 1 arcsec. This is often as a result of inner power-law cusps similar to the inner profiles of intermediate-luminosity elliptical galaxies.
Instituto de Astrofísica de Canarias, 38200 La Laguna, Tenerife, Spain
School of Physics and Astronomy, University of Nottingham, University Park, Nottingham, NG7 2RD, UK
1. Introduction
The nuclear density profile of galaxies is a key tracer of galaxy formation processes such as dissipation and merging. Ellipticals may be divided in two groups according to this profile: luminous galaxies with shallow profiles and fainter galaxies with featureless powerlaws (Faber et al. 1997). Here we discuss HST profiles of a representative, well-studied sample of galaxy bulges.
Previous work (Andredakis, Peletier, & Balcells 1995) used ground-based (GB) -band imaging from UKIRT. The surface brightness profiles of bulges were found to be well described with a family of exponential power-law profiles given by Sersic’s (1968) law:
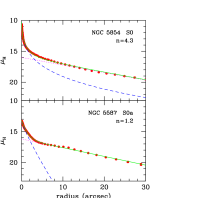
with (Caon, Capaccioli, & d’Onofrio 1993). is the effective radius enclosing half the light, is the intensity at , and is the shape index of the profile. Figure 1a shows examples of Sersic profiles, including the exponential (=1) and de Vaucouleurs (=4) profiles. Figure 1b shows examples of Sersic fits to two bulge profiles. Andredakis et al. (1995; see also Graham 2001) found that the shape index correlates with the morphological type, or bulge-to-disk ratio: early-types show de Vaucouleurs () profiles. Late-types show exponential () profiles.
The goal of this work is to extend the analysis inward toward the galaxy nucleus, using a combination of HST and ground based imaging to obtain surface brightness profiles ranging from 20 pc to a few kpc. We perform PSF-convolved Sersic + exponential fits and describe the behaviour of the profiles in the inner few hundred parsec.

We work with 19 galaxies extracted from the Balcells & Peletier (1994) sample of inclined disk galaxies. For these galaxies, we have obtained HST/WFPC2 and HST/NICMOS images. Other analysis of this sample may be found in Peletier & Balcells (1996), Peletier et al. (1999), Falcón-Barroso, Peletier, & Balcells (2001). A downloadable database of GB images and profiles for the complete Balcells & Peletier (1994) sample may be found in Peletier & Balcells (1997).
2. Linking HST to Ground-based data
We analyze the HST/NICMOS F160W NIC2 images (19”19”, 0.075 “/pixel) with galphot (Jørgensen, Franx, & Kjærgaard 1992) and extract elliptically-averaged surface brightness profiles. These are converted to band magnitudes. We then use the elliptically-averaged -band surface brightness profiles derived from UKIRT/NICMOS3 images (75”75”, 0.291”/pixel) published by Peletier & Balcells (1997), which we transform to band using the relation (Leitherer et al. 1996) and using profiles from Peletier & Balcells (1997). We then correct the GB profiles from any residual offset using the range . The combined HST plus GB profiles are fit with a Sersic bulge plus exponential disk by least-squares minimization.
3. Inner light profile excesses
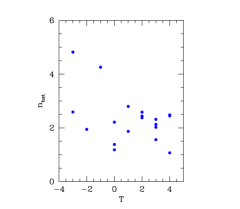
The distribution of shape indices vs morphological type T is shown in Figure 1c. Albeit with poor statistics, we reproduce the well-known result that shape indices reach higher values in early-type galaxies (Andredakis et al. 1995; Graham 2001). Intermediate-type galaxies have , ie. the bulges of these galaxies do not follow the de Vaucouleurs law. These values of are systematically higher than those obtained from the fits to the ground-based data alone.


Why is that? Because the bulge light profiles, when seen with HST spatial resolution, show central light excesses which force the Sersic fit to a higher . The fits show deviations in the outer parts. We show the prevalence of excesses with respect to the Sersic profile by plotting residuals with respect to the fits performed over a radial range that excludes the central 0.5” (Fig. 2a). For 58 11% of the sample, we find central light excesses. 21 9% show central depressions. 21% follow the Sersic profile over the entire radial range. The presence of light excess does not correlate with morphological type in the present data set.
We conclude that the Sersic law cannot provide a full description of the surface brightness profiles of bulges from 20pc out to a few kpc. Other functional forms are required. We have investigated Nuker profiles (Faber et al. 1997).
4. Inner power-law cusps: Nuker slopes
Figure 2b shows the bulge surface brightness profiles for radii . This is the radial range not available to ground-based observations and revealed by the HST/NICMOS imaging. Profiles are well fitted by power laws in this radial range. We measure the power law slope index , from the relation . Gamma values are given next to each profile. We obtain values that scatter around . Only one in 19 profiles has a flat-profile ”core”, given by a low . The observed range is comparable to that obtained for intermediate luminosity ellipticals and lenticulars by Nuker fits to HST data (Faber et al. 1997). The power-law profiles continue to rise inward at the limit of HST resolution, r=0.1”. The value of does not correlate with morphological type for the present sample. The regions inside 1” are typically very reddened, implying substantial dust obscuration (Peletier et al. 1999). The central stellar surface brightness may therefore rise even more than represented in the present profiles.
5. Conclusions
(1) When fitting Sersic laws to HST plus ground-based bulge profiles, the shape indices are higher than those obtained from fits to the GB data alone. The correlation of vs T found for GB data remains valid. (2) The NIR inner surface brightness profiles of bulges show power-law cusps that continue to rise at the limit of the HST resolution, and have slopes comparable to those of moderate luminosity ellipticals ().
References
Andredakis, Y. C., Peletier, R. F., & Balcells, M. 1995, MNRAS, 275, 874
Balcells, M. & Peletier, R. F. 1994, AJ, 107, 135
Caon, N., Capaccioli, M., D’Onofrio, M., 1993, MNRAS, 265, 1013
Falcón-Barroso, J., Peletier, R. F., Balcells, M. 2001, MNRAS, submitted
Graham, A. W. 2001, AJ, 121, 820
Faber, S. M. et al. 1997, AJ, 114, 1771
Jørgensen, I., Franx, M. & Kjærgaard, P. 1992, A&AS, 95, 489
Leitherer, C. et al. 1996, PASP, 108, 996
Peletier, R. F. & Balcells, M. 1996, AJ, 111, 2238
Peletier, R. F. & Balcells, M. 1997, New Astronomy, 1(4), 349
Peletier, R. F., Balcells, M., Davies, R. L., Andredakis, Y., Vazdekis, A., Burkert, A., & Prada, F. 1999, MNRAS, 310, 703
Sersic, J. L. 1968, Atlas de Galaxias Australes (Córdoba:Observatorio Astronómico)