Radio Observations of Infrared Luminous High Redshift QSOs
Abstract
We present Very Large Array (VLA) observations at 1.4 GHz and 5 GHz of a sample of 12 Quasi-stellar Objects (QSOs) at . The sources were selected as the brightest sources at 250 GHz from the recent survey of Omont et al. (2001). We detect seven sources at 1.4 GHz with flux densities, . These centimeter (cm) wavelength observations imply that the millimeter (mm) emission is most likely thermal dust emission. The radio-through-optical spectral energy distributions for these sources are within the broad range defined by lower redshift, lower optical luminosity QSOs. For two sources the radio continuum luminosities and morphologies indicate steep spectrum, radio loud emission from a jet-driven radio source. For the remaining 10 sources the 1.4 GHz flux densities, or limits, are consistent with those expected for active star forming galaxies. If the radio emission is powered by star formation in these systems, then the implied star formation rates are of order 103 M⊙ year-1. We discuss the angular sizes and spatial distributions of the radio emitting regions, and we consider briefly these results in the context of co-eval black hole and stellar bulge formation in galaxies.
1 Introduction
Recent study of the dynamics of gas and stars in the nuclear regions of nearby galaxies has led to two remarkable discoveries: (i) the overwhelming majority of spheroidal galaxies in the nearby universe contain massive black holes ( Tanaka et al. 1995; Miyoshi et al. 1996; Richstone et al. 1998; Ghez et al. 1998; van der Marel 1999; Genzel et al. 2000; Kormendy and Ho 2000), and (ii) there is a clear correlation between the black hole mass and the velocity dispersion of the stars in the spheroid (Gebhardt et al. 2000, Ferrarese & Merritt 2000). This latter correlation suggests a ‘causal connection between the formation and evolution of the black hole and the bulge’ (Gebhardt et al. 2000), meaning that black holes may be a fundamental component of galaxies, and not simply exotica giving rise to AGN phenomenon (Richstone et al. 1998). A possible explanation for this correlation is that massive black hole and spheroid formation are co-eval, occurring during the collapse of a galaxy from the primordial density field. Such a model is motivated by the fact that the correlation of black mass with velocity dispersion is significantly tighter than that with spheroid luminosity, implying that systems with greater dissipation during collapse, ie. high surface brightness, compact spheroids with high velocity dispersion, form larger black holes.
Possible supporting evidence for co-eval starbursts and AGN at high redshift is the detection of copious emission from warm dust in high redshift QSOs (McMahon et al. 1994; Omont et al. 1996a; Andreani et al. 1999; Carilli et al. 2000; Omont et al. 2001; Carilli et al. 2001a; Isaak et al. 2001). Searches with mJy sensitivity at 250 GHz have yielded detections of 41 QSOs at , out of a total of 147 sources observed. The implied Far Infrared (FIR) luminosities are of order L⊙ with implied dust masses of a M⊙. Follow-up observations of three of these dust-emitting QSOs revealed CO emission as well, with implied molecular gas masses of a M⊙ (Guilloteau et al. 1997, 1999; Ohta et al. 1996; Omont et al. 1996b; Carilli, Menten, & Yun 1999). Omont et al. (2001) argue that the dominant dust heating mechanism may be star formation based on the two simple points: (i) star formation is inevitable given the large dust and gas masses, and (ii) star formation is required to produce the large dust masses. The implied star formation rates are so extreme, 103 M⊙ year-1, that a significant fraction of the stars in the QSO host galaxy can be formed on galaxian dynamical timescales. Alternatively, Sanders et al. (1989) argue that radiation from the AGN is the dominant dust heating mechanism, since in most cases it requires the absorption of only a small fraction () of the AGN UV luminosity.
A possible means of addressing the question of dust heating by star formation vs. AGN radiation is through radio observations. Star forming galaxies at low redshift follow a very tight, linear correlation between radio continuum and FIR luminosity (Condon 1992). This correlation holds over four orders of magnitude in luminosity with only a factor two scatter around linearity for galaxy samples selected in the optical, IR, and radio. A general correlation between synchrotron radiation at cm wavelengths and thermal dust emission at IR wavelengths is expected, since both relate to massive star formation, however the tightness and linearity of the correlation remain puzzling. If this correlation holds to high redshift (Carilli and Yun 1999, 2000; Yun et al. 2000), then comparing cm and mm continuum luminosities is a possible diagnostic of star formation.
In this paper we present VLA observations at 1.4 GHz and 5 GHz of a sample of high redshift QSOs from the Digitized Palomar Sky Survey (PSS; Kennefick et al. 1995 a, b; Djorgovski et al. 1999) and the Automatic Plate Measurement survey (APM; Storrie-Lombardi et al. 1996). The sources were selected as the brightest sources at 250 GHz from the recent survey of Omont et al. (2001). These radio observations are more sensitive than previous radio studies of high redshift QSOs (Schmidt et al. 1995b; Stern et al. 2000), and in particular, probe to levels that could indicate star formation, as dictated by the radio-to-FIR correlation. We also consider the radio continuum morphologies and spectral indices in this regard. We assume km s-1 Mpc-1, , and we define the spectral index, , as a function of frequency, , as: .
2 Observations
Our sample consisted of the 12 strongest sources detected at 250 GHz by Omont et al. (2001). The sources are listed in Table 1, and their positions are given in Omont et al. (2001). For most of the sources the 1.4 GHz VLA observations were made in the A (30 km) configuration in December 2000 using a total bandwidth of 100 MHz with two orthogonal polarizations. Each source was observed for 2 hours. For three of the sources (B1117–1329, B1144–0723, J1646+5514) observations were made in the B (10 km) configuration in April 2001.
Standard phase and amplitude calibration was applied, as well as self-calibration using background sources in the telescope beam. The absolute flux density scale was set using observations of 3C 286. The final images were generated using the wide field imaging and deconvolution capabilities of the AIPS task IMAGR. The theoretical rms noise () value is between 15 and 25 Jy beam-1, depending on the range of telescope elevations over which the source was observed, and for most of the sources the measured noise values are in this range. For two sources (J1253-0228 and B1144–0723) the noise level is significantly higher due to side-lobe confusion by bright sources within the primary beam of the telescope. The Gaussian restoring CLEAN beam Full Width at Half Maximum (FWHM) was typically 1.5′′ for the A configuration observations, and (major axis position angle = ) for the B configuration observations of B1117–1329 and B1144–0723. The source J1646+5514 was observed at low elevation, leading to a highly elongated beam (FWHM = , with a major axis position angle of 52o), and a higher noise level due to ground pick-up. One source, J1057+4555, was detected as part of the FIRST survey (Becker, White, & Helfand 1995; Stern et al. 2000). We re-observed this source, and obtained the same flux density to within 6.
We observed the four brightest sources detected at 1.4 GHz (J1048+4407, J1057+4555, J1347+4956, J2322+1944) with the VLA at 5 GHz in January 2001 in the A configuration. Each source was observed for 1 hour, resulting in rms noise values between 25 and 35 Jy. Standard calibration and imaging was performed, using 3C 286 as the absolute flux calibrator. The FWHM of the Gaussian restoring beams were about 0.5′′. The 5 GHz images were then convolved to the resolution of the 1.4 GHz images to determine spectral indices.
3 Results
Table 1 lists the results for the 12 sources observed with the VLA. Column 3 gives the 250 GHz flux densities, column 4 gives the integrated 1.4 GHz flux densities, and Column 5 gives the 350 GHz flux densities from Isaak et al. (2001). The MB in Column 6 are values are from Isaak et al. (2001) and McMahon et al. (1999).
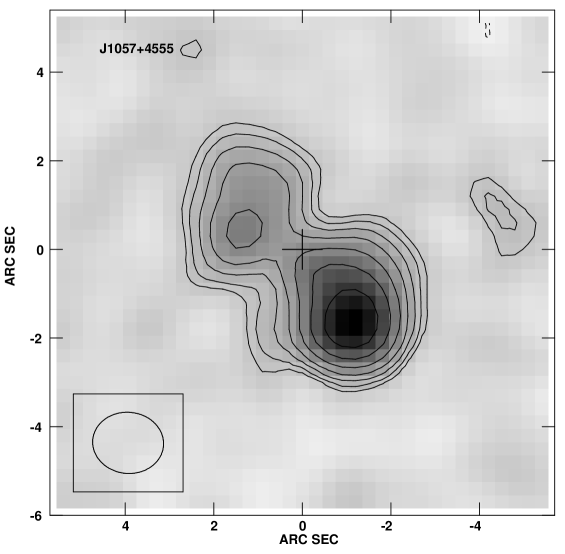
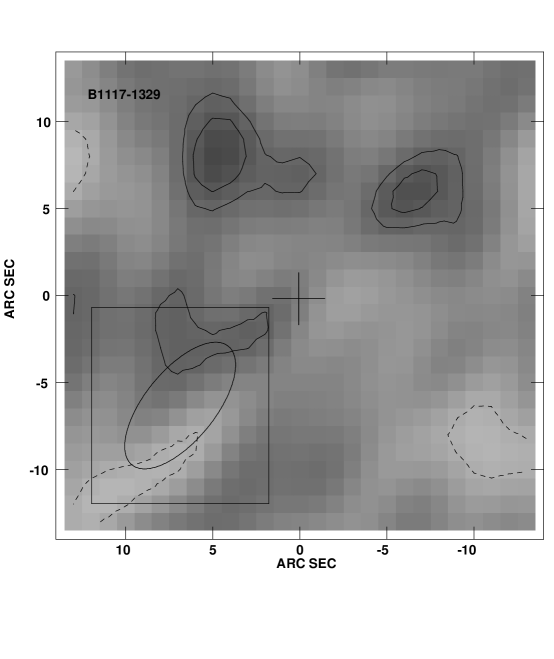
The 1.4 GHz images of these sources are shown in Figure 1. The positional uncertainty for the radio observations is given by: (Fomalont 1998), where FWHM corresponds to that of the Gaussian restoring beam, and SNR = Signal-to-Noise ratio of the detection. For a detection this corresponds to for most of our sources, except the three sources that were observed in the B array, for which the positional uncertainty is increased by about a factor three. To this must be added (in quadrature) the positional uncertainty in the optical, for which an rms accuracy of about 0.5′′ has been estimated (McMahon priv comm), and the uncertainty in the relationship between radio and optical reference frames, which is about (Stone 1994). Overall, we consider a reasonable detection as a source with a flux density within 0.7′′ of the optical QSO position. These sources are marked with a ‘d’ in Column 4 of Table 1. Faint radio source counts at 1.4 GHz imply that the chance probability of detecting a 50Jy source within 0.7′′ of a given QSO position is (Richards 2000).
3.1 Results on Individual Sources
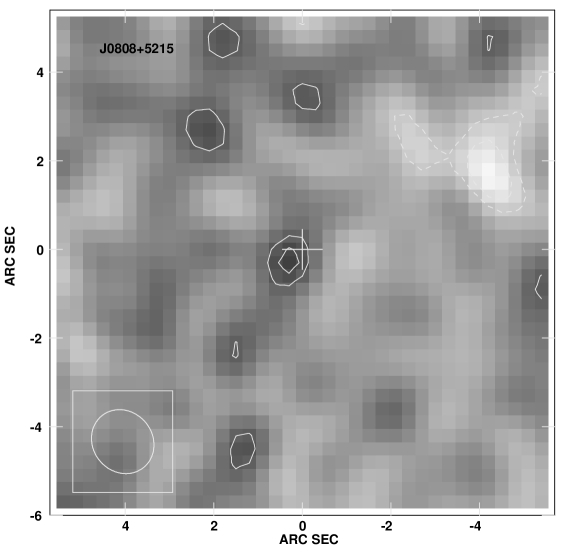
PSS J0808+5215 A radio continuum source with S1.4 = 5818 Jy is detected at (J2000) , within 0.3′′ of the optical QSO position. The optical spectrum of this source is not yet published.
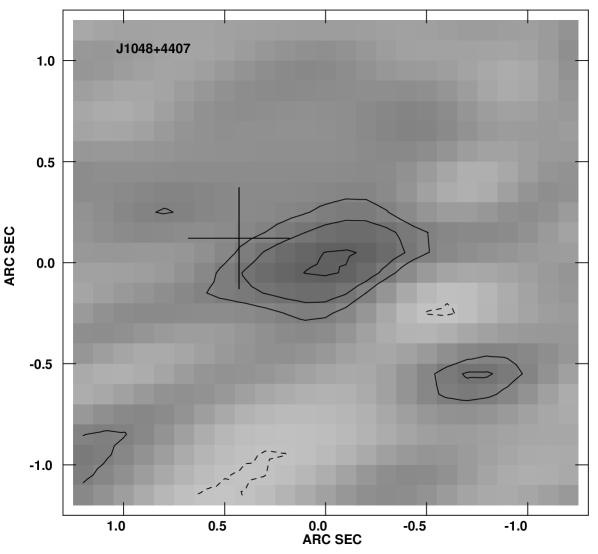
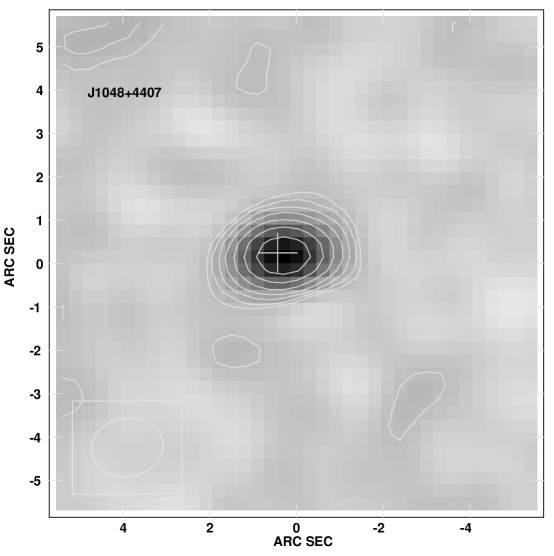
PSS J1048+4407 This source is clearly detected at 1.4 GHz. The position of the radio continuum peak is (J2000) . Gaussian fitting to the radio emission sets an upper limit to the source size of 1.1′′ at 1.4 GHz. The 5 GHz image of this source is shown in Figure 2. The source is also detected at 5 GHz, with a total flux density of 17937 Jy, as determined from images convolved to the resolution at 1.4 GHz, and the position of the 5 GHz source at this resolution is within 0.2′′ of that determined at 1.4 GHz. The spectral index between 1.4 and 5 GHz is –0.70. The resolution 5 GHz image suggests a resolved source with a peak surface brightness of 105Jy beam-1. Interestingly, this peak is located 0.4′′ west of the optical QSO position. We feel it likely that this source is a radio jet source, and that the resolution 5 GHz image reveals a radio hot spot, however, more sensitive, high resolution images are clearly required. The optical spectrum shows that source this is a broad absorption line quasar (Peroux et al. 2001)
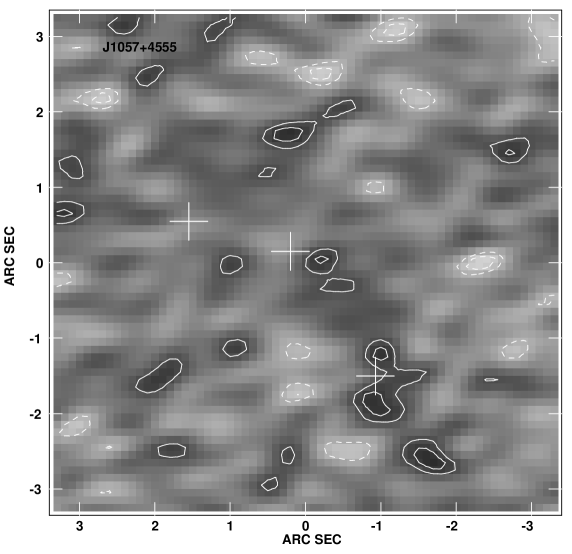
PSS J1057+4555 This source is clearly detected at 1.4 GHz, and the radio morphology reveals a double lobed source, roughly symmetric about the optical QSO position, with a total extent of about 4′′. The resolution 5 GHz image of this source is shown in Figure 2. No flat spectrum radio nucleus is detected, and only faint, diffuse radio emission is detected in the vicinity of the brighter (southwestern) radio lobe. Convolving to the 1.4 GHz resolution results in a spectral index for the southern lobe of –0.92, and a (2) upper limit to the spectral index of the northern lobe of –0.5. The optical spectrum published by Peroux et al. (2001) shows this to be a normal emission line quasar.
APM BR B1117–1329 This source is not detected in the B configuration observations with a 3 upper limit of SJy. The optical spectrum shows this source to be a broad absorption line quasar (Storrie-Lombardi et al. 1996)
APM BR B1144–0723 This source is not detected in the B configuration observations with a 3 upper limit of SJy. The optical spectrum shows this source to be a broad absorption line quasar (Storrie-Lombardi et al. 1996).
PSS J1248+3110 A source with S1.4 = 71 Jy is detected at (J2000) , , 0.8′′ south of the optical QSO position. Based on the faint radio source counts in Richards (2000), the probability of detecting a 71Jy source at 1.4 GHz within 0.8′′ radius of a given QSO position by chance is . Also, given that this is close to a 5 detection, the probability that it is simply a noise feature is comparably small. We feel it likely that this radio source is real, and somehow associated with the QSO. Taking into consideration the positional uncertainties in the radio and optical (see section 3), the positional offset between the radio source and the optical QSO is significant at only the level. In the analysis below, we consider the radio emission to be from the QSO itself, although it remains possible that we are seeing radio emission from a companion galaxy. Gaussian fitting to the radio emission sets an upper limit to the source size of 1.8′′ at 1.4 GHz. The optical spectrum of this source is not yet published.
PSS J1253–0228 This source was not detected at 1.4 GHz, although the noise in this image is a factor 2.5 higher than for most of the other sources, such that the 3 upper limit is SJy. The optical spectrum published by (Peroux et al. 2001) shows this to be a normal emission line quasar.
PSS J1347+4956 This source is clearly detected with SJy at (J2000) , within 0.3′′ of the optical QSO position. A Gaussian fit results in a marginally resolved source with a deconvolved FWHM , with a comparable uncertainty. The source is not detected on a 5 GHz image with an rms noise of 32Jy at 0.5′′ resolution. The optical spectrum of this source is not yet published.
PSS J1418+4449 A radio continuum source with SJy is detected at (J2000) , within 0.2′′ of the optical QSO position. The optical spectrum of this source is not yet published.
PSS J1554+1835 This source was not detected at 1.4 GHz, with a 3 upper limit of SJy. The optical spectrum of this source is not yet published.
PSS J1646+5514 This source is not detected at 1.4 GHz, with a 3 upper limit of SJy. The optical spectrum of this source is not yet published.
PSS J2322+1944 This source has the highest S250 in the recent survey of Omont et al. (2001). It is clearly detected at 1.4 GHz with at total flux density of Jy, and a peak surface brightness of Jy beam-1 at (J2000) , within 0.1′′ of the optical QSO position. The source is spatially resolved, with a nominal FWHM = 1.5′′ derived from Gaussian fitting. At 5 GHz the source is not detected at full resolution with an rms noise of 30Jy. Convolving to the resolution of the 1.4 GHz image, we can set a 2 lower limit to the spectral index between 1.4 and 5 GHz of –0.1. The optical spectrum of this source is not yet published.
4 Analysis
An important question which these radio observations address is whether the 250 GHz emission is synchrotron radiation, ie. a radio loud AGN component, or thermal dust emission. For most of the sources in the survey S250 is larger than S1.4 by at least two orders of magnitude, implying a sharply rising spectrum between 1.4 and 250 GHz of index +1 or greater. This would be highly unusual for the integrated spectrum of a radio loud AGN, even in the case of a synchrotron self absorbed source, for which flat spectra into the mm are occasionally seen (Sanders et al. 1989; Owen, Spangler, and Cotton 1980). Even in the cases of the two brightest radio sources in the sample, J1048+4407 and J1057+4555, S250 is a factor five to ten larger than S1.4. Moreover, observations at 5 GHz of the four brightest sources at 1.4 GHz in this sample, including J1048+4407 and J1057+4555, indicate falling spectra at cm wavelengths, with no detection in any case of a compact, flat or rising spectrum AGN radio component. Overall, these data argue strongly that the 250 GHz emission is thermal emission from warm dust, and not synchrotron radiation powered by the AGN. A similar conclusion was reached for 250 GHz detected QSOs from the Sloan Digital Sky Survey (SDSS), based on 1.4 GHz and 43 GHz observations (Carilli et al. 2001a), and by Yun et al. (2000) for the BR QSOs in the sample of Omont et al. (1996a). Further strong supporting evidence that the 250 GHz emission from these sources is thermal emission from warm dust comes from the fact that many of these sources have steeply rising spectra between 250 GHz and 350 GHz (Isaak et al. 2001; see Table 1).
Miller et al. (1990) suggested a division between radio loud and radio quiet QSOs at a rest frame 5 GHz spectral luminosity of W Hz-1. This corresponds to a flux density of S mJy for a source at assuming a spectral index of –0.8. According to this criterion, J1057+4555 and J1048+4407 can be considered radio-loud, and the rest of the sources are clearly radio quiet. The detection of two radio loud sources in our sample of 12 is consistent with the 10 fraction of radio loud QSOs found in optically selected samples of QSOs as a whole (White et al. 2000, Stern et al. 2000, Kellermann et al. 1989; Hooper et al. 1995).
Stocke et al. (1992) consider the radio properties of QSOs as normalized by their optical luminosities. They define the R parameter as the ratio of the rest frame 5 GHz spectral luminosity to the blue spectral luminosity. For high blue luminosity QSOs they define a radio loud source as , and a radio quiet source as . Table 1 shows the R parameter in Column 6. Stocke et al. (1992) suggest a bi-modal radio luminosity function, with a significant deficit of sources in the range . However, the reality of this deficit has been called into question recently by White et al. (2000; cf. Stern et al. 2000), and Stocke et al. (1992) show that the deficit is less clearly delineated for high luminosity QSOs relative to lower luminosity sources. In general, these definitions apply to radio emission that is powered by the AGN itself. In this paper we are most interested in radio emission at a much lower level, corresponding to emission associated with a possible starburst co-eval with the AGN.
4.1 Comparison with Star Forming Galaxies
A more relevant comparison for the purposes of our study is with the expected radio luminosities of star forming galaxies. Figure 3 shows the relationship between redshift and the 250-to-1.4 GHz spectral index for a star forming galaxy taken from the model of Carilli & Yun (2000) based on 17 low redshift galaxies (roughly equivalent to a modified black body spectrum with and dust emissivity index = 1.5). The relationship relies on the tight radio-to-far IR correlation seen for star forming galaxies in the nearby universe (Condon 1992). The dotted curve gives the rms scatter for the 17 galaxies. The symbols are the results for the QSOs in Table 1. The arrows indicate non-detections in the radio, and hence lower limits to the spectral index. On this diagram, a point located below the curve would indicate a source that is radio-loud relative to the standard radio-to-far IR correlation for star forming galaxies, while a point located above the curve would indicate a source which is radio-quiet relative to this relationship.
The two radio loud AGN (J1048+4407 and J1057+4455) are clearly evident as being well below the star forming galaxy curve. The fainter radio detections are all within the 1 scatter defined by star forming galaxies, while the upper limits are consistent with the range defined by star forming galaxies.
4.2 Spectral Energy Distributions
Figure 4 shows the mean radio-through-optical SEDs for radio-loud and radio-quiet QSOs derived from observations of the Palomar-Green (PG) sample of QSOs determined by Sanders et al. (1989). The solid curve shows the SED for radio loud QSOs, while the dashed curve shows the SED for radio quiet QSOs. The hatched regions indicate the scatter in the measured values for the PG sample. Note that the QSOs in the PG sample are typically at lower redshift (), and are an order of magnitude less luminous in the rest-frame UV than the high redshift sources in Table 1. Most of the PG sources are in the range of to .
The data points in Figure 4 show the results for the sources in Table 1, normalized by their blue spectral luminosities. The normalized mm and submm data for all the sources fall within the range defined by the PG sample. Considering the 1.4 GHz data in Figure 4, the two radio loud QSOs (J1048+4407 and J1057+4555) are clearly evident in the normalized SEDs in Figure 4, situated about an order of magnitude above the radio quiet regime. The weaker radio detections, and radio upper limits, lie within a factor of three of the radio quiet SED.
5 Discussion
A fundamental implication of these cm wavelength observations of mm-emitting high redshift QSOs is that the mm wavelength emission in all cases is almost certainly thermal dust emission, and not synchrotron emission from a flat spectrum radio loud AGN. In no case do we detect a compact, flat spectrum AGN radio component that could explain the mm continuum emission.
The importance of pushing to limits of 10’s of Jy at 1.4 GHz for high redshift sources which show thermal emission from warm dust is that we probe well below the radio-loud AGN luminosity regime, into the regime expected for active star forming galaxies. We detect 7 sources at 1.4 GHz. For 5 of these sources the ratios of 1.4 GHz to 250 GHz spectral luminosities are consistent with those expected for active star forming galaxies based on the tight radio-to-FIR correlation for such systems. For the remaining two sources the radio continuum luminosities and morphologies indicate steep spectrum, radio loud emission from a jet-driven radio source. The 5 radio non-detections are all consistent with star forming galaxies, although we cannot rule out the possibility that the sources are radio quiet relative to a typical star forming galaxy.
A flux density of 50 Jy at an observing frequency of 1.4 GHz implies a rest frame spectral luminosity of W Hz-1 at 1.4 GHz at , assuming a spectral index of –0.8. For comparison, the nuclear starburst galaxy Arp 220 has a rest frame spectral luminosity of W Hz-1, while that for the low luminosity (Fanaroff-Riley Class I; FR I) radio jet source M87 is W Hz-1, and that for the , luminous (FR II) radio galaxy Cygnus A is W Hz-1.
Arcsecond resolution radio observations provide constraints on source sizes unavailable from single dish mm observations. An important point is that, unless the dust temperatures are much larger than 50 K, the emitting regions have absolute lower limits to their sizes of , set by assuming optically thick dust emission (Carilli et al. 2001a). This is an extreme lower limit, given that the emission is most likely optically thin. The two sources J0808+5215 and J1418+4449 are too faint for meaningful limits to be placed on source sizes. The brighter sources J1347+4956 and J2322+1944 both appear resolved, with sizes . If the dust emission has a similar spatial distribution as the radio continuum emission then this argues against a single, small (kpc), high surface brightness region as the origin for the dust emission, as would be expected if the dust was heated locally by the AGN. Such spatially extended emission on kpc-scales is interesting when seen in comparison with luminous star forming galaxies in the low universe, ie. the Ultra-Luminous Infrared Galaxies (ULIRGs; L⊙). The infrared and radio continuum emission from low ULIRGs typically show most of the emission coming from a compact, nuclear starburst region, with a scale of only a few hundred pc (Downes and Solomon 1999, Condon 1992). Hence, the larger spatial extent of the emitting regions in these two sources suggests a fundamental difference between these sources and low- ULIRGs. A similar conclusion has been reached for a few other high redshift dust and CO emitting sources (Papadopoulos et al. 2001, Papadopoulos et al. 2000, Richards 2000, Kohno et al. 2001).
The blue-normalized optical-through-radio SEDs for these sources are within the broad range delineated by the lower redshift PG sample (Figure 4). The typical UV luminosity (which dominates the bolometric luminosity) for the QSOs in Table 1 is L⊙, while the typical IR luminosity is about L⊙, assuming a standard dust spectrum (Omont et al. 2001). Hence, the IR emission constitutes of the bolometric luminosity for these galaxies, similar to low redshift, lower luminosity QSOs. This implies that we are not seeing a dominant new broad-band spectral emission ‘feature’ at mm wavelengths in high redshift QSOs relative to the normalized SEDs of lower redshift QSOs.
The fact that the radio-to-FIR SEDs of most of the sources in Table 1 are consistent with those expected for star forming galaxies is by no means proof that the sources are actively forming stars. The important point is that the cm-to-submm SEDs of radio quiet PG QSOs are also consistent with the radio-to-FIR correlation for star forming galaxies (Sanders et al. 1989). Sanders et al. (1989) consider whether this implies star formation in low redshift QSOs as well, and conclude that the agreement is merely coincidental. A similar statement could be made for the high redshift sources.
Omont et al. (2001) consider in detail the implications of the detection of thermal emission from dust in high redshift QSOs in the context of co-eval AGN and starbursts in high redshift QSOs, as suggested by the recently discovered correlation between black hole mass and stellar bulge mass in low redshift galaxies. We re-address these issues briefly herein (see also Isaak et al. 2001; Priddey & McMahon 2001). We adopt the relation for low redshift galaxies of , as derived by Magorrian et al. (1998). If we assume that black hole and stellar bulge formation are co-eval, then:
The black hole luminosity due to accretion is given by (Begelman, Blandford, and Rees 1986):
where is the mass-to-energy conversion efficiency, and is in M⊙ year-1. The relationship between IR luminosity and star formation rate has been derived by numerous authors (see Kennicutt 1998). We use the most recent derivation given in Carilli et al. (2001b):
For a star formation driven IR luminosity of 1013 L⊙, typical for the sources discussed herein, equation 3 implies M⊙ year-1. Using this value in equation 1 then leads to M⊙ year-1. Using this value of in equation 2, and using a typical luminosity due to accretion onto the black hole for this sample of 1014 L⊙ (ie. the QSO optical-through-UV luminosity) yields . A final constraint comes by assuming the QSO luminosity is Eddington limited: L⊙, where . For L⊙ this implies M⊙. The above relations are consistent with the formation of a M⊙ black hole, and a M⊙ spheroidal galaxy, in years. The main problem with this simple calculation is the high efficiency (50) required for conversion of accreted mass into black hole luminosity, as pointed out and discussed at length by Omont et al. (2001).
The issue of co-eval black hole and stellar bulge formation at high redshift remains open. The data presented herein are consistent with such an idea, but certainly do not constitute proof thereof. There are a number of critical observations that can be made to address this interesting question. First is sub-arcsecond resolution imaging at cm and mm wavelengths of the sources to determine the spatial distribution of the emitting regions. Second is a search for large reservoirs of molecular gas through CO observations. And third is sub-arcsecond resolution imaging at optical and near IR wavelengths to study the stars in the parent galaxies. All of these are at the limit of what can be done with current instrumentation, but will become routine with future instruments such as the Atacama Large Millimeter Array, the Expanded VLA, and the Next Generation Space Telescope.
The VLA is a facility of the National Radio Astronomy Observatory (NRAO), which is operated by Associated Universities, Inc. under a cooperative agreement with the National Science Foundation. This work was based on observations carried out with the IRAM 30m telescope. IRAM is supported by INSU/CNRS (France), MPG (Germany) and IGN (Spain). CC acknowledges support from the Alexander von Humboldt Society.
References
- (1)
- (2) Andreani, P., Franceschini, A., & Granato, G. 1999, MNRAS, 306, 161
- (3)
- (4) Begelman, M., Blandford, R., & Rees, M. 1984, Rev. Mod. Phys., 56, 255
- (5)
- (6) Becker, R.H.. White, R.L., & Helfand, D.J. 1995, ApJ, 450, 559
- (7)
- (8) Carilli, C.L., et al. 2001a, ApJ, in press for July 10 edition
- (9)
- (10) Carilli, C.L., Miller, N., Poggianti, B., and Owen, F. 2001b, in preparation
- (11)
- (12) Carilli, C.L. et al. 2000, ApJ (letters), 533, 13
- (13)
- (14) Carilli, C. L., Menten, K.M. & Yun, M. S. 1999, ApJ (letters), 521, 25
- (15)
- (16) Carilli, C.L., Wrobel, J., & Ulvestad, J. 1999, AJ, 115, 928
- (17)
- (18) Carilli, C. L. & Yun, M. S. 1999, ApJ (letters), 513, 13
- (19)
- (20) Carilli, C. L. & Yun, M. S. 2000, ApJ, 530, 618 (erratum: 539, 1024)
- (21)
- (22) Condon, J.J. 1992, ARAA, 30, 575
- (23)
- (24) Djorgovski, S.G. et al. 1999, in Wide Field Surveys in Cosmology, S. Colombi & Y. Mellier (eds), (Editions Frontiers: Paris), p. 89
- (25)
- (26) Downes, D. & Solomon, P. 1998, ApJ, 507, 615
- (27)
- (28) Ferrarese, L. & Merritt, D. 2000, ApJ (letters), 539, 9
- (29)
- (30) Fomalont, E.B. 1999, in Synthesis Imaging in Radio Astronomy, eds. G. Taylor, C. Carilli, & R. Perley (ASP: San Francisco), p. 301
- (31)
- (32) Gebhardt, Karl et al. 2000, ApJ (letters), 539, 13
- (33)
- (34) Genzel, R. et al. 1998, ApJ, 498, 579
- (35)
- (36) Ghez, A.M., Klein, B.L., Morris, M., & Becklin, E.E. 1998, ApJ, 509, 678
- (37)
- (38) Genzel, R., Pichon, C., Eckart, A., Gerhard, P. & Ott, T. 2000, MNRAS, 317, 348
- (39)
- (40) Guilloteau, S., Omont,A., McMahon, R.G., Cox,P., & Petitjean,P. 1997, A&A, 328, L1
- (41)
- (42) Guilloteau, S., Omont,A., McMahon, R.G., Cox,P., & Petitjean,P. 1999, A&A, 349, 363
- (43)
- (44) Hooper, E.J., Impey, C.D., Foltz, C.B., & Hewett, P.C. 1995, ApJ, 445, 62
- (45)
- (46) Isaak, K.G. et al. 2001, MNRAS, submitted
- (47)
- (48) Isaak, K.G., McMahon, R.G., Hills, R.E., Withington, S, 1994, MNRAS, 269, L28
- (49)
- (50) Kellermann, K.I., Sramek, R., Schmidt, M., Shaffer, D.B., & Green, R. 1989, AJ, 98, 1195
- (51)
- (52) Kennicutt, R.C. 1998, ARAA, 36, 189
- (53)
- (54) Kennifick, J.D. et al. 1995a, AJ, 110, 78
- (55)
- (56) Kennifick, J.D. et al. 1995b, AJ, 110, 2553
- (57)
- (58) Kormendy, John, & Ho, Luis C. 2000, in The Encyclopedia of Astronomy and Astrophysics (Institute of Physics Publishing), in press
- (59)
- (60) Magorrian, J. et al. 1998, AJ, 115, 2285
- (61)
- (62) Maloney, P.R., Hollenbach, D.J., & Tielens, A.G. 1996, ApJ, 466, 561
- (63)
- (64) McMahon, R.G., Priddey, R.S., Omont, A., Snellen, I., & Withington, S. 1999, MNRAS (letters), 309, 1
- (65)
- (66) McMahon, R.G., Omont,A., Bergeron, J., Kreysa,E., Haslam, C. G. T, 1994, MNRAS, 267, L9
- (67)
- (68) Miller, L., Peacock, J.A., & Mead, A.R. 1990, MNRAS, 244, 207
- (69)
- (70) Miyoshi, M., et al. 1995, Nature, 373, 127
- (71)
- (72) Ohta, K., Yamada, T., Nakanishi, K., Kohno, K., Akiyama, M., & Kawabe, R. 1996, Nature, 382, 426
- (73)
- (74) Omont, A., Cox, P., Bertoldi, F., McMahon, R.G., Carilli, C.L., and Isaak, K. 2001, A&A, in press
- (75)
- (76) Omont, A., McMahon, R. G., Cox, P., Kreysa, E., Bergeron, J., Pajot, F., & Storrie-Lombardi, L.J. 1996a, A&A, 315, 1
- (77)
- (78) Omont, A., Petitjean, P., Guilloteau, S., McMahon, R. G., Solomon, P. M., & Pecontal, E. 1996b, Nature, 382, 428
- (79)
- (80) Owen, F., Spangler, S., & Cotton, W. 1980, AJ, 85, 3510
- (81)
- (82) Papadopoulos, P.P. et al. 2000, ApJ, 528, 626
- (83)
- (84) Papadopoulos, P.P., Ivison, R.J., Carilli, C.L., & Lewis, G. 2001, Nature, 409, 58
- (85)
- (86) Peroux, Cline, Storrie-Lombardi, Lisa J., McMahon, Richard G., Irwin, Mike, Hook, & Isobel, M. 2001, AJ, 121, 1799
- (87)
- (88) Priddey, R.S. & McMahon, R.G. 2001, MNRAS, in press
- (89)
- (90) Richards, E. 2000, ApJ, 533, 611
- (91)
- (92) Richstone, D. et al. 1998, Nat. Supp., 395A, 14
- (93)
- (94) Sanders, D.B. & Mirabel, I.F. 1996, ARAA, 34, 749
- (95)
- (96) Sanders, D.B., Phinney, E.S., Neugebauer, G., Soifer, B.T., & Matthews, K. 1989, ApJ, 347, 29
- (97)
- (98) Schmidt, M., Schneider, D.P., & Gunn, J.E. 1995a, AJ, 110, 68
- (99)
- (100) Schmidt, M., van Gorkom, J.H., Schneider, D.P., & Gunn, J.E. 1995b, AJ, 109, 473
- (101)
- (102) Stern, D., Djorgovski, S.G., Perley, R.A., de Carvalho, R.R., & Wall, J.V. 2000, AJ, 119, 1526
- (103)
- (104) Stocke, J.T., Morris, S.L., Weymann, R.J., & Foltz, C.B. 1992, ApJ, 396, 487
- (105)
- (106) Stone, R.C. 1994, AJ, 108, 303
- (107)
- (108) Storrie-Lombardi, L. J.; McMahon, R. G.; Irwin, M. J.; Hazard, C., 1996 ApJ, 468, 121
- (109)
- (110) Tanaka, Y. et al. 1995, Nature, 375, 659
- (111)
- (112) van der Marel, R.P. 1999, AJ, 117, 744
- (113)
- (114) White, R.L. et al. 2000, ApJ (supplement), 126, 133
- (115)
- (116) Yun, M.S., Carilli, C.L., Kawabe, R., Tutui, Y., Kohno, K. & Ohta, K. 2000, ApJ, 528, 171
- (117)
| Source | S | S | S | MB | Ra | |
|---|---|---|---|---|---|---|
| Source | mJy | mJy | mJy | |||
| PSS J0808+5215 | 4.45 | 0.0580.018d | 17.42.8 | –28.7 | 0.29 | |
| PSS J1048+4407 | 4.40 | 0.4300.020d | 12.02.2 | –27.4 | 6.90 | |
| PSS J1057+4555 | 4.12 | 1.240.04d | 19.22.8 | –29.4 | 2.75 | |
| APM B1117–1329 | 3.96 | 0.0220.030 | 2713 | –28.2 | 0.33 | |
| APM B1144–0723 | 4.15 | 0.0460.040 | 72 | –27.7 | 0.39 | |
| PSS J1248+3110 | 4.35 | 0.0710.015d | 12.73.4 | –27.6 | 0.39 | |
| PSS J1253–0228 | 4.00 | –0.0430.050 | –27.2 | 1.58 | ||
| PSS J1347+4956 | 4.56 | 0.0910.020d | 8.53.9 | –28.6 | 0.50 | |
| PSS J1418+4449 | 4.32 | 0.0510.016d | 10.42.3 | –28.6 | 0.26 | |
| PSS J1554+1835 | 3.99 | 0.0180.017 | –26.6 | 0.93 | ||
| PSS J1646+5514 | 4.10 | 0.0220.030 | 9.52.5 | –28.7 | 0.45 | |
| PSS J2322+1944 | 4.11 | 0.0980.015d | 22.52.5 | –28.2 | 0.18 |
aSee section 4 for the definition of R. Upper limits are 3 for radio non-detections.
Figure Captions
Figure 1: Images of the 12 QSOs from Table 1 at 1.4 GHz. The FWHM of the Gaussian restoring CLEAN beam is shown as an inset to each figure. Contour levels are a geometric progression is . The first level is 2 in each case, with = rms noise on each image, as specified below. The cross on each image indicates the position of the optical QSO as given in Table 1. Page 1: Upper left: J0808+5215, Jy. Upper right: J1048+4407, Jy. Lower left: J1057+4555, Jy. Lower right: B1117–1329, Jy. Page 2: Upper left: B1144–0723, Jy. Upper right: J1248+3110, Jy. Lower left: J1253–0228, Jy. Lower right: J1347+4956, Jy. Page 3: Upper left: J1418+4449, Jy. Upper right: J1554+1835, Jy. Lower left: J1646+5514, Jy. Lower right: J2322+1944, Jy.
Figure 2: Images of J1048+4407 (upper) and J1057+4555 (lower) at 5 GHz. The FWHM of the Gaussian restoring beam is with a major axis position angle = –70o for J1048+4407, while that for J1057+4555 is with a major axis position angle = –74o. Contour levels are a geometric progression is . The first level is 2, with Jy. The cross on the J1048+4407 image shows the position of the optical QSO. The crosses on the J1057+4555 image show the positions of the peak surface brightness for the northeast and southwest radio lobes, and the optical QSO (center).
Figure 3: The solid curve shows the relationship between redshift and the observed spectral index between 1.4 and 250 GHz for star forming galaxies, as derived from the models presented in Carilli & Yun (2000). The dotted lines show the rms scatter in the distribution. The solid symbols show data for high redshift QSOs from Table 1. The squares are for sources detected at 1.4 GHz, while the arrows show lower limits (2) to the spectral indices for sources that were not detected at 1.4 GHz.
Figure 4: The curves show the radio through UV Spectral Energy Distributions (SEDs) for the Palomar-Green QSOs, taken from Sanders et al. 1989. All data have been normalized to the rest frame blue spectral luminosity. For frequencies above Hz, the solid curve shows the mean spectral energy distribution for the PG QSO sample, which is approximately the same for radio-loud and radio-quiet sources. Below Hz, the hatched regions show the typical ranges given the scatter in the observed properties of the PG QSO sample at cm and mm wavelengths, with the solid line delineating the radio-loud sources and the dashed-line the radio quiet sources. The solid symbols show the values derived for the QSOs listed in Table 1. The arrows show (2) upper limits at 1.4 GHz.
![[Uncaptioned image]](/html/astro-ph/0106408/assets/x5.png)
![[Uncaptioned image]](/html/astro-ph/0106408/assets/x6.png)
![[Uncaptioned image]](/html/astro-ph/0106408/assets/x7.png)
![[Uncaptioned image]](/html/astro-ph/0106408/assets/x8.png)
![[Uncaptioned image]](/html/astro-ph/0106408/assets/x9.png)
![[Uncaptioned image]](/html/astro-ph/0106408/assets/x10.png)
![[Uncaptioned image]](/html/astro-ph/0106408/assets/x11.png)
![[Uncaptioned image]](/html/astro-ph/0106408/assets/x12.png)