Spectrum Analysis of Type IIb Supernova 1996cb
Abstract
We analyze a time series of optical spectra of SN 1993J-like supernova 1996cb, from 14 days before maximum to 86 days after that, with a parameterized supernova synthetic-spectrum code SYNOW. Detailed line identification are made through fitting the synthetic spectra to observed ones. The derived photospheric velocity, decreasing from to , gives a rough estimate of the ratio of explosion kinetic energy to ejecta mass, i.e. . We find that the minimum velocity of hydrogen is , which suggests a small hydrogen envelope mass of , or if is assumed . A possible Ni II absorption feature near is identified throughout the epochs studied here and is most likely produced by primordial nickel. Unambiguous Co II features emerge from 16 days after maximum onward, which suggests that freshly synthesized radioactive material has been mixed outward to a velocity of at least as a result of hydrodynamical instabilities. Although our synthetic spectra show that the bulk of the blueshift of [O I] net emission, as large as at 9 days after maximum, is attributed to line blending, a still considerable residual remains till the late phase. It may be evidence of clumpy or large-scale asymmetric nature of oxygen emission region.
1 Introduction
SN 1996cb in NGC 3510 was first discovered by Aoki, Cho, and Toyama on 1996 December 15 (Nakano & Sumuto, 1996), and independently by BAOSS on 1996 December 18 (Qiao et al., 1996). It was classified as a type IIb event due to spectral similarity to SN 1993J (Garbavich & Kirshner, 1997). As reviewed by Filippenko (1997), this subclass of SNe II appear to be links between normal SNe II and SNe Ib. They show strong hydrogen Balmer lines near maximum brightness, then evolve with the disappearance of hydrogen features and the emergence of helium ones. Many days after maximum, their spectra are dominated by oxygen and calcium emission lines and hence resemble those of SNe Ib at the nebular phase. Their progenitors are usually thought to be massive stars, having lost most of their hydrogen envelopes either through stellar winds (e.g. Höflich, Langer, & Duschinger, 1993), or more likely as the results of mass exchange with their companions (e.g. Nomoto et al., 1993; Podsiadlowski et al., 1993).
Very few type IIb events have been recognized to date. The first one is SN 1987K (Filippenko, 1988), unfortunately whose proximity to the Sun made observations unavailable for a long period after maximum. Unlike it, the famous bright SN 1993J has been exposed to intensive observations and theoretical analysis (for a brief review, see Matheson et al., 2000a). For SNe 1997dd and 1998fa, it is only very recently that one and four spectra respectively were published (Matheson et al., 2001). No data of SNe 1996B (Wang & Wheeler, 1996), 2000H (Benetti et al., 2000), 2001ad (Chornock, Modjaz, & Filippenko, 2001), and 2001cf (Filippenko & Chornock, 2001) have been released yet. Other proposed candidates, like SNe 1989O (Filippenko & Shields, 1989) and 1999bv (Hill et al., 1999), were either distant or discovered at the late phase, with their classifications some uncertain.
Qiu et al. (1999) have published light curves of SN 1996cb and its low-resolution optical spectra, obtained at Beijing Astronomical Observatory, from 14 days before maximum to 160 days after that. The light curves are very similar to those of SN 1993J, except that in SN 1996cb the initial peak due to shock breakout and the subsequent rapid decline have not been observed. The light curve reached a maximum of 14.22 mag on 1997 January 2, which makes it the third brightest supernova discovered in 1996. By comparing its B Vcolor curve with that of SN 1993J, they estimated the explosion date at 1996 December 12. They also described the observed spectral evolution in a brief way, while emphasizing the blueshift of He I and [O I] emission peaks. In SN 1993J, such a phenomenon for [O I] has been suggested being evidence of Rayleigh-Taylor instabilities at the He/C+O interface (Wang & Hu, 1994).
It is important to analyze and model spectroscopic and photometric data of SN 1996cb, by far the only other well-observed SN 1993J-like supernova available for comprehensive investigations. The results can be compared with those of SN 1993J. Numerous studies on the latter arrived at the conclusion that it is the explosion of a massive star with a helium core and a small He-rich hydrogen envelope of (Nomoto et al., 1993; Podsiadlowski et al., 1993; Shigeyama et al., 1994; Bartunov et al., 1994; Utrobin, 1994; Woosley et al., 1994; Young, Baron, & Branch, 1995, etc). These studies also have great influences on many aspects of our understanding of core-collapse supernovae, like the pre-supernova evolution in a binary system (e.g. Nomoto, Iwamoto, & Suzuki, 1995), asymmetric nature of explosion (e.g. Wang et al., 2001), large-scale instability and mixing (e.g. Iwamoto et al., 1997), NLTE and non-thermal effects on spectrum formation (e.g. Houck & Frasson, 1996), interaction of ejecta with circumstellar matter (e.g Franson, Lundqvist, & Chevalier, 1996), etc.
In this paper, we report our work on the synthesis of a spectra series of SN 1996cb from 1996 December 19 to 1997 March 28, spanning almost its whole photospheric stage. We use a parameterized supernova synthetic-spectrum code SYNOW. The method and parameters are described in §2. Our main goal is to establish line identifications, which are presented in §3 with our best fit synthetic spectra. Discussions on photospheric velocity, velocity and mass of hydrogen envelope, identifications of Ni II and Co II, blueshift of [O I] , etc. are given in §4. The comparison with SN 1993J is mentioned wherever within reach. Our main conclusions are summarized in §5.
2 Spectrum Synthesis Procedure
To establish reliable line identifications, theoretical synthesis of supernova spectra is necessary. SYNOW is a parameterized supernova synthetic-spectrum code developed by Branch and collaborators and especially suitable for such a purpose (Branch, 1980; Jeffery & Branch, 1990; Fisher, 2000). The current version of SYNOW uses 42 million line list of Kurucz (1993). It can treat the complicated line blending properly, but still retain a low cost of run-time. We know line blending is a great nuisance in the analysis of supernova spectra, which corresponds to nonlocal radiative coupling between different lines due to a large spatial gradient of velocity (Rybicki & Hummer, 1978; Olson, 1982). Numerical tests show that in the blending of a group of lines even features with large optical depth can be greatly suppressed and sometimes a single quasi-P Cygni profile, but unusually shaped, will be yielded (Jeffery & Branch, 1990).
The basic physical assumptions and parameters adopted in SYNOW can be described as follows: The supernova ejecta is assumed spherically symmetric and with radial velocity at any radius , namely in homologous expansion. The observed continuum is assumed to arise out of a sharp photosphere and fitted by a blackbody one with temperature , while formation of spectral lines are treated as resonant scatterings of continuum photons above the photosphere in Sobolev approximation. No detailed ionization and excitation balance is considered; hence for each ion we choose the Sobolev optical depth, at the photosphere, of one reference line as a free parameter, with those of the others fixed by LTE assumption. The radial dependence of line optical depths is assumed to follow the density profile of ejecta, which is simplified to be either a power-law one, , or an exponential one, . The velocity of photosphere is an important fitting parameter.
In this work, we adopt an exponential density profile, , with e-folding velocity . To determine which ions should be invoked when computing a synthetic spectrum, we refer to line identifications for other Type II and Ib/c supernova, especially SN 1987A (e.g Jeffery & Branch, 1990) and SN 1993J (e.g. Matheson et al., 2000a). The systematic plots of LTE Sobolev line depths versus temperature, made by Hatano et al. (1999a), for some common supernova compositions are also useful. For each ion, the LTE excitation temperature is also a fitting parameter but bears little physical significance. We adapt in the range from to . We fix the outer edge of the line-forming region at . Sometimes we have to set for an ion a minimum velocity , greater than , which shows that it is detached from the photosphere.
To make exact comparisons with synthetic spectra, the observed spectra should be transformed to the rest frame of the host galaxy and corrected for possible interstellar reddening. The recession velocity of NGC 3510 adopted here is (Garbavich & Kirshner, 1997). By comparing B Vcolor curves, Qiu et al. (1999) argued that the color excess of SN 1996cb is 0.2 lower than that of SN 1993J. Although various values were found for the latter, the average seems (see Matheson et al., 2000b, and references therein). So we assume for SN 1996cb, which is consistent with the negligible Galactic component (Schlegel, Finkbeiner, & Davis, 1998) and the absence of narrow Na I D absorption in a dispersion spectrum taken on 1996 December 23 (Qiu et al., 1999).
3 Spectrum Evolution and Line Identification
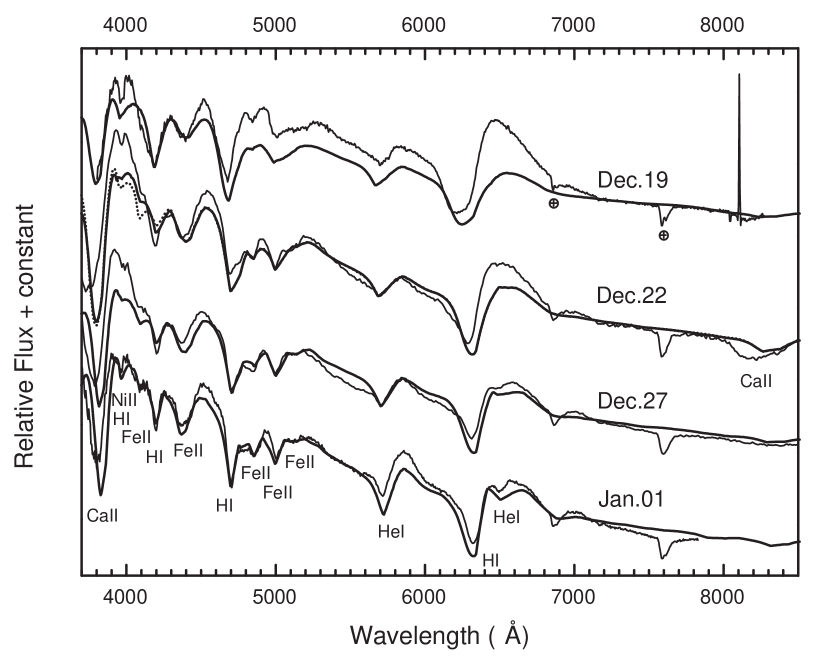
For comparison with each observed spectrum, we have calculated many synthetic spectra with various values of the fitting parameters mentioned above. Our best fit synthetic ones are plotted as thick solid lines in Figures 1, 2, 3, and 4 together with observed ones (thin solid lines) in time sequence. The telluric O2 absorptions of A-band () and B-band () are marked. We list in Table 1 the date of explosion, epoch, and best fit value of and . For each spectrum, two different epoch denotations are employed in this paper. One is in days after the estimated explosion date, 1996 December 12; and the other is in days with respect to the date of B maximum, 1997 January 2, and always prefixed either a minus or a plus. For example, our first spectrum, taken on 1996 December 19, can be denoted as day 7 and -14 days respectively.
3.1 Day 7 to 20
The day 7 (-14 days) spectrum, shown in Figure 1, is similar to those of SN 1993J from 7 to 23 days after explosion, except the puzzling flat-topped characteristic of Hα in the latter (see Lewis et al., 1994; Prabhu et al., 1995; Baron et al., 1995; Finn et al., 1995, etc). P Cygni profiles of Hα, Hβ, Hγ are distinct. Ca II H&K is strong, while the trough attributable to Ca II near-infrared triplet absorption is shallow. According to our synthetic spectrum, P Cygni features around and , and the very broad triangular one from and are produced by Fe II line blends. We can not reproduce the observed profile of Hα, which shows a net emission component with a blueshifted peak and a rather broad absorption base. To fit a prominent notch superimposed on the Ca II H&K emission, we introduce Ni II lines and blend them with Hδ. The strong P Cygni feature around is identified as He I . The contribution from Na I D is supposed to be negligible because the temperature at such an early phase, , is high enough to ionize all neutral sodium.
From day 10 (-11 days) to day 20 (-1 day), the top of Hα emission becomes flat and a notch gradually develops on it. To simulate this behavior, we must fix at , while the photospheric velocity decreases from to . It also requires a drop in the relative optical depth, , by one order from day 7 to day 20; and accordingly the notch is identified as He I . In contrast to the first spectrum, here Hα profiles can be well fitted under our LTE purely resonant scattering assumption, which suggests that the hydrogen region is nearly recombined. All these show that the photosphere has receded through the H/He interface. In SN 1993J, this does not happen till 26 days after explosion (Matheson et al., 2000a, and references therein). A new feature at , produced by Fe II, emerges from behind the weakened Hδ absorption due to de-blending. The “” notch is also attributed much more to Ni II than to Hδ. Other line identifications are the same as those on day 7. However, to fit the observed spectra, here we must set for Fe II.
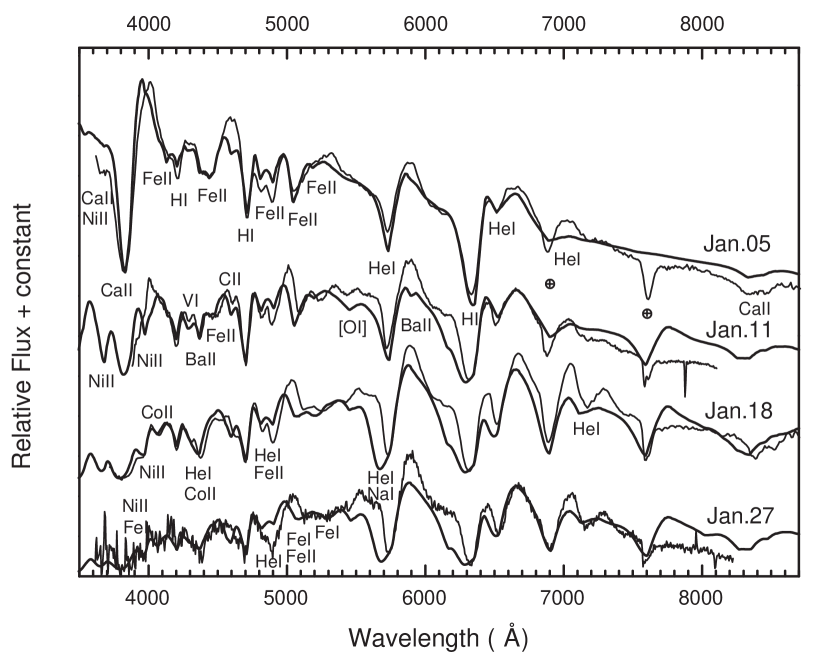
3.2 Day 24 to 46
Figure 2 shows the spectra from day 24 (+3 days) to day 46 (+25 days). The day 24 spectrum resemble those previous, but the constraint on is relaxed here and after. He I develops clear. Ni II helps somewhat to form a feature around with Ca II, although the “” notch that we attribute to Ni II and Hδ before disappears.
There are some noticeable changes in the day 30 spectrum: (1) The broad single “” feature splits into three distinct bumps. The blueward two are most likely produced by Fe II lines in strongly blending. There are some controversy about the nature of the feature in spectra of SN 1993J, which can be traced back to as early as day 25 (Prabhu et al., 1995; Wang & Hu, 1994). Following Wang & Hu (1994) and other authors, we suggest it as the blueshifted [O I] emission. By employing a low enough temperature of , we can include forbidden lines [O I] and in our synthetic spectra, without causing an unreasonably strong O I . (2) The deep notch at and an inconspicuous dip on the top of He I emission can be fitted by Ba II and respectively, if is set. The dip just blueward to Hβ is identified as absorption of C II detached at . We attribute the feature located at to V I absorption. (3) Ca II H&K emission becomes weak and shows an unusual triangular profile centered at . The redward decline can be well reproduced. But the fit to the blueward incline, which is remarkably redshifted, can only be partially improved by including Ni II absorption.
Day 37 and day 46 spectra are dominated by He I (blended with Na I D), , , and P Cygni lines in the red. He I also contributes a lot to absorptions at , , and . A distinct notch appears at is identified as Co II feature through spectral synthesis. If Co II is removed, there will be obvious discrepancies also in other regions between model spectra and observations. We noticed there is an absorption feature near in the spectra of SN 1993J from day 56 to 109 (Matheson et al., 2000a; Lewis et al., 1994; Swartz et al., 1993b) but unfortunately without identification. Ni II feature, with a minor contribution from He I, lies just redward to Ca II H&K absorption, which becomes rather weak now. We must decrease the optical depth of Fe II to explain the nearly absence of Fe II . From day 46 onward, Fe I is introduced to lower the flux bluer than to the observed level, and also helps to form the basin-like shape between and . Ba II and V I features seen in day 30 spectrum have completely disappeared.
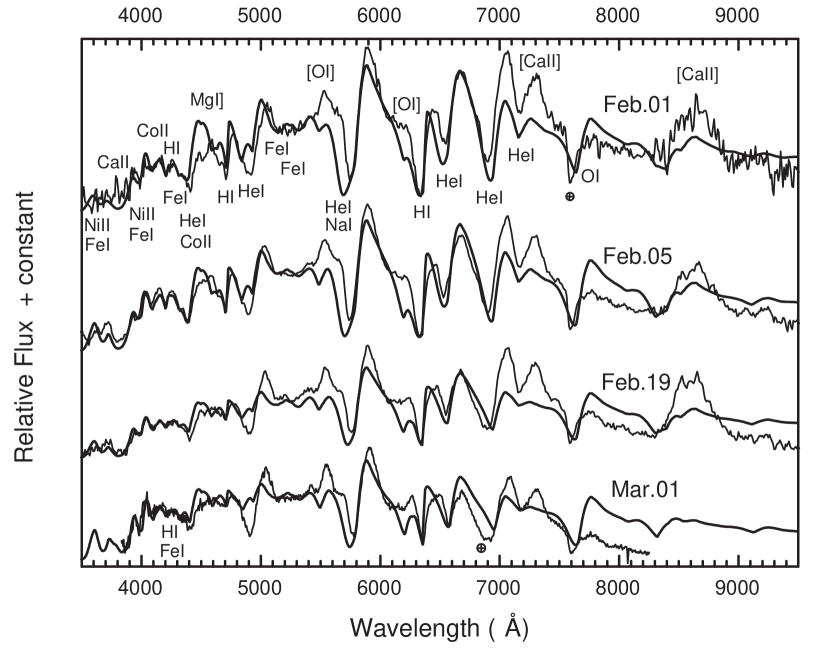
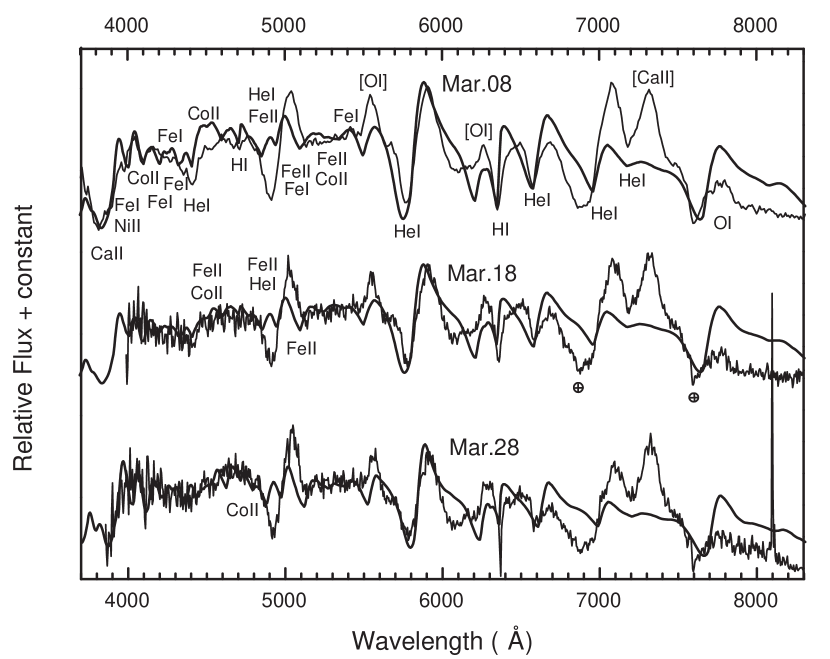
3.3 Day 51 to 107
Figures 3 and 4 show the spectra from day 51 (+30 days) to day 107 (+86 days). H Balmer lines continue to weaken fast, consequently the spectra resemble those of Type Ib more and more. Although a narrow Hα absorption and an inconspicuous Hβ feature remain till day 107, they nearly vanish in the April 4 spectrum (day 114) of Qiu et al. (1999) and April 16 spectrum of Matheson et al. (2001). He I line intensity culminates around day 55, and then begins to decay, especially that of . Because of this and also of the decrease of photospheric velocity, telluric O2 B-band () reappearances and contributes to a somewhat misleading flat-bottomed profile.
Forbidden emissions like [Ca II] , near-infrared triplet and narrow Mg I] develop in this period, which designates a transition to the nebular phase. In accordance, the light curve of SN 1996cb enters its tail around day 50 (Qiu et al., 1999). We can not produce these nebular features with SYNOW due to their non-resonant-scattering nature. [O I] does not strengthen much throughout this epoch, while the gradually standing-out of [O I] emission is attributed more to the weakening of Hα absorption than to the change of oxygen abundance. There seems some O I emission, although the possible absorption is greatly contaminated by telluric O2 A-band.
Fe II is removed from our synthetic spectra since day 51 and is introduced again since day 87, in order to simulate the evolution of Fe II . We fail to fit the excessive intensity of supposed He I/Fe II P Cygni feature around . NLTE effects may account for it. The excellent fit to the observed multi-peak shape between seems striking, considering numerous transitions of Fe I, Fe II, Co II, and Ni II in operation and complicated blending effects between them. That is to say, our introduction of Ni II, Co II, and Fe I is somewhat valid. Note the Fe I feature just redward to Hγ in Figure 3 and other Fe I features in Figure 4.
Overall, line identifications change little from day 37 to day 107, which means that there is no evident composition stratification in the velocity range from to . The spectra are fully dominated by [O I] and [Ca II] nebular emissions since 1997 April (Qiu et al., 1999; Matheson et al., 2001), when the photosphere has most likely receded into the oxygen core. Analysis of subsequent nebular spectra goes beyond the ability of SYNOW.
4 Discussion
4.1 Evolution of Photospheric Velocity
The most reliable parameter fixed by the spectral synthesis with SYNOW is the photospheric velocity. Absorption minima of some weak lines, e.g. Fe II , , and Hγ, are often regarded as good tracers of in Type II (e.g. Eastman & Kirshner, 1989; Duschinger et al., 1995). However, they more or less blend with others and sometimes can not be identified correctly. With SYNOW, information not only on minima positions but also on profiles, and of as many as possible features, can be used to determine in a consistent way, while line blending and optical depth effects have been taken into account.
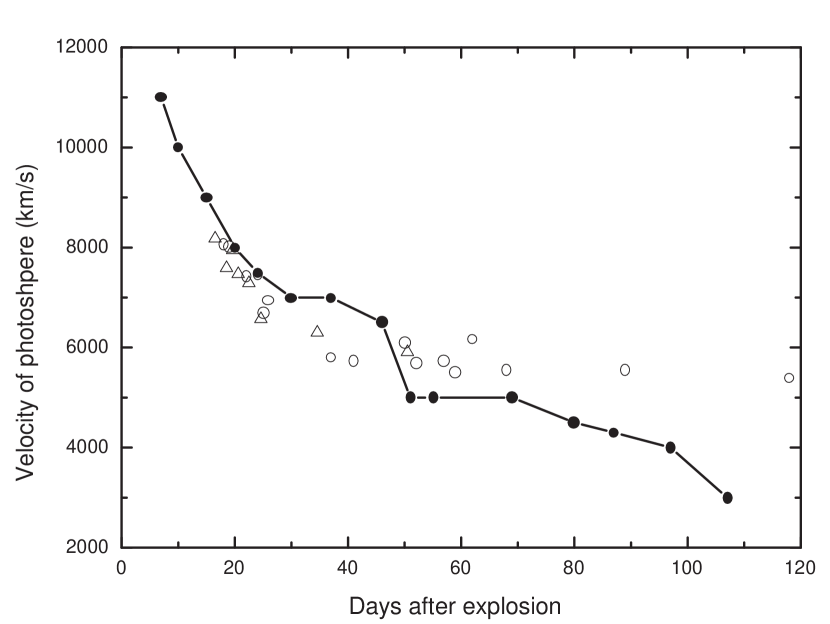
We plot in Figure 5 the the evolution of photospheric velocity of SN 1996cb, derived from our spectral synthesis. The error is estimated less than . We can see that declines monotonically from on day 7 to on day 107 days. For comparison, photospheric velocities of SN 1993J measured in absorption minimum of Fe II (Prabhu et al., 1995; Baron et al., 1995) are plotted in the same figure. They are similar to each other on the whole, while the difference at late phase may demonstrate that Fe II does not follow very well (note that measurement of the same line in our SN 1996cb spectra also gives a value after day 80).
For given ejecta mass and explosion kinetic energy , we know roughly scales as . The exact relationship depends on the specific hydrodynamical structure of supernova ejecta. Considering the exponential density profile adopted for our spectral synthesis
| (1) |
where is the central density and is the e-folding velocity, one immediately gets
| (2) |
Defining as the average opacity above the photosphere, we find that the evolution of photospheric velocity can be approximately expressed as
| (3) |
where or 2/3 is the optical depth at the photosphere, is in and is time in days since explosion. Fitting of data shown in Figure 5 by the above equation gives , a little smaller than our trial value of for spectral synthesis, and
| (4) |
| (5) |
However, the actual density profile may be far from an exponential one (In fact, shown in Figure 5 can also be well fitted by assuming a power-law density profile). Referring to the 4H89 model for SN 1993J presented by Shigeyama et al. (1994, Fig. 2), in which the density distribution approximates to between and remains roughly constant below , we then assume in SN 1996cb
| (6) |
Integrating and over velocity, we get
| (7) |
where is the characteristic velocity in . We find the evolution of photospheric velocity can be described as
| (8) |
which shows that is a inflection point. If we suppose the bump from day 30 to 50 in Figure 5 is more or less relevant to the so-called inflection point, we then estimate at . By fitting , we find for and for . Substituting these values into equation (8), one finally obtains
| (9) |
We know the typical value of explosion kinetic energy for core-collapse supernova is , accordingly equations (9) and (5) suggest that ejecta mass of SN 1996cb possibly lies in the range of , similar to those of SN 1993J and Type Ib (Shigeyama et al., 1990). More reasonable constraints on and can be made by exploding a realistic progenitor model and reproduce both light curves and shown in Figure 5.
4.2 He-rich Hydrogen Envelope with High Velocity
It is crucial to determine the distribution and mass of hydrogen in Type IIb supernovae for the understanding of their unusual pre-explosion evolution. For SN 1993J, most authors doing hydrodynamical calculations inferred a low-mass He-rich hydrogen envelope of (Nomoto et al., 1993; Podsiadlowski et al., 1993; Shigeyama et al., 1994; Bartunov et al., 1994; Utrobin, 1994; Woosley et al., 1994; Young, Baron, & Branch, 1995, etc), which is consistent with NLTE modeling of photospheric spectra (Swartz et al., 1993b; Zhang & Wang, 1996). By analyzing its Hα emission in nebular spectra, Patat, Chugai, & Mazzali (1995) concluded that ionized hydrogen is distributed between with density maximum at . Utrobin (1996) arrived at a very similar conclusion in his light curve study including nonthermal ionization. Applying a sophisticated NLTE code to nebular spectra, Houck & Frasson (1996) argued that the bulk of the preferred H/He envelope mass, , lies between , and ruled out the presence of more than of hydrogen above or below this range.
As described above, to fit photospheric spectra of SN 1996cb, the line forming region of hydrogen is required to be detached from the photosphere after day 10. The adopted value of parameter only varies in a very narrow range, . It is about smaller than the absorption velocity of Hα till day 46; but after that it approaches the latter. In comparison, absorption velocity of Hα and Hβ in SN 1993J, considerably declining during the first 50 days, stop around and respectively from day 50 to day 70 (Barbon et al., 1995). After day 100, as Hα absorption is no longer optical thick, the velocity reaches , i.e. the minimum velocity of hydrogen envelope derived by Houck & Frasson (1996). Accordingly, we can say that the inner boundary of hydrogen envelope of SN 1996cb exists at , higher than of SN 1993J.
In the explosion of a Type IIb supernova, due to the supposed low mass of hydrogen envelope, the deceleration of shock wave at the H/He interface and consequent Rayleigh-Taylor instability is rather weak (Iwamoto et al., 1997). As a result, the minimum velocity of hydrogen envelope depends mainly on its mass, . Thus one can expect an even smaller for SN 1996cb than for SN 1993J. Considering an ejecta with the exponential density profile given by equation (1), the mass above , i.e. , is
| (10) | |||||
| (11) |
where . And for the density profile given by equation (7), is
| (12) | |||||
| (13) |
Combining equations (11) and (13) with equations (5) and (9) respectively, and assuming , we find the mass of hydrogen envelope of SN 1996cb is , near the low end among different estimated values for SN 1993J.
As argued above, the photosphere in SN 1996cb recedes through the H/He interface around day 10, much earlier than in SN 1993J, say day 26. This could be explained by the smallness of compared with SN 1993J. It is well known that, opacity in the hydrogen envelope is dominated by free electron scattering at the early phase. Then the optical depth at the the H/He interface at time after explosion roughly scales as
| (14) |
where is the characteristic length in the hydrogen envelope, is the characteristic electron density and the Thompson scattering cross section. It is nonthermal ionization by relativistic electrons that prevents the hydrogen envelope from being completely recombined after the initial rapid cooling stage (Wheeler & Filippenko, 1996; Utrobin, 1996). Adopting a simple balance between collisional recombination and nonthermal ionization,
| (15) |
and neglecting any variation among the effective collisional recombination coefficient and the effective nonthermal ionization coefficient , one gets
| (16) |
When the photosphere arrives at the H/He interface, i.e. , substituting of equation (16) into equation (14) gives
| (17) |
It is obvious that this equation is in agreement with the comparison between SN 1996cb and SN 1993J.
Helium abundance in the so-called hydrogen envelope should be very high, which is suggested by strong He I feature in the spectrum of SN 1996cb on day 7, when the photosphere still stays in the envelope. We know the line Sobolev optical depth is
| (18) |
where is the oscillator strength, is the rest wavelength, is the atomic number density in the lower state, is time in days after explosion and the term for induced emission is neglected. Under the LTE assumption, the adopted optical depths of reference lines and excitation temperatures for H I and He I give and , respectively, at the photosphere on day 7, while the electron density required for continuum optical depth is . These values, although rather uncertain, may show both that the helium abundance is high and a large fraction of H and He are ionized. Through NLTE modeling of early spectra, Baron, Hauschildt, & Branch (1994) found for the envelope of SN 1993J.
A He-rich hydrogen envelope is the natural result of pre-supernova evolution with large mass loss (Saio, Kato, & Nomoto, 1988; Woosley et al., 1994). For given , , and surface radius , a hydrostatic and thermal equilibrium H/He envelope can be constructed upon the helium core (Saio, Kato, & Nomoto, 1988). Since the initial adiabatic cooling stage in SN 1996cb ends before the discovery, i.e. day , much earlier than in SN 1993J, i.e. day , of the progenitor of SN 1996cb should by smaller than that of SN 1993J (, Iwamoto et al., 1997). A solution of that can fit both the light curve and the day 7 spectrum will discriminate the pre-explosion paths of SN 1996cb and SN 1993J.
We note before the excessive emission of Hα in day 7 spectrum and its blueshifted peak can not be fitted with SYNOW. As in the atmospheres of normal Type II, it can be attributed to NLTE effects and the significant extension of the line forming region (e.g. Duschinger et al., 1995; Eastman, Schmidt, & Kirshner, 1996). Collisional recombination of H+ to levels and subsequent cascade transitions may also contribute. Zhang et al. (1995) introduced a smooth but tenuous outer layer of the envelope to model the unusually broad Hα absorption profile in early spectra of SN 1993J, which also appears in day 7 spectrum of SN 1996cb but is less prominent and hence suggests a somewhat different density profile for the outer layer.
4.3 Identifications of Ni II and Co II Lines
We find that Ni II significantly contributes to an absorption feature near , i.e. adjacent to Ca II H&K. These lines, mostly Ni II , have been identified unambiguously in photospheric spectra of some Type Ia (e.g. Mazzali et al., 1997; Hatano et al., 1999b). This is not unexpected since in thermonuclear explosions of white dwarfs Ni is synthesized in large abundance and distributed outward to rather high velocity. As to core-collapse supernovae, Deng et al. (2000) introduced Ni II to account for the “ absorption” in their September 14 spectrum of Type Ib SN 1999dn, while Mazzali, Iwamoto, & Nomoto (2000) found that Ni II and Co II lines help to form the unusual spectra of Type Ic hypernova SN 1997ef.
Ni identified in SN 1996cb is probably primordially originated. For core-collapse supernovae, typically newborn 56Ni is ejected but, if without mixing, buried in the innermost layer of the ejecta. On the other hand, artificial large-scale outward mixing of 56Ni plays an important role in reproducing observed light curves (e.g. Blinnikov et al., 2000) and spectra (e.g. Lucy, 1991) with one-dimensional models. 2D and 3D hydrodynamical numerical simulations demonstrated that large-scale mixing can be induced by nonlinear growth of Rayleigh-Taylor instabilities and can transport 56Ni to for Type II SNe (e.g. Kifonidis et al., 2000) and to for Type Ib/IIb SNe (e.g. Hachisu et al., 1991; Iwamoto et al., 1997). Accordingly, Ni II feature identified in SN 1996cb as early as day 7, when the photosphere is well in the hydrogen envelope and with a velocity as high as , is unlikely to be produced by newborn 56Ni. Additional evidence comes from the fact that the Ni II feature remains discernible far beyond the half life of 56Ni, days.
An alternative explanation for high velocity Ni II is asymmetry. Nagataki, Shimizu, & Sato (1998) and Maeda et al. (2000) have calculated nucleosynthesis for axisymmetric supernova explosions and concluded that 56Ni can be accelerated to very high velocities roughly along the axial direction. A bipolar scenario of explosion for Type IIb supernova is also the suggestion of Wang et al. (2001), who noticed the strikingly similarity of spectropolarimetry between SN 1993J and SN 1996cb.
The identification of Co II in SN 1996cb seems more reliable than that of Ni II. Distinct Co II features emerged in the blue part of spectra since day 37, when the photosphere velocity declined to . This can be regarded as direct spectral evidence of large-scale outward mixing of radioactive elements in explosion. We mentioned earlier that similar but less distinct Co II features may occur in SN 1993J after day 56, when the photospheric velocity is lower than . This is consistent with the results of light curve modeling (Iwamoto et al., 1997) and NLTE analysis of nebular spectra (Houck & Frasson, 1996), that maximum velocity of 56Ni for SN 1993J most likely lies in the range of . As shown by Hachisu et al. (1991) and Iwamoto et al. (1997), the extent of 56Ni mixing provides a constraint on the mass of helium core of the progenitor, , that more extensive mixing is induced by R-T instabilities for smaller , and that for and for . Accordingly, the mass of helium core of SN 1996cb may be , i.e. a little smaller than that of SN 1993J. The more extensive mixing of 56Ni also helps to explain the earlier start of the radioactive heating stage in the light curve of SN 1996cb than in that of SN 1993J.
4.4 Blueshift of [O I] Emission Peak
We identify the distinct bump, in photospheric spectra of SN 1996cb from day 30 onwards, as blueshifted [O I] emission. The appearance of this line at such early phase was first mentioned by Harkness et al. (1987) in Type Ib SNe 1983N and 1984L. But Filippenko, Porter, & Sargent (1990) argued that spectral synthesis is required to make a reliable identification, when analyzing spectra of Type Ic SN 1987M (see also Swartz et al., 1993a). Wang & Hu (1994) found that in SN 1993J this feature can be traced back to as early as day 27 and also noticed its apparent blueshift, which they attributed to a clumpy nature of ejecta near the He/C+O interface. Filippenko, Matheson, & Barth (1993) mentioned that the blueshift of emission lines is just a consequence of viewing primarily the near side of the optically thick ejecta. Spyromilio (1994) compared peak wavelengths of [O I] lines and Mg I] 4571 with those of permitted lines and proposed a large-scale asymmetric distribution of radioactive material for SN 1993J. However, through modeling nebular spectra of SN 1993J, Houck & Frasson (1996) concluded that the bulk of the blueshift of [O I] lines can be explained by line blending effects. Blueshift of the order of is also observed for emission lines at late phases of Type Ib SN 1996N (Sollerman, Leibundgut, & Spyromilio, 1998).
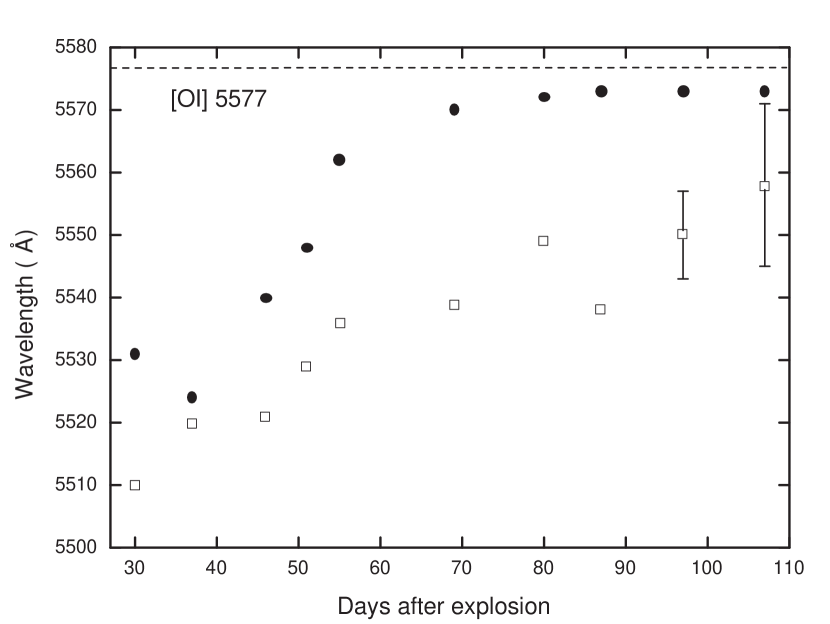
To study the effect of line blending on the blueshift of [O I] at photospheric phases, we try to include [O I] and into our synthetic spectra by setting an excitation temperature as low as . This technique is roughly valid because the emission peak of a pure resonant scattering line, in a spherically symmetric and homologous expanding atmosphere, exists at the rest wavelength if without blending (Jeffery & Branch, 1990), although in fact [O I] net emissions is mainly produced via other processes, like electron collisional excitation. Peak wavelength of [O I] both in observed spectra and in our best fit synthetic ones are plotted in Figure 6. These values are simply measured by hand, for the accuracy is not crucial here. On day 97 and 107, some features or noise develop on the top of [O I] , so we introduce error bars to describe the possible large uncertainty.
Figure 6 shows that the observed blueshift declines steadily from on day 30 to on day 107. This trend is reproduced in the rough by our synthetic data, which can only be interpreted as the variation of blending effects because neither asymmetry nor clumping is involved in our spectral synthesis. On the other hand, a blueshift of of the observed peak wavelength to the synthetic one remains throughout the period covered by Figure 6, while the latter approaches to finally. Furthermore, if we check the nebular spectra in April or May of 1997 (Qiu et al., 1999; Matheson et al., 2001), we can find that [O I] is still blueshifted by .
The bulk of the blueshift of [O I] at photospheric phases in SN 1996cb can be accounted for by line blending, but the rest of , i.e. , still demands an explanation. (1) The clumping model of Wang & Hu (1994) seems less likely because the [O I] emission peak never return to the rest wavelength, even after the photosphere has receded deep into the oxygen core. However, a photospheric spectrum code which can manage a clumpy ejecta well, e.g. by using the Monte Carlo technique, is required to clarify if clumping can affect the peak wavelength of line emission more or less. (2) At photospheric phases, the occultation of the main receding part of emission line forming region by the photosphere will also contribute somewhat to the residual blueshift, especially if NLTE effects can remarkably populate the upper level of [O I] transition, , well above the photosphere. (3) Houck & Frasson (1996) and Sollerman, Leibundgut, & Spyromilio (1998) found the blueshift of O I in nebular spectra of SN 1993J, , and of SN 1996N, , respectively. Since this line is probably free of strong blending, they suggested that it is indicative of real asymmetry, possibly related to large-scale mixing.
In photospheric spectra of SN 1996cb, O I is inconspicuous and contaminated by telluric absorption. [O I] photons are strongly blended with each other and scattered by Hα transition. Therefore the measurement of peak wavelengths of these lines is of no significance. On the other hand, the distinct Mg I] narrow emission in our day 51 and 87 spectra peaks at , i.e. apparently redshifted. Does features of Mg I] and [O I] come from different asymmetry and hence hint different mixing behavior? The peak wavelength of prominent [Ca II] emission evolves from on day 51 to on day 107. Considering the blending with He I in the beginning, it is just to say that no blueshift exists (cf. SN 1996N Sollerman, Leibundgut, & Spyromilio, 1998). This is consistent with the conclusion for SN 1987A that calcium is most likely primordial and much less clumpy than oxygen (Li & McCray, 1992, 1993).
Is the electron density in SN 1996cb as early as day 30 low enough to favor the emission of oxygen forbidden lines? We know the critical electron density for [O I] forbidden transition is
| (19) |
where the statistical weight , the spontaneous radiative transition rate , is the electron temperature, and the effective collision strengths is found from Bhatia & Kastner (1995). The calculated is insensitive to and, when , . Assuming pure Thompson scattering continuum optical depth, we can express the electron density at the photosphere as
| (20) |
for the density profile defined by equation (1), and as
| (21) |
for the density profile defined by equation (6). Both equations give on day 30, which does not differ much from for [O I] . We note that Swartz et al. (1993b) exploit a low-density outer layer in high velocity, say , to fit oxygen features in photospheric spectra of SN 1993J. This assumption seems both unnecessary and unreasonable.
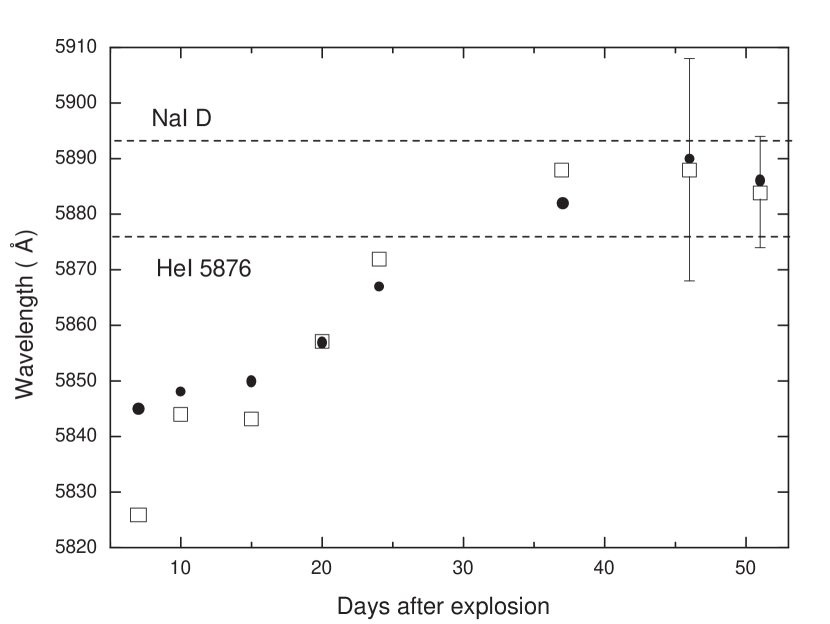
Qiu et al. (1999) also noticed the apparent blueshift of He I emission peak at very early phases and its subsequent recession to the rest wavelength in SN 1996cb. They claimed it as evidence of prominent Rayleigh-Taylor instabilities at the H/He interface. However, according to two-dimensional simulations, R-T instabilities must be weak at the H/He interface of Type IIb because of small envelope mass (e.g. Iwamoto et al., 1997). We plot in Figure 7 peak wavelength of He I both in observed spectra and in our best fit synthetic ones. The observed values can be reproduced very well by our synthetic spectra. Obviously, the blueshift of He I emission peak is superficial and can be attributed to the strong blending effects with Hα. After day 37, He I emission peak is redshifted into the range of , which shows that contribution from Na I D becomes noticeable.
4.5 Some Ambiguous Identifications
Three distinct notches at , , and appears on day 30 spectrum and have been identified as V I absorption, Ba II , and C II , respectively. With some caution, they can be traced back to day 24 spectrum. However, we must note here that these identifications are rather ambiguous.
First, the ionization potential of V I, only , seems too small to prevent it from being largely ionized. Therefore the feature is more likely attributed to Ti II absorption, just like in SN 1987A (Jeffery & Branch, 1990), Type Ic SN 1994I (Millard et al., 1999), and Type Ic hypernova SN 1997ef (Mazzali, Iwamoto, & Nomoto, 2000), etc. However, with Ti II we can not produce the required notch but lower the flat top of Hγ uniformly, unless we set a strong constraint on the line forming region, say . This does not necessarily rule out this ion, because many Ti II lines in strongly blending is involved and NLTE effects if existed will complicate the case greatly.
At first sight, the identification of Ba II is more or less credible, since the observed feature is prominent and another absorption feature can be fitted by Ba II consistently. But the required minimum velocity of the line forming region, , is far from explicable. How can the barium material obtain significant resonant scattering optical depth when the photosphere is below, considering that both the ejecta and the radiation field have been greatly diluted compared with the photosphere? Is it produced by a mass of dense barium cloudy which run into our line of sight from day 24 to day 37, say by the rotation of supernova? But the required rotational velocity is and hence impossible. Matheson et al. (2000a) suggested that a line at on day 19 spectrum of SN 1993J may be Ba II . But according to our spectral synthesis for SN 1996cb, it is undoubtedly Fe II feature (see day 7 spectrum shown in Figure 1).
To fit the dip in the spectra of day 24 and 30 by C II , we make C II to be detached at . However, from day 37 onwards, the feature formed in this way is too blue to fit the observed one. Inspecting these spectra closely, we find that this dip always attaches to the blueward edge of Hβ absorption that it looks like a satellite line. We note that Baron et al. (2000) met the same problem of the lack of a strong candidate for the feature when analyzing the spectra of Type II SN 1999em. By using a full NLTE code PHOENIX, they found that it is produced by complicated NLTE effects varying the Balmer level populations in the mid-velocity range. They named it and Hβ together “double Hβ”. It is interesting to note that Utrobin, Chugai, & Adnronova (1995) got a close idea, namely a radial dependence of Sobolev optical depth with two maxima, to explain the blue emission satellite of the famous “Bochum event” in SN 1987A. The recurrence of this phenomenon in these three otherwise quite different supernova arouses the question how generally it would exist.
Since SN 1987A (Williams, 1987), Sc II and Sr II features are identified in many other Type II supernovae, e.g. SN 1992H (Clocchiatti et al., 1996), SN 1995V (Fassia et al., 1998), and SN 1997D (Turatto et al., 1998), and often coexist with Ba II ones. Can the bump here be identified as Sc II , especially in the day 30 spectrum? We invoke Sc II in our synthesis calculations but find that the synthetic emission feature peaks at , redder than the observed one on day 30, i.e. . Furthermore, the Sc II is much too strong if the excitation temperature . As shown in Figure 1 (dotted line), Sr II blending with Hδ can fit the notch the same well as Ni II lines on day 10, but in the price of an unwanted absorption feature due to Sr II .
5 Conclusion
We have analyzed the photospheric spectra of Type IIb SN 1996cb from day 7 to day 107 and made detailed line identifications by using the parameterized supernova synthetic-spectrum code SYNOW. Our findings are the following:
-
1.
The photospheric velocity evolves from on day 7 to on day 107, which makes some constraint on the explosion kinetic energy and ejecta mass, i.e. .
-
2.
The minimum velocity of hydrogen envelope is , corresponding to a mass of hydrogen envelope of , smaller than that of SN 1993J.
-
3.
Distinct Ni II and Co II features have been identified. The former is most likely primordially originated. The latter shows that newly synthesized radioactive elements has been mixed outward to at least , which favors a mass of helium core of the progenitor of .
-
4.
The bulk of the blueshift of [O I] net emission is attributed to line blending, although a still considerable residual remains till the late phase. On the other hand, the superficial blueshift of He I peak can be fully explained as the blending effect with Hα.
Although the results presented in this paper are calculated with a parameterized code under the purely resonant scattering assumption, they may serve as initial references for detailed NLTE spectrum modeling, which is self-consistent and more reliable but on the other hand time-consuming. The modeling of the light curve of SN 1996cb, coupled with what have been derived from our direct spectral analysis, like the evolution of photospheric velocity, minimum velocity of hydrogen envelope and extent of 56Ni mixing, is in progress.
References
- Baron, Hauschildt, & Branch (1994) Baron, E., Hauschildt, P. H., & Branch, D. 1994, ApJ, 426, 334
- Baron et al. (1995) Baron, E., Hauschildt, P. H., Branch, D., et al. 1995, ApJ, 441, 170
- Baron et al. (2000) Baron, E., Branch, D., Hauschildt, .P. H., et al. 2000, ApJ, 545, 444
- Barbon et al. (1995) Barbon, R., Benetti, S., Cappellaro, E., et al. 1995, A&AS, 110, 513
- Bartunov et al. (1994) Bartunov, O. S., Blinnikov, S. I., Pavlyuk, N. N., et al. 1994, A&A, 281, L53
- Benetti et al. (2000) Benetti, S., Cappellaro, E., Turatto, M., et al. 2000, IAU Circ., 7375
- Bhatia & Kastner (1995) Bhatia, A. K., & Kastner, S. O. 1995, ApJ, 96, 325
- Blinnikov et al. (1998) Blinnikov, S. I., Eastman, R., Bartunov, O. S., et al. 1998, ApJ, 496, 454
- Blinnikov et al. (2000) Blinnikov, S. I., Lundqvist, P., Bartunov, O., et al. 2000, 532, 1132
- Branch (1980) Branch, D. 1980, in Proc. Workshop on Atom. Phys. and Spectrsc., Supernovae Spectra, ed. R. Meyerott & G. H. Gillespie (New York: AIP), 39
- Chornock, Modjaz, & Filippenko (2001) Chornock, R., Modjaz, M., & Filippenko, A. V. 2001, IAU Circ., 7618
- Clocchiatti et al. (1996) Clocchiatti, A., Benetti, S., Wheeler, J. C., et al. 1996, AJ, 111, 1286
- Deng et al. (2000) Deng, J. S., Qiu, Y. L., Hu, J. Y., et al. 2000, ApJ, 540, 452
- Duschinger et al. (1995) Duschinger, M., Puls, J., Branch, D., et al. 1995, A&A, 297, 802
- Eastman & Kirshner (1989) Eastman, R. G., & Kirshner, R. P., 1989, 347, 771
- Eastman, Schmidt, & Kirshner (1996) Eastman, R. G., Schmidt, B. P., & Kirshner, R. 1996, ApJ, 466, 911
- Fassia et al. (1998) Fassia, A., Meikle, W. P. S., Geballe, T. R., et al. 1998, MNRAS, 299, 150
- Filippenko (1988) Filippenko, A. V. 1988, AJ, 96, 1941
- Filippenko & Shields (1989) Filippenko, A. V., & Shields, J. C. 1989, IAU Circ., 4851
- Filippenko, Porter, & Sargent (1990) Filippenko, A. V., Porter, A. C., & Sargent, W. L. W. 1990, AJ, 100, 1575
- Filippenko, Matheson, & Barth (1993) Filippenko, A. V., Matheson T., Barth, A. J. 1994, ApJ, 108, 2220
- Filippenko (1997) Filippenko, A. V. 1997, ARA&A, 35, 309
- Filippenko & Chornock (2001) Filippenko, A. V., & Chornock, R. 2001, IAU Circ., 7636
- Finn et al. (1995) Finn, R. A., Fesen, R. A., Darling, C. W., et al. 1995, ApJ, 110, 300
- Fisher (2000) Fisher, A. 2000, Ph.D. thesis, Univ. of Oklahoma
- Franson, Lundqvist, & Chevalier (1996) Franson, C., Lundqvist, P, & Chevalier, R. A. 1996, ApJ, 461, 993
- Garbavich & Kirshner (1997) Garnavich, P., & Kirshner, R. 1997, IAU Circ., 6529
- Hachisu et al. (1991) Hachisu, I., Matsuda, T., Nomoto, K., et al. 1991, ApJ, 368, L27
- Harkness et al. (1987) Harkness, R. P., Wheeler, J. C., Margon, B., et al. 1987, ApJ, 317, 355
- Hatano et al. (1999a) Hatano, K., Branch, D., Fisher, A., et al. 1999, ApJS, 121, 233
- Hatano et al. (1999b) Hatano, K., Branch, D., Fisher, A., et al. 1999, ApJ, 525, 881
- Houck & Frasson (1996) Houck, J. C., & Fransson, C. 1996, ApJ, 456, 811
- Höflich, Langer, & Duschinger (1993) Höflich, P., Langer, N., & Duschinger, M. 1993 A&A, 275, L29
- Hill et al. (1999) Hill, G. C., et al. 1999, IAU Circ., 7186
- Iwamoto et al. (1997) Iwamoto, K., Young, T. R., Nakasato, N., et al. 1997, ApJ, 477, 865
- Jeffery & Branch (1990) Jeffery, D. J, & Branch, D. 1990, in Jerusalem Winter School for Theoretical Physics, Vol. 6, Supernovae, ed. P. Ruiz-Lapuente, R. Canal, & J. Isern (Dordrecht: Kluwer), 659
- Kifonidis et al. (2000) Kifonidis, K., Plewa, T., Janka, H. Th., et al. 2000, ApJ, 531, L123
- Kurucz (1993) Kurucz, R. L. 1993, Kurucz CD-ROM, Atomic Data for Opacity Calculations
- Lewis et al. (1994) Lewis, J. R., Walton, N. A., Meikle, W. P. S., et al. 1994, MNRAS, 266, L27
- Li & McCray (1992) Li, H., & McCray, R. 1992, ApJ, 387, 309
- Li & McCray (1993) Li, H., & McCray, R. 1993, ApJ, 405, 730
- Lucy (1991) Lucy, L. B 1991, ApJ, 383, 308
- Maeda et al. (2000) Maeda, K., Nakamura T., Nomoto, K., et al. 2000, ApJ, submitted (astro-ph/0011003)
- Matheson et al. (2000a) Matheson, T., Filippenko, A. V., Barth, A. J., et al. 2000, ApJ, 120, 1487
- Matheson et al. (2000b) Matheson, T., Filippenko, A. V., Ho, L. C., et al. 2000, ApJ, 120, 1499
- Matheson et al. (2001) Matheson, T., Filippenko A. V., Li, W. D., et al. 2001, AJ, 121, 1648
- Mazzali et al. (1997) Mazzali, P. A., Chugai, N., Turatto, M., et al. 1997, MNRAS, 284, 151
- Mazzali, Iwamoto, & Nomoto (2000) Mazzali, P. A., Iwamoto, K., & Nomoto, K. 2000, ApJ, 545, 407
- Millard et al. (1999) Millard, J., Branch, D., Baron, E., et al. 1999, ApJ, 527, 746
- Nagataki, Shimizu, & Sato (1998) Nagataki, S., Shimizu, T. M., & Sato, K. 1998, ApJ, 495, 413
- Nakano & Sumuto (1996) Nakano, S., & Akoi, M. 1996, IAU Circ., 6524
- Nomoto et al. (1993) Nomoto, K., Suzuki, T., Shigeyama, T., et al. 1993, Nature, 364, 507
- Nomoto, Iwamoto, & Suzuki (1995) Nomoto, K., Iwamoto, K., & Suzuki, T. 1995, Phys. Rep., 256, 173
- Olson (1982) Olson, G. L. 1982, ApJ, 255, 267
- Prabhu et al. (1995) Prabhu, T. P., Mayya, Y. D., Singh, K. P., et al. 1995, A&A, 295, 403
- Podsiadlowski et al. (1993) Podsiaklowski, Ph., Hsu, J. J. L., Joss, P. C., et al. 1993, Nature, 364, 509
- Rybicki & Hummer (1978) Rybicki, G. B, & Hummer, D. G 1978, ApJ, 219, 654
- Saio, Kato, & Nomoto (1988) Saio, H., Kato, M., & Nomoto, K. 1988, ApJ, 331, 388
- Schlegel, Finkbeiner, & Davis (1998) Schlegel, D. J., Finkbeiner, D. P., & Davis, M. 1998, ApJ, 500, 525
- Shigeyama et al. (1990) Shigeyama, T., Nomoto, K., Tsujimoto, T., et al. 1990, ApJ, 361, L23
- Shigeyama et al. (1994) Shigeyama, T., Suzuki, T., Kumagai, S., et al. 1994, ApJ, 420, 341
- Sollerman, Leibundgut, & Spyromilio (1998) Sollerman, J., Leibundgut, B., & Spyromilio, J. 1998, A&A, 337, 207
- Spyromilio (1994) Spyromilio, T. 1994, MNRAS, 266, L61
- Swartz et al. (1993a) Swartz, D. A., Filippenko, A. V., Nomoto, K., et al. 1993, ApJ, 411, 313
- Swartz et al. (1993b) Swartz, D. A., Clocchiatti, A., Benjamin, R., et al. 1993, Nature, 365, 232
- Turatto et al. (1998) Turatto, M., Mazzali, P. A., Young, T. R., et al. 1998, ApJ, 498, L129
- Patat, Chugai, & Mazzali (1995) Patat, E., Chugai, N, & Mazzali, P. A. 1995, A&A, 299, 715
- Qiao et al. (1996) Qiao, Q. Y., Li, W. D., Qiu, Y. L., et al. 1996, IAU Circ., 6527
- Qiu et al. (1999) Qiu, Y. L., Li. W. D., Qiao, Q. Y., et al. 1999, AJ. 117, 736
- Utrobin (1994) Utrobin, V. 1994, A&A, 281, L89
- Utrobin, Chugai, & Adnronova (1995) Utrobin, V., Chugai, N. N., & Adnronova, A. A. 1995, A&A, 295, 129
- Utrobin (1996) Utrobin, V. P. 1996, A&A, 306, 219
- Wang & Hu (1994) Wang, L. F. & Hu, J. Y. 1994, Nature, 369, 380
- Wang & Wheeler (1996) Wang, L., & Wheeler, J. C. 1996, IAU Circ., 6351
- Wang et al. (2001) Wang, L., Howell, D. A., Höflich, P., et al. 2001, ApJ, 550, 1030
- Wheeler & Filippenko (1996) Wheeler, J. C., & Filippenko, A. V. 1996, in Supernova and Supernova Remnants, ed. R. A. McCray & Z. Wang (Cambridge University Press), 241
- Williams (1987) Whilliams, R. E. 1987, ApJ, 320, L117
- Woosley et al. (1994) Woosley, S. E., Eastman, R. G., Weaver, T. A., et al. 1994, ApJ, 429, 300
- Young, Baron, & Branch (1995) Young, T. R., Baron, E., & Branch, D. 1995, ApJ, 449, L51
- Zhang et al. (1995) Zhang, Q., Hu, J. Y., Wang, L. F, et al. 1995, MNRAS, 277, 1115
- Zhang & Wang (1996) Zhang, Q., & Wang, Z. R. 1996, A&A, 307, 166
| Date(UT) | Epoch | ||
|---|---|---|---|
| 1996 Dec 19 | 7/-14 | 11,000 | 10,500 |
| 1996 Dec 22 | 10/-11 | 10,000 | 9,700 |
| 1996 Dec 27 | 15/-6 | 9,000 | 9,300 |
| 1997 Jan 1 | 20/-1 | 8,000 | 10,500 |
| 1997 Jan 5 | 24/+3 | 7,500 | 7,500 |
| 1997 Jan 11 | 30/+9 | 7,000 | 6,200 |
| 1997 Jan 18 | 37/+16 | 7,000 | 5,200 |
| 1997 Jan 27 | 46/+25 | 6,500 | 5,500 |
| 1997 Feb 1 | 51/+30 | 5,000 | 5,000 |
| 1997 Feb 5 | 55/+35 | 5,000 | 5,000 |
| 1997 Feb 19 | 69/+48 | 5,000 | 5,000 |
| 1997 Mar 1 | 80/+59 | 4,500 | 6,000 |
| 1997 Mar 8 | 87/+66 | 4,300 | 6,000 |
| 1997 Mar 18 | 97/+76 | 4,000 | 5,500 |
| 1997 Mar 28 | 107/+86 | 3,000 | 6,400 |