Light Isotope Abundances in Solar Energetic Particles
measured by the
Space Instrument NINA
Abstract
This article reports nine Solar Energetic Particle events detected by the instrument NINA between October 1998 and April 1999. NINA is a silicon-based particle detector mounted on-board the Russian satellite Resurs-01-N4, which has flown at an altitude of about 800 km in polar inclination since July 1998.
For every solar event the power-law 4He spectrum across the energy interval 10–50 MeV n was reconstructed, and spectral indexes, , from 1.8 to 6.8 extracted. Data of 3He and 4He were used to determine the 3He/4He ratio, that for some SEP events indicated an enrichment in 3He. For the 1998 November 7 event the ratio reached a maximum value of , with spectral indexes of = 2.5 0.6 and = 3.7 0.3 for 3He and 4He, respectively. The 3He/4He ratio averaged over the remaining events was .
For all events the deuterium-to-proton ratio was determined. The average value over all events was (3.91.4) 10-5 across the energy interval 9–12 MeV/n. For one event (1998 November 24) this ratio yielded approximately 10 times higher than normal coronal values.
Upper limits on the 3H/1H counting ratio for all events were determined. For the 1998 November 14 SEP event the high flux of heavy particles detected made it possible to reconstruct the carbon and oxygen flux.
1 Introduction
In 1970 Hsieh & Simpson (1970) discovered Solar Energetic Particle (SEP) events with a greatly enhanced abundance of the rare isotope 3He, with the IMP-4 satellite. Following this, many other experiments started to study solar 3He-rich events. In such events the ratio between 3He and 4He is strongly enhanced with respect to solar abundances () measured in the Solar Wind (Coplan et al., 1985; Bodmer et al., 1995). It was subsequently found that in these events abundances of heavy elements were also unusual, with a Fe/O ratio about 10 times the value in the corona [see the review by Reames (1999)].
The first hypothesis suggested that nuclear reactions of accelerated particles in the ambient of the solar atmosphere are the most probable source of 3He. The presence of such reactions was independently confirmed by the detection of the 2.2 MeV neutron-proton recombination -line in solar flares (Chupp et al., 1973). Nowadays, -ray spectroscopy (Mandzhavidze, Ramaty & Kozlovsky, 1999) shows that there is presence of 3He at the flare sites.
It is known that an enormous abundance of 3He in SEPs does not correspond to an overabundance of 2H and 3H. While solar 3He was detected by many observers, solar deuterium and tritium have proven to be very rare and difficult to detect in SEP events (Anglin, 1975; Mewaldt & Stone, 1983; Van Hollebeke, McDonald & Trainor, 1985; McGuire, von Rosenvinge & McDonald, 1986). Measured abundances of 2H and 3H in Solar Energetic Particles are consistent with the thin target model of flares (Ramaty & Kozlovsky, 1974). However, it was shown (Anglin, 1975) that this model could not explain the 1000-fold enhancement in the 3He/4He ratio and also the enrichment of heavy elements. It became clear that selective mechanisms of 3He acceleration were required (Fisk, 1978).
Solar Energetic Particles are now believed to come from two different sources. The SEPs from solar flares have a 1000-fold enhancement in the 3He/4He ratio and an enhanced number of heavy ions with respect to solar abundances because of resonant wave-particle interactions at the flare site, where the ions are highly stripped of orbital electrons by the hot environment. However, the most intense SEP events, with particles of the highest energies, are produced by accelerations at shock waves driven by Coronal Mass Ejections (CMEs). On average, these particles directly reflect the abundances and temperature of ambient, unheated coronal material. Various aspects of gradual and impulsive SEP events have been compared in a variety of review articles (Reames, 1999, and references therein).
Flares and CMEs can occur separately. Most flares are not accompanied by a CME, whereas many fast CMEs that produce gradual SEP events have associated flares. The most interesting events are therefore the ”pure” ones, where the two mechanisms are not acting together and it is easier therefore to distinguish and characterize the acceleration processes involved.
The 3He/4He ratio can be used to characterize the two types of event. 3He/4He 1 is typical in impulsive events, while 3He/4He 0.01 indicates gradual SEP events. However, this ratio is difficult to measure and not available for a large sample of events (Chen, Guzik & Wefel, 1995; Mason, Mazur & Dwyer, 1999). Precise measurements of the 3He/4He ratio can provide new constraints on existing theories that discuss 3He acceleration mechanisms and the propagation processes.
The aim of this article is to present measurements of light isotope abundances in Solar Energetic Particle events detected in the period October 1998 – April 1999 by the instrument NINA. NINA was launched on 1998 July 10 from the Baikonur launch facility, in Kazakhstan, on board of the Russian satellite Resurs-01-N4. The orbit of the spacecraft is sun-synchronous, with an inclination of 98 degrees and an altitude of approximately 800 km. In §2 we describe the instrument briefly, in §3 we discuss the algorithms of event selection and particle identification, and the background analysis. Results are presented in §4, and possible interpretations are given in §5.
2 The instrument
The instrument NINA is optimized for the detection of galactic, solar and anomalous cosmic rays in the energy window 10–200 MeV n-1. It is composed of 16 planes, each made of two n-type silicon detectors, 66 cm2, segmented in 16 strips and orthogonally mounted so to provide the X and Y information of the particle track. The thickness of the first two detectors is 150 m; all the others are 380 m thick, for a total of 11.7 mm of active silicon.
The 16 planes are vertically stacked. The interplanar distance is 14 mm, but the first and second planes are separated by 85 mm, for a better measurement of the particle incident angle. The total telescope height is 29.5 cm. An aluminum layer 300 m thick covers the detector. More details about the detector configuration can be found in Bakaldin et al. (1997); Bidoli et al. (1999, 2001).
A veto system, ensuring the containment of particles entering the detector from above, is implemented by setting in anticoincidence strips 1 and 16 of planes 2 to 15 (Lateral Anticoincidence), and all strips of plane 16 (Bottom Anticoincidence). The request of containment inside the telescope defines the upper energy limits for particle detection, which is equal to about 50 MeV n-1 for 4He.
The threshold for energy deposits in the silicon layers is set to 250 keV (Low Threshold) in order to eliminate all relativistic protons which release only 100 keV in 380 m of silicon. A second threshold, at 2500 keV (High Threshold), further restricts the detection of protons. All results presented in this paper come from data acquired in High Threshold Mode.
3 Data analysis
The study of SEP rare isotope abundances requires a careful analysis of the data collected. The background includes either noise and unidentifiable events, which can be eliminated by an off-line dedicated selection algorithm, and particles produced by secondary interactions in the material surrounding the NINA silicon tower. In order to detect only solar particles, the solar quiet background must be excluded also.
Table 1 shows the energy window of NINA for the atomic species mostly studied during SEP events, in High Threshold configuration. Figure 1 shows the Geometric Factor, GF, for the same isotopes.
3.1 Event selection and mass reconstruction
The optimal performance of NINA in terms of charge, mass and energy determination is achieved by requiring the full containment of the particle inside the detector with the Lateral and Bottom Anticoincidence. Despite the presence of the Lateral Anticoincidence, some particles leave the detector between silicon planes. In order to eliminate this effect, tracks with energy deposits in strips 2 or 15 for any of the layers of the silicon tower are rejected off-line. This requirement reduces the Geometric Factor of the instrument, and this is taken into account in calculations (Figure 1). The segmented nature of the detector, in addition to measuring the total energy released, allows a very precise determination of the topology of the particle’s path inside the instrument. With this information it is possible to build a dedicated off-line track selection algorithm which rejects upward moving particles, tracks accompanied by nuclear interactions, and events consisting of two or more tracks. A detailed description of the selection algorithm can be found in Bidoli et al. (2001).
The background reduction capability of the track selection algorithm was previously tested with beam test data and in the Galactic Cosmic Rays (GCR) analysis. Figure 2 shows plotted against , where is the energy released by the particles in the first silicon detector of the tower NINA, and the total energy released in the whole instrument, for events collected during the 1998 November 7 SEP event, after the application of the track filter. It is evident that almost all background was rejected, whilst only eliminating on average 3% events from the whole sample. This is evidence of small background contamination in SEPs.
Charge and mass identification procedures are applied to events which survive the track selection algorithm. The mass M and the charge Z of the particles are calculated in parallel by two methods, in order to have a more precise particle recognition: one method uses the residual range, while the other uses an approximation of the Bethe-Bloch theoretical curve (Bidoli et al., 2001).
For a more complete rejection of the background, only particles with the same final identification according to the two methods are selected. Finally, a cross-check between the experimental range of the particle in the detector and the expected value according to the simulations gives a definitive consistency test for the event. These consistency cuts eliminate about 0.1% of tracks detected during SEP events.
3.2 Background estimations
As anticipated above, in order to study rare isotope abundances (2H, 3H, 3He) in the analysis of SEPs it is necessary to subtract the solar quiet background. Secondary productions inside the instrument induced by high energy solar particles must also be accounted for.
Solar quiet background
This includes primary galactic particles (only 2H and 3He), and secondary 2H, 3H and 3He which are produced by nuclear interactions of primary cosmic rays inside the of aluminum which cover the first silicon plane of NINA.
We measured this background component during passes over the polar caps in solar quiet periods; the average counting rate was events s-1 for deuterium, events s-1 for tritium, and events s-1 for 3He, each of them relative to the energy interval reported in Table 1.
Secondary production by SEPs
The amount of secondary productions inside the instrument, induced by interactions of solar particles, cannot be directly measured but can be inferred by estimations.
The most important reactions which can produce secondary 2H, 3H and 3He are the interactions of protons and -particles with the aluminum cover:
-
1.
-
2.
The ratio between secondary 3He and primary 4He nuclei, considering reaction 1. and 2., is given by:
| (1) |
where and are the cross sections for the reaction 1. and 2. respectively, and and the integral fluxes of incident protons and particles with sufficient energy to produce a secondary 3He detectable by NINA (E MeV, E MeV n-1). is the Avogadro number, the thickness of the aluminum cover, the density of aluminum and its atomic weight.
To give an estimation of the 3He secondary production in NINA, we adopt a value of = 30 mb (Segel et al., 1982; Michel et al., 1995) and = 100 mb, as taken by the authors in (Chen, Guzik & Wefel, 1995). Eq. 1 then becomes:
| (2) |
is directly measured by our instrument. In order to evaluate we need to propagate the proton flux, that we measure in the energy interval 12–14 MeV, to higher energies utilizing the proton spectral index from IMP-8111http://nssdc.gsfc.nasa.gov/space/space-physics-home.html..
Table Light Isotope Abundances in Solar Energetic Particles measured by the Space Instrument NINA reports the values of estimated for the nine SEP events considered. The background coming from estimations by eq. 2 is less than 10% of the solar quiet background, except for one case (1998 November 14) where an additional analysis was needed.
Similar calculations of the ratio between secondary 2H and primary 1H nuclei, and between secondary 3H and primary 1H nuclei, give a result of .
3.3 Dead time of the instrument
During Solar Energetic events the counting rate is orders of magnitude higher than during solar quiet periods, so the dead time of the instrument can have an important effect on flux measurements.
The time resolution of the trigger system in NINA is about 2 s. If a particle produces a trigger, the signal from the detectors is amplified and shaped before being sampled by an ADC. The event is then stored in a FIFO for 2 ms. The data are read by the on-board processor, which performs pedestal subtraction and zero suppression for each channel, and then are stored in the memory. This procedure takes 10 ms.
In order to estimate the dead time of the instrument, Monte Carlo simulations of the performance of the data acquisition system were carried out, assuming a Poisson distribution of the particle fluxes. Figure 3 shows the ratio between the estimated dead time and the observational time of the instrument as a function of the measured rate. This ratio is fitted with an exponential function and the parameters of the fit have been used in the exposure time program (see §3.4). The uncertainty on the fit parameters is of the order of 10%, and this yields a maximal inaccuracy of 2% on the exposure time calculations for all the SEP events analyzed.
3.4 Flux measurements
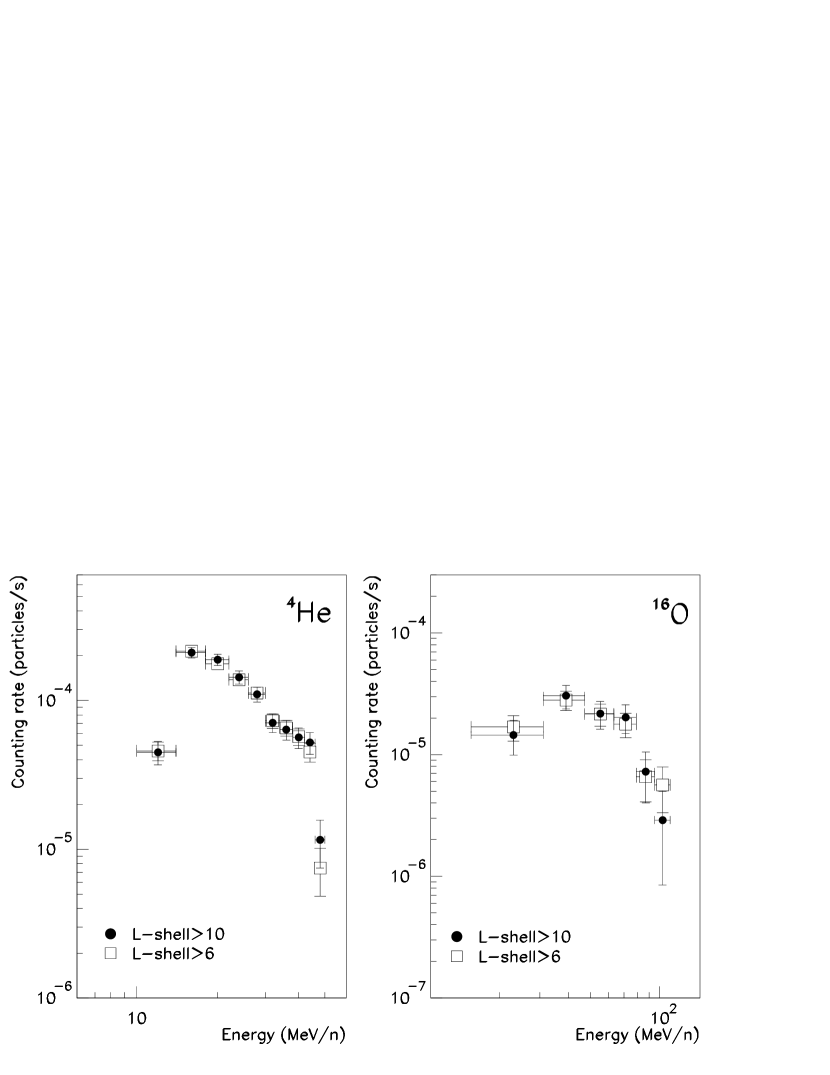
To be free from the effects of the rigidity cut-off due to the Earth’s magnetic field, only events recorded in polar regions at L-shell have been considered for SEP analysis. Figure 4 shows the counting rate of 4He and 16O, as a function of energy, detected at two different geomagnetic latitudes. The acquisition rate does not vary between the cut L-shell 6 and 10.
Particle fluxes were reconstructed according to the following formula:
where is the number of particles detected with an energy between and , is the exposure time in orbit, which takes into account also the dead time of the instrument, is the average value of the Geometrical Factor between and (see Figure 1), and is the relevant energy bin.
4 SEP measurements
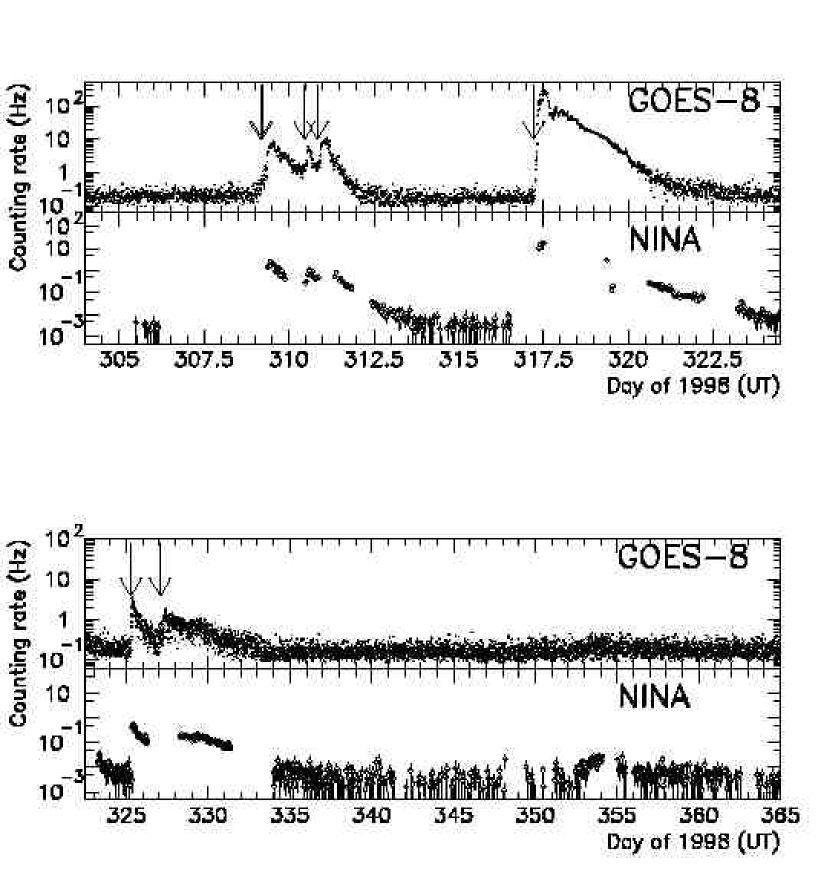
SEP events were identified by an unpredictable increase in the trigger rate of the instrument, at least one order of magnitude with respect to the averaged solar quiet values. Nine such increases in the period October 1998 – April 1999 have been chosen for analysis. To illustrate them, Figure 5 shows the counting rate of protons with energy of 10 MeV as a function of time measured by NINA in this period, together with the GOES-8 proton intensity (energy 10 MeV)222http://www.sel.noaa.gov/Data/goes.html.
A summary of all nine events observed by NINA is presented in Table Light Isotope Abundances in Solar Energetic Particles measured by the Space Instrument NINA, together with characteristics of the solar events that can be associated to the SEPs333gopher://solar.sec.noaa.gov:70/11/indices.. The event of 1998 November 14 was the most powerful, where the counting rate increased of almost 3 orders of magnitude with respect to solar quiet periods, reaching a value of 70 Hz. Figure 5 indicates that the event lasted several days and was detected by our instrument in two separate emissions (Table Light Isotope Abundances in Solar Energetic Particles measured by the Space Instrument NINA). For the other events we registered increases of one or two orders of magnitude on average. The events of 1998 November 6-7-8 and those of 1999 January 20-22 occurred in a very close period of time, and there might be effects of superposition between events. However, as it will be shown later, their spectral characteristics and isotopic composition are very different. For this reason we believe that these SEPs may have a different origin and we studied their characteristics separately. As evident in Figure 5, all chosen events are in good correlation with GOES-8 observations.
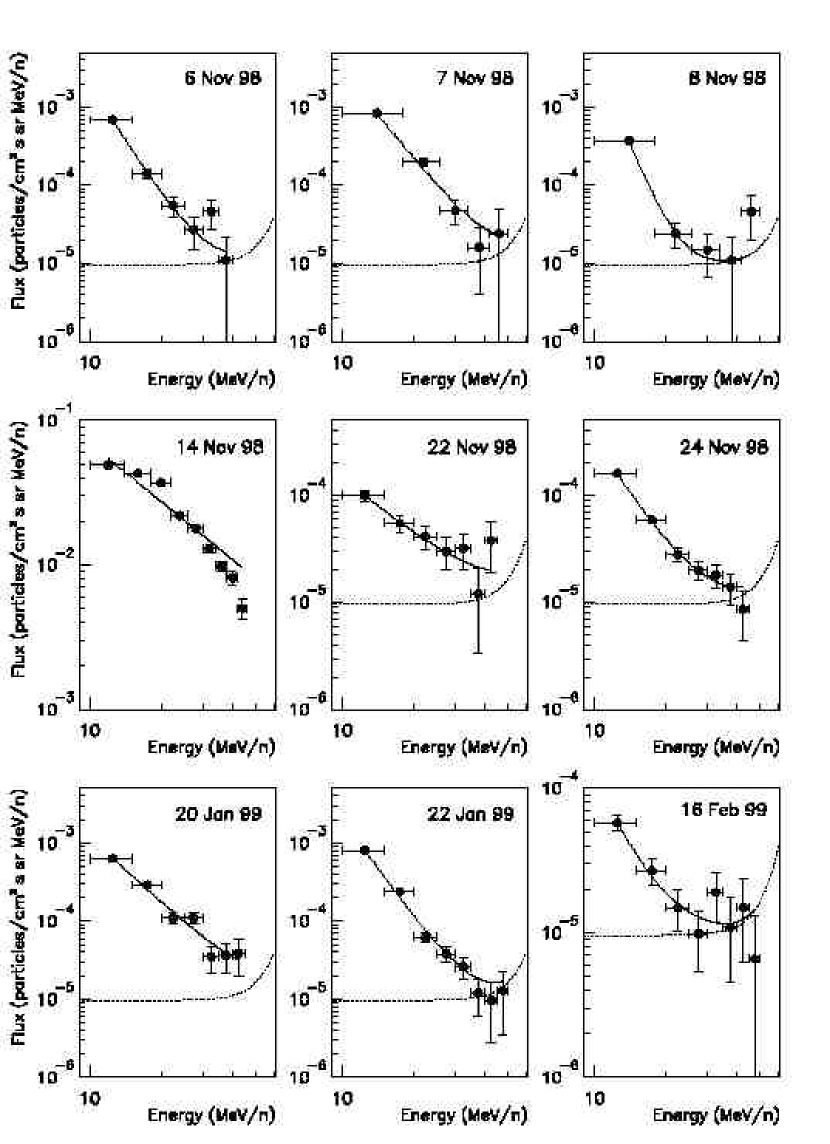
4He observations range from 10 to 50 MeV n-1. Figure 6 presents the 4He fluxes that were reconstructed during every SEP event. The dashed line on the spectra is a fit of the solar quiet galactic background of 4He, measured by our own instrument (Bidoli et al., 2001). Data of the galactic background, in our energy range, are well reproduced by the function:
| (3) |
The energy spectrum during the SEP events was fitted by a power-law component plus the background (solid line):
| (4) |
The value of (spectral index) for each event is reported in Table Light Isotope Abundances in Solar Energetic Particles measured by the Space Instrument NINA. It varies considerably from event to event, ranging from 1.8 in the 1998 November 14 event to 6.8 in the 1998 November 8 event. It is interesting to notice that the 1998 November 6 and 1998 November 7 events occur in the same NOAA region (see Table Light Isotope Abundances in Solar Energetic Particles measured by the Space Instrument NINA) but present different values of the spectral index. The same holds for the 1998 November 22 and 1998 November 24 SEP events, in contradiction to observations by Chen, Guzik & Wefel (1995) with the CRRES satellite, where events in the same NOAA region tended to have similar spectral indexes.
Table Light Isotope Abundances in Solar Energetic Particles measured by the Space Instrument NINA summarizes measurements of the ratio (3HeSEP - 3HeBG)/4He in the range 15–45 MeV n-1 for the nine SEP events, where 3HeSEP represents the total flux of 3He which was measured during the SEP events, and 3HeBG the estimation of its overall background, as discussed in section 3.2. During the 1998 November 7 and 14 SEP events this ratio is 3 standard deviations more than the solar coronal value.
For the 1998 November 7 SEP event we reconstructed the masses of 3He and 4He (Figure 7), and it was possible to plot the 3He differential energy spectrum over a wide energy interval (Figure 8). The 3He spectrum, also fitted by a power-law, is slightly harder ( = 2.5 0.6) than that of 4He ( = 3.7 0.3). This implies that the 3He/4He ratio increases with energy in this event. This tendency is also confirmed by a comparison between our data and measurements taken on board ACE [ULEIS instrument, (Mason, Mazur & Dwyer, 1999)] over the energy range 0.5–2.0 MeV n-1 and averaged over the period 1998 November 6–8. Extrapolating the 3He energy spectrum measured by NINA to lower energies, the inferred 3He/4He ratio for this SEP event would be about , in agreement with their value and much lower that what we obtain at higher energies.
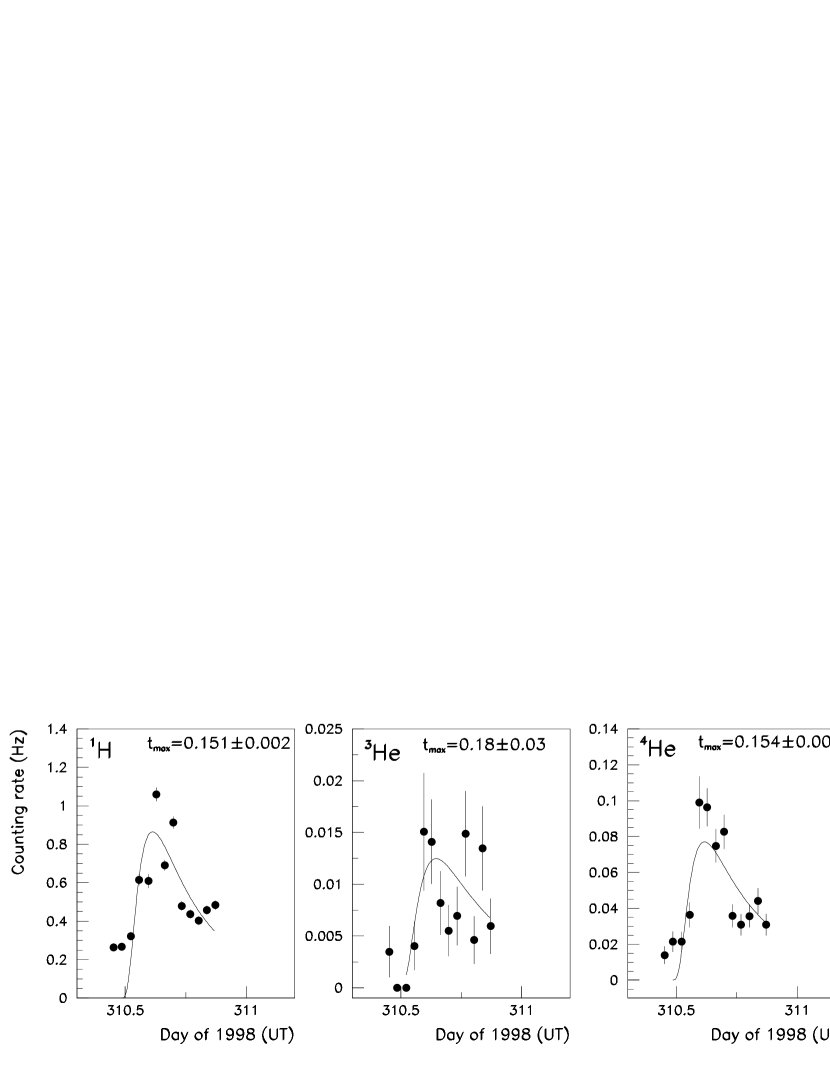
For the 1998 November 7 SEP event we reconstructed the emission time profiles of different nuclei. Figure 9 shows the time profile of the counting rate of 1H, 3He and 4He detected over the polar caps during this event. Every point on the plots corresponds to a passage over the pole, which lasted about 10 minutes. The profiles have been fitted by the following function, which takes into account both propagation in the solar corona and the diffusion of particles to the Earth (Burlaga, 1967):
| (5) |
where t is expressed in days (UT), corresponds to the beginning of the 1998 November 7 event, and A and tmax are the two parameters of the fit. Direct propagation from Sun to Earth takes, for 10 MeV n-1 particles, roughly 1 hour. Taking into account this value, and assuming that the main part of the particle emission occurs before tmax, we estimate the time for coronal propagation for the three nuclear species to be not more than 3 hours. This similarity suggests the same acceleration and transport mechanisms for the nuclear species, despite their different charge-to-mass ratio.
The strongest solar event that we detected, as already mentioned, was the one of 1998 November 14. Due to the very high flux intensities, which increased the noise of the detector, the 3He spectrum was reconstructed only by nuclei which crossed at least 7 silicon layers in the instrument, so having energies greater than 25 MeV n-1. Figure 10 shows the helium isotope mass reconstructions for tracks with at least 7 views hit. Figure 11 presents the energy spectrum of 3He and 4He together. On the same figure 4He measurements from SIS on board ACE are also reported444http://www.srl.caltech.edu/ACE/ASC/level2.. For the 1998 November 14 event there are other measurements of the 3He/4He ratio, performed by the IMP-8 (Dietrich & Lopate, 1999) and SIS instrument (Cohen et al., 1999). Their measured values are R = 0.02 0.01 in the energy interval 30–95 MeV n-1, and R = 0.005 in the range 8–14 MeV n-1.
During the 1998 November 14 SEP event there was also a strong presence of heavy elements. Figure 12 presents the mass reconstructions and the differential energy spectra for carbon and oxygen.
The High Threshold mode allowed the observation of hydrogen with its isotopes over the narrow energy windows shown in Table 1. Table Light Isotope Abundances in Solar Energetic Particles measured by the Space Instrument NINA presents the ratios between the deuterium and proton fluxes after background subtraction, in the range 9–12 MeV n-1. Since the two isotope measurements span two different energy regions (see Table 1), we measured the proton flux in the range 11-16 MeV and utilized the proton spectral index from IMP-8555http://nssdc.gsfc.nasa.gov/space/space-physics-home.html. to extrapolate the proton flux to the deuteron energy region. The ratio 2H/1H has an average value of about for all events; this value is in agreement with a previous measurement (Anglin, 1975), which reported a 2H/1H ratio equal to between 10.5 and 13.5 MeV n-1, when averaged over a large number of SEP events, consistent with solar abundance values (McGuire, von Rosenvinge & McDonald, 1986).
In the 1998 November 24 event the deuterium emission was more intense, with a deuterium-to-proton ratio equal to , almost 10 times higher than the coronal value. Figure 13 presents the counting rate of deuterium during the months November–December 1998. To produce this figure, a technique that first calculates the time interval T covering a fixed number N of successive events of deuterium was used. The counting rate is then equal to: (N-1)/(T-), where is the dead time which also includes the time spent outside the polar regions. The counting rate is determined sequentially for each event, and assigned to the time when the first event was recorded (Efremova, Ozerov, & Khodarovich, 1997). In Figure 13 we have chosen N=7. Due to background conditions two days, in correspondence to the 1998 November 14 event, were excluded from the analysis.
In Figure 13 a peak of counting rate is visible, in possible correlation with the 1998 November 24 SEP event. Figure 14 shows the mass reconstruction of hydrogen isotopes for this event (right) together with the distribution of the 1998 November 6 event (left). These two SEP events correspond to the maximum and the minimum of the deuterium detection respectively.
From our data it was possible to estimate upper limits for tritium. The last column of Table Light Isotope Abundances in Solar Energetic Particles measured by the Space Instrument NINA presents the ratio of counting rates of 3H in the interval 6–10 MeV n-1, and of 1H in the range 10–14 MeV.
5 Discussion
The isotope abundance ratio and the energy spectra of SEPs are related to the acceleration mechanisms and propagation processes involved.
Among the nine 3He/4He ratios calculated from our SEP events, only the 1998 November 7 one is clearly above the limit 3He/4He 0.1, which is the the boundary value separating gradual from impulsive events (Reames, 1999). The energy spectra and counting rate profiles of 3He and 4He during this event were presented in Figure 8 and 9, and partially discussed in the previous section. By using the IMP-8 spacecraft data666http://nssdc.gsfc.nasa.gov/space/space-physics-home.html. it is possible to also extract the average value of the proton spectral index, , equal to (3.6 0.1) in the energy range 11–74 MeV. This value is practically the same as the 4He spectral index (see Table Light Isotope Abundances in Solar Energetic Particles measured by the Space Instrument NINA) measured by NINA for this SEP event.
The energy spectra of Solar Energetic Particles measured at 1 AU can be modified, with respect to the emission spectra, by propagation effects. The absolute value of the mean free paths of particles traveling from the Sun to the Earth can vary by one order of magnitude between individual events, but, as shown in Dröge (2000), the shape of the rigidity dependence does not vary. This rigidity dependence is a power-law with a slope equal to 0.3 in NINA’s rigidity intervals. Since the 3He rigidity, at the same energy per nucleon, is between that of proton and 4He, it would be difficult in the 1998 November 7 SEP event to explain the hardness of the 3He spectrum compared to that of 4He and of protons only with diffusion effects from the Sun. The differences in the spectral shapes of 3He and 4He, observed at 1 AU in this event, most probably already existed during the SEPs emission.
Models of stochastic acceleration of Solar Energetic Particles near the Sun predict a monotonically increase in the 3He/4He ratio with the energy, as we observe in this SEP event, with rigidity-dependent spatial and energy diffusion coefficients (Möbius, Scholer, Hovestadt, Klecker & Gloecker, 1982; Mazur, Mason, Klecker & McGuire, 1992). Any model dependence on the particle rigidity effects the spectral shapes of particles according to their charge-to-mass ratio. This is not observed in the 1998 November 7 event. Propagation effects in the corona appear to be small in this case and the differences between the energy spectra of 3He and 4He could reflect differences in the spectra at the source.
Acceleration processes based on the shock drift mechanism can accelerate particles up to 100 MeV n-1. Such models predict a power-law energy spectra of ions with a mean value of the spectral index between 3.5 and 4.5 (Anastasiadis & Vlahos, 1994). In the framework of this model it would be hard to explain the differences observed between the 3He and 4He energy spectra and especially the low value of the 3He index in this SEP event.
Wave resonance is hence the most likely mechanism for 3He acceleration in the 1998 November 7 SEP event (Roth & Temerin, 1997). This mechanism accelerates both 3He and heavy ions. The abundance of heavy and 3He ions is determined by the temperature and density of the flare plasma, and by the wave properties. It is interesting to note that data reported by ACE (Klecker et al., 1999) identify this SEP event as gradual by the low Fe/O ratio. In this work the ionic charge of several heavy ions, including iron, was determined. These measurements at low energy (0.2–0.7 MeV/n) are consistent with an equilibrium plasma temperature of 1.3–1.6 K and with typical solar wind values, suggesting acceleration from a solar wind source. With a plasma temperature of 2 MK Roth & Temerin (1997) predict the existence of a large population of oxygen at the same energy per nucleon as 3He, which was not observed by our instrument. Another possible reason for the discrepancy between this event characteristic measured by the two instruments is the narrow cone of emission for particles from 3He-rich events (Reames, Kallenrode and Stone, 1991). It would be interesting to confront our measured spectral behaviour of 3He and 4He with the predictions of this model, but complete spectral calculations are not yet available.
Some observations reported, already since 1970 (Hsieh & Simpson, 1970; Webber et al., 1975), that a small 3He enrichment is also present in large events. Due to instrumental limitations of most of the experiments in space, however, systematic 3He/4He measurements in large events with small 3He enrichment were not available. More recently, Chen, Guzik & Wefel (1995) analyzed 16 SEP events and found that even extremely large SEP events had a value of 3He/4He greater than 0.5% - one order of magnitude greater than solar wind values. This evidence was reported also by Mason, Mazur & Dwyer (1999), who observed 12 large SEP events with an average value of 3He/4He about .
To explain this enrichment, Mason, Mazur & Dwyer (1999) suggest that residual 3He from impulsive SEP events forms a source material for the 3He seen in some large SEP events. In such cases, the 3He is accelerated out of this interplanetary suprathermal population by the same process that energizes other particles at these energies, namely the interplanetary shock.
Our 3He/4He ratio measurements, reported in Table Light Isotope Abundances in Solar Energetic Particles measured by the Space Instrument NINA, seem to confirm the fact that in all SEP events there is a quantity of 3He greater than that typical of solar coronal values (3He/4He about ). If we average the 3He/4He ratio over all events detected by NINA, except the 1998 November 7–8 which is clearly 3He-enriched, we obtain the value .
Nuclear interactions in acceleration regions can also contribute to the high value of the ratio 3He/4He, with respect to coronal values. As stated in the introduction, at flare physical sites the possible presence of secondary particles from nuclear interactions (Ramaty & Murphy, 1987) should not be excluded. Such interactions also produce 3H and 2H, which are the signature of the process. From -ray spectroscopy there is evidence for the presence of 3He and 2H at the flare sites (Mandzhavidze, Ramaty & Kozlovsky, 1999; Chupp, 1983; Terekhov et al., 1993). Usually all secondary particles are trapped in the flare loops but some of them can escape into the interplanetary space.
Particles escaping from Sun during acceleration traverse a small amount of material and do not undergo many interactions. It is therefore difficult to separate solar deuterium particles from the galactic and instrumental background. In our measurements the values of the deuterium flux are close to the instrumental limit. For most of the SEP events there was not an appreciable quantity of 2H, and in some cases we could determine only upper limits on the ratio 2H/1H (see Table Light Isotope Abundances in Solar Energetic Particles measured by the Space Instrument NINA). The average value of this ratio, over all our events, is equal to 2H/1H , which corresponds to about 0.1 g cm-2 thickness of traversed material, for protons with energy about 30 MeV (Ramaty & Kozlovsky, 1974, Figure 10 therein). This thickness gives a 3He/4He ratio of about 10-3, that is lower than our average value. However, it should be noted that the 2H/3He ratio measured by probes in the interplanetary space may be depressed by a factor 10 due to differences in 2H and 3He angular distribution and propagation processes (Colgate, Auduouze & Fowler, 1977). A theoretical analysis of this ratio depends on the solar flare model used, which is still very controversial, and beyond the scope of this paper.
In 1998 November 24 SEP event the 2H/1H ratio was about 10 times higher than the solar corona abundance ratio, and also above the secondary production estimations. This quantity of deuterium cannot be explained by the thin target model because the amount of estimated traversed material would stop a 5–10 MeV n-1 deuterium due to energy losses. Despite the secondary production estimations suffer from uncertainties, due to the uncertainty in the cross sections and possible fluctuations in the galactic background, we have some arguments that exclude an under-estimation of the background and confirm a solar origin for the measured deuterium:
-
(i)
the peak in 2H count rate in the 1998 November 24 SEP event does not correspond to a peak in the high energy proton and count rates. Such particles are the main source of background production in our instrument;
-
(ii)
the 3He/4He ratio measured by NINA in the 1998 November 6, November 14 and 1999 January 20 SEP events are consistent with other measurements (Mason, Mazur & Dwyer, 1999; Cohen et al., 1999). This suggests that we do not have a higher level of secondary 3He background, and therefore of deuterium, in our measurements.
Following the hypothesis reported by Mason, Mazur & Dwyer (1999) it could be suggested that the deuterium observed by NINA on 1998 November 24 was produced in previous impulsive events, and remained in the low corona before being erupted and accelerated, in the same way as 3He. This suggestion is supported by observations of the Tibet solar neutron telescope, which observed possible solar neutrons in association with the flare of 1998 November 23 (Hoshida et al., 1999). It is known that the mechanism producing neutrons also concerns deuterium synthesis. In association with this, Yoshimori, Shiozawa & Suga (1999) reported gamma ray lines observed during the 1998 November 22 event at the same NOAA region as for our 1998 November 24 SEP event. Taking into account these facts we suggest that some deuterium was produced during November 22 and 23, a part of it erupted, was accelerated and arrived at 1 AU in the next days.
In secondary production, the 2H/3He ratio is expected to be between 1 and 2, as inferred from data in the work by Colgate, Auduouze & Fowler (1977). The angular dependence of secondary products is not important because the time between production and emission is long enough to make the flux of secondaries isotropic. In the 1998 November 24 event a 3He enrichment was perhaps also present (Table Light Isotope Abundances in Solar Energetic Particles measured by the Space Instrument NINA). The ratio 2H/3He measured by NINA was of order unity, as expected. Unfortunately, due to limited statistics, we cannot study this ratio in more detail.
In conclusion, the presence of deuterium in SEPs, coming from secondary interactions in the solar ambient, suggests that part of the 3He contents in large Solar Energetic Particle events may also have this origin.
6 Summary
We have determined the 3He/4He ratio and helium energy spectra over the energy range 10–50 MeV n-1 for 9 SEP events measured in the period October 1998 – April 1999 by the instrument NINA. The most interesting of these events was recorded on 1998 November 7, where the ratio reached a value of about 30% but also presented features typical of a ”pure” gradual event (Klecker et al., 1999). The similarity of the time profiles for the 1H, 3He and 4He emissions in the event implies that these isotopes underwent the same acceleration mechanism.
The other SEP events yield an average value of the 3He/4He ratio slightly higher that that typical of the solar wind. During the 1998 November 24 events we most probably detected solar deuterium, with a 2H/1H ratio about 10 times more than expected solar values in the energy range 9–12 MeV n-1. The average value of the 2H/1H ratio, over all our events, is equal to 2H/1H . The presence of deuterium in SEP events, coming from secondary interactions in the solar ambient, suggests that part of the 3He contents in Solar Energetic Particles may also have this origin.
References
- Anastasiadis & Vlahos (1994) Anastasiadis, A. & Vlahos, L. 1994, ApJ, 428, 819.
- Anglin (1975) Anglin, J. D. 1975, ApJ, 198, 733.
- Bakaldin et al. (1997) Bakaldin, A., et al. 1997, Astrop. Phys., 8, 109.
- Bidoli et al. (1999) Bidoli, V., et al. 1999, Nucl. Instr. Methods Phys. Res., A 424, 414.
- Bidoli et al. (2001) Bidoli, V., et al. 2001, ApJS, 132, 365.
- Bodmer et al. (1995) Bodmer, R., et al. 1995, Space Science Revs., 72, 61.
- Burlaga (1967) Burlaga, L. F. 1967, J. Geophys. Res., 72, 17, 4449.
- Chen, Guzik & Wefel (1995) Chen, J., Guzik, T. G., & Wefel, J. P. 1995, ApJ, 442, 875.
- Chupp et al. (1973) Chupp, E. L., et al. 1973, Nature, 241, 333.
- Chupp (1983) Chupp, E. L. 1983, Sol. Phys., 85, 383.
- Cohen et al. (1999) Cohen, C., et al. 1999, Geophys. Res. Lett., 26, 17, 2697.
- Colgate, Auduouze & Fowler (1977) Colgate, S. A., Audouze, J., & Fowler, W. A. 1977, ApJ, 213, 849.
- Coplan et al. (1985) Coplan, M. A., et al. 1985, Sol. Phys., 93, 415.
- Dietrich & Lopate (1999) Dietrich, W., & Lopate, C. 1999, Proc. 26 Int. Cosmic-Ray Conf. (Salt Lake City), 6, 71.
- Dröge (2000) Dröge, W. 2000, ApJ, 537, 1073.
- Efremova, Ozerov, & Khodarovich (1997) Efremova, Y. , Ozerov Y., & A. Khodarovich 1997, Instruments and Experimental Techniques, 40, 4, 467.
- Fisk (1978) Fisk, L. A. 1978, ApJ, 224, 1048.
- Hoshida et al. (1999) Hoshida, T., et al. 1999, Proc. 26 Int. Cosmic-Ray Conf. (Salt Lake City), 6, 38.
- Hsieh & Simpson (1970) Hsieh, K. C., & Simpson, J. A. 1970, ApJ, 1962, L191.
- Klecker et al. (1999) Klecker, B, et al. 1999, Proc. 26 Int. Cosmic-Ray Conf. (Salt Lake City), 6, 83.
- Mandzhavidze, Ramaty & Kozlovsky (1999) Mandzhavidze, N., Ramaty, R. & Kozlovsky, B. 1999, ApJ, 518, 918.
- Mason, Mazur & Dwyer (1999) Mason, G. M., Mazur, J. E. & Dwyer, J. R. 1999, ApJ, 525, L133.
- Mazur, Mason, Klecker & McGuire (1992) Mazur, J. E., Mason, G. M., Klecker, B. & McGuire, R. E. 1992, ApJ, 401, 398.
- McGuire, von Rosenvinge & McDonald (1986) McGuire, R. E., von Rosenvinge, T. T., & McDonald, F. B. 1986, ApJ, 301, 938.
- Mewaldt & Stone (1983) Mewaldt, R. A., & Stone, E. C. 1983, Proc. 18 Int. Cosmic-Ray Conf. (Bangalore), 4, 52.
- Michel et al. (1995) Michel, R., et al. 1995, Nucl. Instr. Methods Phys. Res., B 103, 183.
- Möbius, Scholer, Hovestadt, Klecker & Gloecker (1982) Möbius, E., Scholer, M., Hovestadt, D., Klecker, B. & Gloecker, G. 1982, ApJ, 259, 397.
- Ramaty & Kozlovsky (1974) Ramaty, R., & Kozlovsky, B. 1974, ApJ, 193, 729.
- Ramaty & Murphy (1987) Ramaty, R., & Murphy, R. J. 1987, Space Science Revs., 45, 213.
- Reames, Kallenrode and Stone (1991) Reames, D. V., Kallenrode, M. -B., & Stone, R. G. 1991, ApJ, 380, 287.
- Reames (1999) Reames, D. V. 1999, Space Science Revs., 90, 413.
- Roth & Temerin (1997) Roth, I., & Temerin, M. 1997, ApJ, 477, 940.
- Segel et al. (1982) Segel, R. E., et al. 1982, Phys. Rev. C, 26, 6, 2424.
- Terekhov et al. (1993) Terekhov, O. V., et al. 1993, Astron. Lett., 19 (2), 65.
- Van Hollebeke, McDonald & Trainor (1985) Van Hollebeke, M. A., McDonald, F. B., & Trainor, J. H. 1985, Proc. 19 Int. Cosmic-Ray Conf. (Paris), 4, 209.
- Webber et al. (1975) Webber, W. R., et al. 1975, ApJ, 199, 482.
- Yoshimori, Shiozawa & Suga (1999) Yoshimori, M., Shiozawa, A. & Suga, K. 1999, Proc. 26 Int. Cosmic-Ray Conf. (Salt Lake City), 6, 1.
| Particle | Z | Energy window |
|---|---|---|
| (MeV n-1) | ||
| 1H | 1 | 11 - 16 |
| 2H | 1 | 7 - 13 |
| 3H | 1 | 5 - 12 |
| 3He | 2 | 12 - 58 |
| 4He | 2 | 10 - 50 |
| 12C | 6 | 18 - 90 |
| 16O | 8 | 21 -107 |
| SEP date | Observation time | NOAA | Class | Location | Time of X-ray |
|---|---|---|---|---|---|
| (X-ray/H) | event (UT) | ||||
| 6 Nov. 1998 | 309.38 310.52 | 8375 | C1.1 / SF | N19W25 | 04:38 |
| C1.4 / SF | 04:56 | ||||
| 7 Nov. 1998 | 310.52 310.89 | 8375 | M2.4 /- | - | 11:06 |
| 8 Nov. 1998 | 311.34 311.87 | 8379 | C2.4 / SF | S20W67 | 20:20 (7 Nov.) |
| 14 Nov. 1998 | 317.36 317.54 | 8385 | C1.7 / BSL | N28W90 | 05:18 |
| 320.60 322.25 | |||||
| 22 Nov. 1998 | 325.32 326.33 | 8384 | X3.4 / 1N | S27W82 | 06:42 |
| 24 Nov. 1998 | 328.30 331.14 | 8384 | X1.0 / - | - | 02:20 |
| 20 Jan. 1999 | 19.96 21.93 | - | M5.2 / - | - | 20:04 |
| 22 Jan. 1999 | 21.93 23.90 | 8440 | M1.4 / SF | N19W44 | 17:24 |
| 16 Feb. 1999 | 46.23 48.04 | 8458 | M3.2 / SF | S23W14 | 03:12 |
Note. — Second column: NINA observation time (day of the year) for the SEP event. Third column: NOAA region number of the associated flare. Fourth column: importance of the flare in terms of X-ray/H classification. Fifth column: location of the flare in heliocentric coordinates. Sixth column: starting time (hh:mm) of the X-ray event.
References. — gopher://solar.sec.noaa.gov:70/11/indices.
| SEP date | §§Energy: 10–50 MeV n-1 | 4He/1H ♭♭Energy: 12–14 MeV n-1 | R(3He/4He) | 3He/4He ††3He = 3HeSEP - 3HeBG; Energy: 15–45 MeV n-1 | 2H/1H ♯♯Energy: 9–12 MeV n-1 | 3H/1H ‡‡Energy: 9–12 MeV n-1 |
|---|---|---|---|---|---|---|
| 6 Nov. 1998 | 6.5 4.3 | 5.0 | 1 | |||
| 7 Nov. 1998 | 33 0.6 | 3.4 6.1 | 2 | |||
| 8 Nov. 1998 | 23 10 | 5.3 11.1 | 14 | |||
| 14 Nov. 1998 | 1.1 0.3 ♢♢Energy 25 MeV n-1. | 1.7 2.3 | 50 | |||
| 22 Nov. 1998 | 2.8 | 5.1 9.0 | 9 | |||
| 24 Nov. 1998 | 4.1 3.2 | 35 1.4 | 7 | |||
| 20 Jan. 1999 | 0.3 0.6 | 3.5 2.8 | 6 | |||
| 22 Jan. 1999 | -0.1 0.6 | 0.7 1.1 | 3 | |||
| 16 Feb. 1999 | -0.1 8.0 | 37 80 | 90 |