Molecular gas and dust in NGC 4550
We report the detection of M⊙ of molecular gas in the central region of the S0/E7 galaxy NGC 4550, inferred from observations of CO(1–0) emission. Dust is detected in HST WFPC2 images and found to be asymmetrically distributed around the nucleus, only extending to a galactocentric distance of 7′′ (600 pc). The shape of the CO emission profile is consistent with a molecular gas distribution following the dust. The distribution of the dust and gas in the center could be the result of an instability, which is the fastest growing unstable mode in counterrotating stellar disks. On a global scale the molecular gas in NGC 4550 is stable against gravitational collapse but nevertheless star formation appears to be ongoing with normal star formation efficiency and gas consumption time scales. The stellar velocity dispersion in NGC 4550 resembles that of elliptical galaxies. It is therefore likely that a hot X-ray emitting plasma limits the lifetime of the molecular gas, that must arise from a recent (1 Gyr) accretion event.
Key Words.:
interstellar medium: dust, extinction – interstellar medium: molecules – galaxies: elliptical and lenticular, cD – galaxies: individual: NGC 4550 – galaxies: structure1 Introduction
While counterrotating stellar systems are quite common among elliptical galaxies, counterrotating stellar disks are very rare. Despite dedicated searches (cf. Kuijken et al. 1996), there are only two known galaxies with large counterrotating stellar disks; NGC 4550 (Rubin et al. 1992) and NGC 7217 (Merrifield & Kuijken 1994). There are a few cases which do contain counterrotating stellar disk components, but where the secondary component is much less extended than the primary one and is confined to the central region: NGC 3593 (Bertola et al. 1996), NGC 4138 (Jore et al. 1996) and NGC 7331 (Prada et al. 1996). On the other hand Bertola et al. (1992) and Kuijken et al. (1996) report that 20–25% of all gas disks found in S0 galaxies counterrotate with respect to the stars. If this gas would form stars in such numbers, that more than 5% of the stellar disks were counterrotating, a much higher fraction of galaxies with counterrotating stellar components would be observed.
The most prominent example of a galaxy with two counterrotating stellar disks is NGC 4550, an S0/E7 galaxy in the Virgo cluster, which contains two exponential stellar disks with approximatively the same scale length and central surface brightness (Rix et al. 1992). One of the disks also contains a small amount of ionized gas (Rubin et al. 1992). The stellar disk corotating with the ionized gas has a slightly higher velocity dispersion and lower maximum rotational velocity than the stellar disk counterrotating with respect to the gas (Rix et al. 1992). Recent results by Faundez et al. (2000) also suggest that the disk containing gas is sligthly more massive, more vertically extended and dynamically hotter than the other. The equivalent widths of the Ca H and K features are the same for the two disks and similar to those found in elliptical galaxies, suggesting that the stellar disks are old and approximately coeval (Rix et al. 1992). NGC 4550 contains a low luminosity active galactic nucleus (AGN), seen through broad (104 km s-1) and double-peaked emission lines (Ho et al. 2000).
Is the origin of the massive counterrotating stellar disk in NGC 4550 different from that of the numerous less massive counterrotating gaseous (and in some cases stellar) disks seen in other galaxies? Misaligned angular momentum axes are considered to be clear signatures of merging (cf. Thakar & Ryden 1996; Thakar et al. 1997). Strong disk mergers usually lead to the destruction of the disks and the formation of elliptical systems. Recently, however, Pfenniger (1999) has shown that similarly sized disks, but with oppositely aligned angular momentum vectors may merge without significant heating of the stellar populations. Here we report the detection of molecular gas and present optical images of the dust distribution in NGC 4550. Consequences for the origin of this gas and dust are evaluated.

2 Observations
2.1 Molecular data
The CO observations were made with the IRAM (Institut de Radio Astronomie Millimétrique) 30-m telescope on Pico Veleta in Spain in October 1992 and May 2000. The full width to half power beam size was = 23′′ (1.9 kpc at a distance of = 16.8 Mpc; Tully 1988). 3 mm SiS receivers were used to observe the CO(1–0) line with a nutating subreflector, switching symmetrically 240′′ in azimuth with a frequency of 0.5 Hz. Typical system temperatures were 400 K (Oct. 1992) and 350 K (May 2000) on a main beam brightness temperature () scale. In 1992, filterbanks were used with a channel spacing of 2.6 km s-1 and a total bandwidth of 500 MHz. In 2000, a digital spectrometer was employed; the channel spacing was 3.2 km s-1 and the bandwidth was 640 MHz. Final spectra were obtained by adding all individual spectra weighted with the inverse of the square of their rms noise, removing a first order baseline and binning the channels to an effective velocity resolution of 20–31 km s-1.
Typical pointing corrections determined by regular observations of nearby continuum sources were 3-4′′. The temperature scale used here is , with the forward hemisphere efficiency = 0.95 and the main beam efficiency = 0.76. In 1992, image sideband rejections were assumed to be 7 dB, but were not determined for each individual pointing. An error in the sideband rejection of only 1 dB would cause a calibration error of 5%. In 2000, image sideband rejections were 25 dB; therefore uncertainties in the image sideband rejection do not significantly contribute to the total calibration error. As a consequence, the temperature scale of these measurements is more reliable.
2.2 Optical data
We retrieved Hubble Space Telescope (HST) archival data of NGC 4550 obtained during Cycle 4. The data consist of Wide Field/Planetary Camera 2 (WFPC2) images with the F555W (V–band) and F814W (I–band) filters. The data were obtained on December 10, 1994, (proposal 5375, PI: V.C. Rubin), with exposure times of 3400 seconds for each filter. The WFPC2 data were processed through the standard pipeline where bias, dark, and flatfielding corrections were performed and photometry keywords were calculated. Subsequent processing was done using standard tasks in IRAF/STSDAS. Multiple images were simultaneously co-added and cosmic-rays removed. The images shown here are from the Planetary Camera (PC) with a pixel scale of 0.046”, corresponding to 3.8 pc at = 16.8 Mpc.
3 Results
3.1 Molecular gas
In Fig. 1a we show the CO(1–0) emission profile observed in May 2000 towards the center of NGC 4550. A weak but clear signal is detected. The emission extends from 225 to 535 km s-1, which is similar to that of stars and the ionized gas (Rubin et al. 1992; Rix et al. 1992). The velocity integrated intensity is K km s-1. With a -to- conversion factor of cm-2 (K km s-1)-1, and = 16.8 Mpc (Tully 1988), this corresponds to an H2 mass of M⊙. The total stellar mass can be estimated from the -magnitude, assuming an ratio of 5, to be M⊙. This gives a gas mass fraction of only 0.1%.
The CO emission profile is skewed relative to the systemic velocity of the galaxy ( 380 km s-1; e.g. Huchtmeier & Richter 1989; Rubin et al. 1997), being stronger at higher velocities. Dividing the profile into a low and high velocity part, measuring the velocity integrated intensities between 220–380 km s-1 and 380–520 km s-1 we get . For a molecular gas distribution being symmetric with respect to the minor axis crossing the nucleus, we expect a symmetric emission profile. Skewed profiles like the one seen in Fig. 1a can then be caused by a pointing offset of the telescope. However, in this case we observed the same position for several hours, with pointing checks at regular intervals. Small pointing uncertainites should therefore result in a general broadening of the telescope beam resulting in a symmetric emission profile rather than a skewed one. Also, during the course of the observations the source rotated with respect to the telescope beam counteracting any systematic pointing offset. It is therefore likely that the skewed shape of the emission profile in Fig. 1a is real and reflects an asymmetric distribution of the molecular gas.
In 1992 we observed CO(1–0) emission towards 6 positions in the central region of NGC 4550. Offsets were (, ) = (0′′,0′′), (0′′,+10′′), (0′′,+20′′), (0′′,–10′′), (+10′′,0′′) and (–10′′,0′′), relative to the center position (see Fig. 1). No emission was directly detected above the 3 level in any individual position but by convolving the observed data with a telescope beam of = 36′′, we detect a clear signal. Omitting the northernmost position from the convolution we get the CO profile shown in Fig. 1b. The exclusion of position (0′′,20′′) does not change the overall appearance significantly. The emission profile is similar to the one shown in Fig. 1a, i.e. the profile is skewed. The integrated intensity is higher in Fig. 1b, but in view of the calibration uncertainties (see Sect. 2.1) and the small number of measured positions that could be used for the convolution, the temperature scale in Fig. 1a is more reliable.
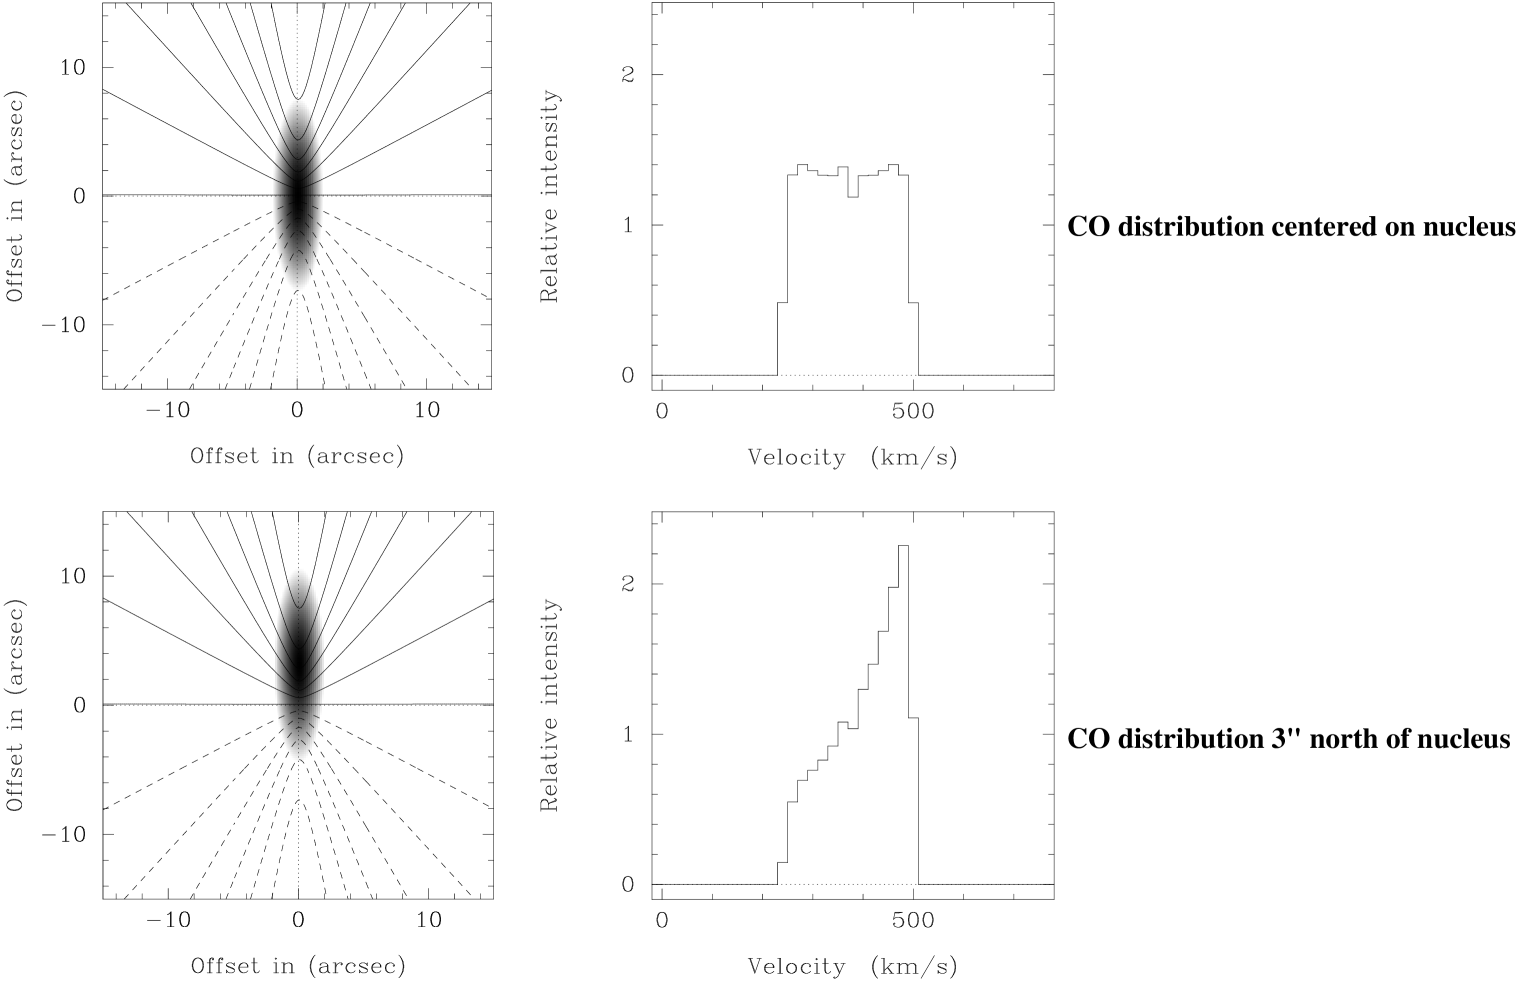
In order to test how sensitive the shape of the emission profile is to offsets of the gas from the nucleus, we made a simple model of a highly inclined (; cf. Tully 1988) molecular gas distribution with the major axis along a north-south direction (for NGC 4550, = 358∘; Rubin et al. 1992) and the receding part of the galaxy to the north (Rubin et al. 1992). For the molecular gas distribution we assumed a gaussian distribution with a full width to half power source size of = 14′′ (see Sect. 3.3). For the velocity field we adopted a parametrization of the rotation curve resembling the one presented by Rubin et al. (1992). The resulting iso-velocity contours, ‘observed’ with a telescope beam size identical to the one used in the real observations ( = 23′′), are shown in Fig. 2. The exact shape of the rotation curve is not crucial for demonstrating the effect from offsetting the center of emission. In the top panels we show the case where the gas is centered on the nucleus. The observed spectra are symmetric, with a top-hat shape. This results from the fact that the gas is sampled mainly on the rising part of the rotation curve. In the lower panels the gas distribution has been shifted 3′′ north, while keeping all other parameters fixed. The resulting emission profile is strongly skewed towards higher velocities and resembles the observed CO(1–0) profiles in NGC 4550 (Fig. 1).
Centering the convolution of the CO profiles observed in 1992 5′′ north and south of the nuclear position, the northern profile shows an integrated intensity that is 30%10% larger than the corresponding profile from the southern position. While this result is only marginally significant, it is nevertheless consistent with a skewed spatial distribution; most of the CO emission arises from locations north of the center.
3.2 Atomic gas
There are conflicting reports in the literature regarding 21cm HI observations. While a few early observations reported detections with integrated fluxes between 1 - 9 Jy km s-1 others, including all recent observations, have resulted in non-detections. Using the Arecibo antenna DuPrie & Schneider (1996) report a non-detection at an rms level of 1.5 mJy. At a distance of 16.8 Mpc this corresponds to a 3 upper limit to the HI mass of M⊙. Although this limit is considerably higher than the detected molecular gas mass, it shows that the total amount of gas in NGC 4550 is M⊙.
3.3 Dust
The asymmetric distribution of the molecular gas indirectly inferred by the lineshapes of our CO profiles (Fig. 1) can be traced directly by the dust distribution. Dust is visible as dark patches in the V-band image and becomes prominent in the V I image (Fig. 3). The dust can be followed to a radius of 7′′ and is distributed in several arclets, reminiscent of spiral arms. The main morphological feature is, however, the non-axisymmetric distribution, with the northern part being significantly more prominent than the southern part. This could in principle be caused by a bar-shaped dust distribution seen at an angle to the plane of the sky, with the northern side being closer to the observer. The difference in background light behind the dust would yield a higher contrast (see Fig. 3c) in the north. The extreme difference of the dust obscuration between northern and southern side of the nucleus appears, however, to be too large to be explained in this way. An intrinsically non-axisymmetric distribution is more likely.
NGC 4550 was detected by IRAS in the 60 and 100m bands ( and mJy). With = 16.8 Mpc the total far-infrared (FIR) luminosity amounts to L⊙. The FIR flux corresponds to a dust mass
| (1) |
where is the Planck function evaluated for a dust temperature = K (60/100m color temperature), is the distance measured in Mpc (16.8 Mpc), is the flux measured in Jansky (here we use the 100m flux of mJy) and is the mass opacity coefficient for which we used 2.5 m2 kg-1 (Hildebrand 1983) and assumed . The dust mass is M⊙. The large uncertainty is mainly due to the uncertainty in the dust temperature. The corresponding gas-to-dust mass ratio is , when incorporating a primordial abundance of helium. The ionized and atomic gas masses are assumed to be negligible in comparison to the molecular gas mass (cf. Rubin et al. 1992; DuPrie & Schneider 1996). Thronson & Telesco (1986) found a typical gas-to-dust mass ratio of 700 for normal spiral galaxies, which reflects the fact that the IRAS bands are not sensitive to a dust component colder than 20 K. The lower gas-to-dust ratio found in NGC 4550 indicates that a relatively warm dust component dominates the far infrared continuum.
The heating source of the dust can be (i) the ambient stellar radiation field, (ii) massive young stars embedded in the dust clouds, (iii) photons from a hot X-ray emitting plasma or (iv) collisions with electrons from a hot X-ray gas component.
The observed visual magnitude within a 30′′ aperture centered on the nucleus of the galaxy is V=12.31 (Sandage & Visvanathan 1978). This corresponds to an average surface brightness of 19.4 mag arcsec-2. Using a solar absolute magnitude mag we get an average intensity for the ambient stellar radiation field of erg s-1 cm-2 ster-1. The heating rate per dust grain by absorption of ambient stellar light is then erg s-1, where we have used an absorption coefficient of 0.36 and a typical dust grain radius of 0.1m (cf. Jones & Merrill 1976; de Jong et al. 1990). The equilibirum dust grain temperature can be estimated by equating the heating and cooling rates and becomes 25 K. This is 2 lower than the observed K and suggests an additional heating source for the dust. Although there are no obvious signs for massive stars in NGC 4550 (cf. Fig. 3), the gas mass derived from the CO emission and from the FIR luminosity are consistent with each other assuming a normal gas-to-dust mass ratio. Hence it cannot be excluded that young massive stars are embedded in the molecular gas. In Sect. 3.4 we will see that X-ray heating, either through X-ray photons or hot electrons, is inefficient in comparison with heating by the ambient stellar radiation field.
3.4 X-ray properties
NGC 4550 is undetected at X-rays. Einstein data give ergs s-1 (Fabbiano et al. 1992). It is nevertheless likely that a hot X-ray emitting plasma is present at some level. Stellar mass loss from evolved stars will contribute M⊙ yr-1 of gas to the interstellar medium (cf. Faber & Gallagher 1976; Sarazin 1990). The large stellar velocity dispersion in NGC 4550, caused by the counterrotation, will heat this gas to X-ray temperatures. The gas lost from evolved stars will have an energy per unit mass of , similar to the energy per unit mass of stars, which is of the order (using the one-dimensional velocity dispersion since stellar orbits are confined to a plane). After thermalization this leads to an equilibrium temperature of (cf. Sarazin 1990)
| (2) |
An additional source of heating comes from supernovae, but due to the high relative velocity dispersion in NGC 4550, it is likely that energy input from stellar mass loss will dominate the heating. Assuming that the gas remains gravitationally bound to the galaxy and cools radiatively, the resulting X-ray luminosity can be approximated as
| (3) | |||||
where the term in bracketts is the stellar mass loss rate per blue luminosity (cf. Faber & Gallagher 1976; Sarazin 1990). For NGC 4550, with km s-1 and L⊙, we get ergs s-1. This is consistent with the existing upper limit for NGC 4550 of ergs s-1 (Fabbiano et al. 1992). The time scale for accumulating an X-ray gas mass equivalent to the molecular gas mass is
| (4) |
is the stellar mass loss rate from evolved stars, assumed to be M⊙ year-1 L (cf. Faber & Gallagher 1976; Sarazin 1990).
Hence, a substantial hot X-ray emitting plasma can be established in the center of NGC 4550 on a relatively short time scale. This plasma can contribute to the heating of the dust component as well as contribute to its destruction through sputtering.
Assuming a core radius for the X-ray gas of 1 kpc (12′′ at = 16.8 Mpc), the average X-ray intensity in the central region of NGC 4550 is ergs s-1 cm-2 ster-1, resulting in a heating rate per dust grain of ergs s-1. This is three orders of magnitude smaller than the heating rate from the ambient stellar light (Sect. 3.3). The X-ray photon contribution to the heating of the dust can thus be neglected.
The hot electrons in the core of the X-ray emitting gas will collide with dust grains. The flux of hot electrons is cm-2 s-1 (cf. de Jong et al. 1990). Most of the kinetic energy of the hot electrons will be deposited in the grains upon collision, resulting in a heating rate ergs s-1. Assuming an electron density of cm-3 and the above derived gas temperature of K, the heating rate per dust grain due to hot electrons becomes ergs s-1. This is much larger than the heating rate due to X-ray photons but still ten times less than the heating rate due to the ambient stellar radiation field.
The hot plasma will destroy the dust grains through ‘sputtering’ (cf. Draine & Salpeter 1979). For diffuse gas (i.e. , the time scale is very short: yr (Draine & Salpter 1979). With cm-3 and a typical grain size of 0.1m, is only 20 Myr. After 100 Myr the only surviving gas clouds are those which are optically opaque with (cf. de Jong et al. 1990). The lifetime of these opaque clouds depends strongly on geometry and physical conditions. De Jong et al. (1990) estimated typical parameters for this dense gas component in NGC 4696, the central elliptical galaxy of the Centaurus cluster, and found values similar to the cores of molecular clouds in our Galaxy. Star formation could be sustained in these environments.
To summarize: Mass lost from evolved stars will be heated to a temperature of K on a relatively short time scale due to the high (one dimensional) stellar velocity dispersion in NGC 4550. The X-ray luminosity is consistent with the upper limit from Einstein data. The X-ray gas will not contribute significantly to the heating of the dust grains but will destroy any diffuse component through sputtering on a time scale of 20–100 Myr. The only remaining dusty molecular gas component is associated with dense clouds of high optical opacity, possibly sustaining star formation.
3.5 Star formation
Assuming for the moment that the FIR luminosity is powered entirely by young and massive stars and that the initial mass function (IMF) is of Salpeter type with cut-offs at 0.1 and 100 M⊙ (cf. Thronson & Telesco 1986), the star formation rate (SFR) becomes 0.065 M⊙ yr-1. The ratio of is usually taken as a measure of the star formation efficiency. In NGC 4550 this ratio is L⊙/M⊙, which is similar to the values found for normal spiral galaxies. The gas consumption time scale is defined as the ratio /SFR, which for NGC 4550 is years.
Is star formation really going on in the center of NGC 4550? Kennicutt (1989) suggested that significant star formation only occurs only when the gas surface density exceeds a critical value . The latter value depends on the galaxy rotation and on the gas velocity dispersion. The rotation curve presented by Rubin et al. (1992, 1997) shows that the ionized gas rotates approximately like a solid body in the inner 7′′, with a maximum rotational velocity of 160 km s-1. Within the region of solid body rotation we can express the critical gas surface density as
| (5) |
where is the angular velocity in units of km s-1 kpc-1, is the gas velocity dispersion in units of km s-1 and is a dimensionless constant of order unity. For solid body rotation, this relation is independent of galactocentric distance as long as the velocity dispersion remains constant. We do not know the extent of the molecular gas disk nor its velocity dispersion, but reasonable assumptions are that it coexists with the dust (Fig. 3), having a radial extent of 7′′, and that it has a velocity dispersion 10 km s-1. Furthermore, assuming that the molecular gas corotates with the ionized gas, the critical gas surface density is km s M⊙ pc-2. The observed gas surface density, assuming a homogeneous disk with a radial extent of 7′′ (0.58 kpc) is M⊙ pc-2, where we have included He at primordial abundances. The ratio km s. Since we found the molecular gas to be distributed non-axisymmetrically in the same sense as the dust seen in Fig. 3, the actual gas surface gas density is likely a factor of two larger. Nevertheless, even if the velocity dispersion is only 5 km s-1, the gas surface density is only . This means that the molecular gas is likely to be stable against gravitational collapse on a global scale. Smaller scales with potentially higher gas surface densities will be discussed in the following section.
4 Discussion
Although NGC 4550 is exceptional in that it contains two similar stellar disks counterrotating with respect to each other, there are few if any morphological and photometrical properties that distinguish it from other early-type galaxies. Surface photometry of 14 E and S0 galaxies in the Virgo cluster, obtained with the Hubble Space Telescope (HST) and including NGC 4550 (Jaffe et al. 1994) reveals nuclear disks in all of the early type galaxies later than E4. A nuclear dust component was also seen in most of the early type galaxies. Jaffe et al. (1994) did not find any property distinguishing NGC 4550 from the other 13 galaxies, in spite of the counterrotating stellar disks. Furthermore, the FIR properties of the early type galaxies in the Jaffe et al. (1994) sample are similar to those of NGC 4550. Hence, the presence of M⊙ of molecular gas in the center of NGC 4550 is not exceptional for its morphology (see also van Dokkum & Franx 1995). The only peculiarity which may point to the presence of the counterrotating disks is the non-axisymmetric distribution of the molecular gas and dust in the center of NGC 4550.
Several numerical/theoretical studies of the dynamics of disks containing counterrotating stars and/or gas has shown that the fastest growing unstable mode is an instability (Merrifield & Kuijken 1994; Lovelace et al. 1997; Thakar et al. 1996; Thakar & Ryden 1998; García-Burillo et al. 2000). This applies to the cases where the mass fractions of the pro- and retrograde mass components are of comparable size. The result is a tightly wound one-armed spiral structure within a few hundred pc from the nucleus. Initially the instability can also be manifest through a lopsidedness of the mass distribution. This latter feature is, however, relatively short-lived, 0–500 Myr. On time scales longer than 1 Gyr an instability dominates (cf. García-Burillo et al. 2000). This takes the form of a bar or oval configuration.
An extensive study of instabilities in counterrotating self-gravitating stellar disks was presented by Sellwood & Merritt (1994). They found that for kinematically cool systems, lopsidedness is the only instability which is unique for counterrotating stellar systems (this applies for isolated galaxies). Contrary to the studies mentioned above, Sellwood & Merritt found the lopsidedness to persist for long periods and suggested that this feature could be used to identify galaxies with counterrotating stellar subsystems.
The dust distribution in NGC 4550 is reminiscent of a tightly wound spiral arm structure, extending to a galactocentric distance of 600 pc, but with a pronounced lopsidedness. As described in Sect. 3, the CO emission is consistent with an asymmetric distribution of the molecular gas, in the same manner as the distribution of the dust component. The kinematics of the CO emission suggests that molecular gas is present on both sides of the nucleus, but that the northern side is dominant. In view of the above mentioned numerical simulations, the most likely explanation for the lopsided gas and dust distribution in NGC 4550 is an instability caused by the counterrotating disks. As pointed out by Sellwood & Merritt (1994), the lopsided instability is strongest for the coolest systems, i.e. the gas. It remains to be shown whether these features can be longlived. If not, the lopsidedness implies a recent accretion event (0.5 Gyr).
In Sect. 3.4 we argued for the existence of a hot X-ray emitting plasma in the central region of NGC 4550. Although this X-ray component was found to give a neglible contribution to the heating rate of the dust grains, it limits the lifetime of any diffuse dust component to less than 100 Myrs. A dense gas component can survive for longer time scales. The physical characteristics needed for molecular gas surviving in a hot X-ray emitting plasma implies small and dense molecular clouds, similar to molecular cloud cores in in our own Galaxy. These cores could very well sustain star formation despite that the global surface density of molecular gas in NGC 4550 was shown to be too low to be unstable to gravitational collapse (Sect 3.5). This star formation activity would contribute the extra heating suggested to explain the high dust temperature of K (see Sect. 3.3).
The only other known system with a significant counterrotating stellar disk and molecular gas is NGC 3593. In contrast to NGC 4550, this edge-on S0/a galaxy contains two stellar disks with different central surface brightness and different scale heights (Bertola et al. 1996). The smaller disk, which makes up 18% of the total disk stellar mass, also contains significant amounts of ionized, atomic as well as molecular gas (Wiklind & Henkel 1992; Corsini et al. 1998; García-Burillo et al. 2000). The atomic and molecular gas masses are and M⊙, respectively (Krumm & Salpeter 1979; Wiklind & Henkel 1992). Including the counterrotating gas components, the mass ratio of the two disks is 0.3, with the gas making up 40% of the total mass of the counterrotating disk (). This is in stark contrast to NGC 4550, where the mass ratio of the two disks is 1 with the gas making up 0.1% of the mass of one of the disks.
NGC 3593 shows several signs of vigorous star formation activity (cf. Henkel & Wiklind 1997). It has a relatively large FIR luminosity suggesting an SFR of 1.6 M⊙ yr-1 (Wiklind & Henkel 1992), 25 times higher than NGC 4550. The star formation activity is confined to a central ring with a radius of 300 pc. The ring is seen in both ionized and molecular gas (Wiklind & Henkel 1992; Corsini et al. 1998; García-Burillo et al. 2000). The atomic gas has only been observed with a single dish telescope but appears to be significantly more extended than both the ionized and molecular gas component. It is thus possible that in NGC 3593 we are witnessing the transformation of accreted gas, with an angular momentum opposite to that of the main stellar disk, into stars. Once the gas is consumed, NGC 3593 will look like an S0 galaxy with a counterrotating stellar population comprising 25% of the total stellar disk mass. Although less than in NGC 4550, it is still significant in comparison to the limits obtained for counterrotating stellar components in the sample of 28 S0 galaxies by Kuijken et al. (1996).
In the case of NGC 4550 there is only weak and indirect evidence for on-going star formation. Regardless of whether star formation is taking place or not, the age of the observed molecular gas and dust must be low. Since mass loss from evolved stars would provide cool gas associated with both stellar disks that are old and approximately coeval (see Rix et al. 1992), the gas (and the dust) must be the result of a relatively recent (1 Gyr) accretion event not related to the main build-up of the two counterrotating stellar populations. Searching for potential sources for a mass transfer, the nearby elliptical galaxy NGC 4551 ( 1170 km s-1 versus 380 km s-1 for NGC 4550) is a highly unlikely target; the accretion of a dwarf galaxy is therefore a more reasonable scenario.
Acknowledgements.
TW acknowledges support from NFR (the Swedish Natural Science Research Council) for a research grant.References
- (1) Bertola, F., Buson, L. M., Zeilinger, W. W. 1992, ApJ 401, L79
- (2) Bertola, F., Cinzano P., Corsini E. M., et al., 1996, ApJ 458, L67
- (3) Corsini, E. M., Pizzella, A., Funes, J. G., Vega Beltrán, J. C., Bertola, F. 1998, A&A 337, 80
- (4) de Jong, T., Nørgaard-Nielsen, H. U., Jørgensen, H. E., Hansen, L. 1990, A&A 232, 317
- (5) Draine, B. T., Salpeter, E. E. 1979, ApJ 231, 77
- (6) DuPrie, K., Schneider, S. E. 1996, AJ 112, 937
- (7) Faber, S. M., Gallagher, J. S. 1976, ApJ 204, 365
- (8) Fabbiano, G., Kim, D.-W., Trinchieri, G. 1992, ApJS 80, 531
- (9) Faundez, S., Kenney, J., Murphy, E. 2000, AAS 196, #29.15
- (10) García-Burillo, S., Sempere, M. J., Combes, F., Hunt, L. K., Neri, R. 2000, A&A 363, 869
- (11) Henkel, C., Wiklind, T. 1997, Sp. Sc. Rev. 81, 1
- (12) Hildebrand, R. H. 1983, QJRAS 24, 267
- (13) Ho, L. C., Rudnick, G., Rix, H.-W., et al. 2000, ApJ 541, 120
- (14) Huchtmeier, W. K., Richter, O.-G., 1989, A General Catalog of H i Observations of Galaxies, Springer Verlag, New York
- (15) Jaffe, W., Ford, H. C., O’Connell, R. W., van den Bosch, F. C., Ferrarese, L. 1994, AJ 108, 1567
- (16) Jones, T. W., Merrrill, K. M. 1976, ApJ 209, 509
- (17) Jore, K. P., Broeils, A. H., Haynes, M. P. 1996, AJ 112, 438
- (18) Kennicutt, R. C. 1989, ApJ 344, 685
- (19) Krumm, N., Salpeter, E. E. 1979, ApJ 228, 64
- (20) Kuijken, K., Fisher, D., Merrifield, M. R. 1996, MNRAS 283, 543
- (21) Lovelace, R. V. E., Jore, K. P., Haynes, M. P. 1997, ApJ 475, 83
- (22) Merrifield, M. R., Kuijken, K. 1994, ApJ 432, 575
- (23) Pfenniger, D. 1999, IAU Symp. 186, in Galaxy Interactions at Low and High Redshift, eds. J.E. Barnes, D.B. Sanders, Kluwer Academic Publishers, Dordrecht, p. 157
- (24) Prada, F., Gutierrez, C. M., Peletier, R. F., McKeith, C. D. 1996, ApJ 463, L9
- (25) Rix, H.–W., Franx, M., Fisher, D., Illingworth, G. 1992, ApJ 400, L5
- (26) Rubin, V. C., Graham, J. A., Kenney, J. D. P. 1992, ApJ 394, L9
- (27) Rubin, V. C., Kenney, J. D. P., Young, J. S. 1997, AJ 113, 1250
- (28) Sandage, A., Visvanathan, N. 1978, ApJ 223, 707
- (29) Sarazin, C. L. 1990, in The Interstellar Medium in Galaxies, eds. H. A. Thronson, J. M., Shull, Kluwer Academic Publishers, Dordrecht, p. 201
- (30) Sellwood, J. A., Merritt, D. 1994, ApJ 425, 530
- (31) Thakar, A. R., Ryden, B. S. 1996, ApJ 461, 55
- (32) Thakar, A. R., Ryden, B. S., Jore, K. P., Broeils, A. H. 1997, ApJ 479, 702
- (33) Thakar, A. R., Ryden, B. S. 1998, ApJ 506, 93
- (34) Thronson, H. A., Telesco, C. M. 1986, ApJ 311, 98
- (35) Tully, R. B. 1988, Nearby Galaxies Catalog, Cambridge University Press, Cambridge
- (36) van Dokkum, P. G., Franx, M. 1995, AJ 110, 2027
- (37) Wiklind, T., Henkel, C. 1992, A&A 257, 437