The Orbit of the Brown Dwarf Binary Gl 569B
Abstract
We present photometric, astrometric and spectroscopic observations of the nearby (9.8 pc) low-mass binary Gl 569Bab (in turn being a companion to the early-M star Gl 569A), made with the Keck adaptive optics facility. Having observed Gl 569Bab since August 1999, we are able to see orbital motion and to determine the orbital parameters of the pair. We find the orbital period to be days, the semi-major axis to be AU, the eccentricity to be and the inclination of the system to be degrees (1-). The total mass is found to be (3-). In addition, we have obtained low resolution ( = 1500–1700) near-infrared spectra of each of the components in the - and -bands. We determine the spectral types of the objects to be M8.5V (Gl 569Ba) and M9V (Gl 569Bb) with an uncertainty of half a subclass. We also present new - and -band photometry which allows us to accurately place the objects in the HR diagram. Most likely the binary system is comprised of two brown dwarfs with a mass ratio of 0.89 and with an age of approximately 300 Myr.
1 Introduction
Brown dwarfs (BDs), despite sometimes being labeled “failed stars”, are very interesting objects. According to our current understanding, BDs may represent the extreme low-mass end of star formation in which the mass is too small to sustain thermonuclear fusion. This stellar-substellar transition (also defined as the minimum mass at which the internal energy provided by nuclear burning quickly balances the gravitational contraction energy) is expected to occur around 0.075 (Baraffe et al. 1998) for objects with solar metallicities. This value is slightly lower in recent models, which predict a transition mass of 0.072 (Chabrier & Baraffe 2000). Objects with masses below this limit never reach the stable hydrogen burning main sequence, but instead cool down as they age (Burrows et al. 1997; Chabrier et al. 2000) so that their surface temperatures and luminosities strongly depend on age as well as mass. As these cooling curves rely on poorly tested theoretical models, it is highly desirable to calibrate them with direct measurements.
Obtaining dynamical masses for very low-mass (VLM, ) stars and BDs from binaries is a challenging prospect, as so far there are no known eclipsing binary VLM stars or BDs. However, there are a number of known wide, non-eclipsing VLM and BD binaries (Kirkpatrick et al. 2001; Gizis, Kirkpatrick & Wilson 2001; Leinert et al. 2001; see also Reid et al. 2001a and references therein) that have been observed with a range of instruments and techniques, including ground-based infrared and optical imaging, speckle interferometry, adaptive optics (AO), and the Hubble Space Telescope. These binary systems promise to yield highly accurate dynamical masses, although they tend to have long periods and hence will require patience.
In the absence of direct mass measurements for VLM/BD objects, one has to rely on indirect methods that may constrain mass ranges but that do not provide high-precision mass values. One very useful such technique is the lithium test (Magazzù, Martín & Rebolo 1993). Lithium is an element that is easily destroyed under the conditions prevalent in stellar interiors at temperatures slightly below those required for hydrogen burning. Objects more massive than have their primordial lithium abundances depleted as long as they are fully convective. The lithium test has been used to confirm BD candidates in the Pleiades (e.g., Basri, Marcy & Graham 1996) and in the field (e.g., Martín, Basri & Zapatero Osorio 1999; Kirkpatrick et al. 1999; Tinney, Delfosse & Forveille 1997).
Gl 569A is a nearby ( = 9.8 pc), chromospherically active late-type (M2.5V) star. Forrest, Skrutskie & Shure (1988) first reported a possible BD companion with a separation of 5″ from the primary. Based on a low resolution spectrum Henry & Kirkpatrick (1990) classified this object as an M8.5 dwarf with a mass of . More recently, Martín et al. (2000a) resolved the companion into two separate objects (Gl 569Ba and Bb) using AO observations with the Keck II telescope. They estimated the orbital period of the Ba-Bb binary to be around 3 years, and the total mass of the binary pair to be in the range . Herein we present the results of extensive follow-up observations of this interesting pair, including improved photometry as well as near-IR spectroscopy and astrometry of the resolved binary components. We use the photometry to accurately place the objects in the Hertzsprung-Russell (HR) diagram, the spectroscopy to derive spectral types, and the astrometry to derive the total mass of the system from its orbital parameters.
2 NIR photometry and astrometry
2.1 The composite pair: Gl 569Bab
Broad-band near-infrared photometry of the composite pair Gl 569Bab is available in the literature (Forrest et al. 1988; Becklin & Zuckerman 1988). However, the measurement uncertainties claimed by the authors are too large for an accurate placement of these objects in the HR diagram or for direct comparison with theoretical evolutionary models. With the objective of improving the photometric data, we have collected and direct images of the system Gl 569A and Gl 569Bab with the near-infrared camera (Hg Cd Te detector, 256 256 elements) mounted at the Cassegrain focus of the 1.5-m Carlos Sánchez Telescope (CST, Teide Observatory) on 2001 February 8. The observations were performed through the “narrow-optics” of the instrument, which provides a pixel projection of 0.4″ onto the sky. The atmospheric seeing conditions during the night of the observations were fairly stable around 1″, which allowed us to easily separate the M2.5-type star from the pair Gl 569Bab. This latter object was not resolved into its two components. The total integration times were 5 s and 40 s in and filters, respectively. A five-position dither pattern was used to obtain the images; each image consisted of 4 () or 8 () co-added exposures of 0.25 s () and 0.5 s () respectively. The dither pattern was repeated twice for the K-band observations.
Dithered images were combined in order to obtain the sky background, which was later substracted from each single frame. Gl 569Bab is clearly detected in individual images, and we have obtained aperture photometry on each of them using PHOT in IRAF.111IRAF is distributed by National Optical Astronomy Observatories, which is operated by the Association of Universities for Research in Astronomy, Inc., under contract with the National Science Foundation. Instrumental magnitudes were placed on the UKIRT photometric system using observations of the standard star HD 136754 (Casali & Hawarden 1992), which was imaged with the same instrumental configuration just before and immediately after our target. Both the science target and the standard star were observed at similar air masses. The photometric error of the calibration was 0.03 mag in both filters. displays a different bandpass compared to ; the transformation between these two filters is not well defined yet, albeit for objects as red as Gl 569Bab it has been estimated at – = 0.035 (Hodgkin et al. 1999, and references therein). We have applied this correction to our photometry as well as the relations given in Leggett, Allard & Hauschildt (1998) to convert UKIRT data into the CIT photometric system. The final average magnitudes derived for Gl 569Bab are given in Table 1, where the photometric errors listed correspond to typical 1 uncertainties of single measurements.
The astrometry of Gl 569Bab relative to the bright primary Gl 569A as measured on the CST data (MJD = 51948.202) is the following: angular separation of 4.″890 0.″040, and position angle of 30∘ 3∘. We note that these values differ from those published in Forrest et al. (1988) by more than 2 , providing evidence of the orbital motion of Gl 569Bab around the M2.5-type star in the time interval of roughly 15 years.
2.2 Adaptive Optics Imaging of Gl 569Ba-Bb pair
Gl 569Bab was observed on 7 occasions between 1999 August and 2001 May with the Keck II AO system (Wizinowich et al. 1988). The first 3 observations made use of the KCAM camera with a NICMOS-3 infrared array. The later observations made use of the slit-viewing camera (SCAM) associated with the NIRSPEC instrument (McLean et al. 1998). SCAM uses a PICNIC Hg Cd Te array. For both cameras the pixel scale was 0.0175″ and the field of view was ″, except for the 2001 May observation when the SCAM pixel scale was changed to 0.0168″. Exposures were generally obtained in the -band, except for 2000 Febuary when the observations were taken in the -band. Exact exposure times varied, but typically consisted of 30 coadded 2-second exposures. We used a 1% transmission neutral density filter in the beam to prevent saturating the bright primary star. Flat-field correction was performed using twilight exposures, while sky subtraction made use of images of an adjacent field observed immediately after Gl 569B. Corrected seeing varied between 0.05″ and 0.08″. For three of the observations the primary star (Gl 569A) was also in the field of view, providing an in-field astrometric reference. For the other observations the primary was either not observed or was saturated. No photometric standard stars were observed in any of the epochs, so we cannot provide absolute photometric calibrations for the AO observations. Figure 1 shows the resulting images of the pair Gl 569Bab at six different epochs. This figure clearly demonstrates that this system is resolved into a binary and that orbital motion is evident.
We used the DAOPHOT package (in IRAF) for data reduction and analysis. The point spread function of the objects in each frame were fitted with an elliptical Gaussian function, providing relative astrometry (Table 2) and photometry. The relative photometry of Gl 569Ba and Gl 569Bb was derived by computing the ratio of the amplitudes of the best fitting Gaussians (Table 1). Gl 569Bb is fainter by 0.51 0.02 mag and 0.41 0.03 mag in the - and -bands, respectively. This makes this object redder in () by 0.10 0.04 mag. The error bars take into account the dispersion observed from image to image, and from one observing run to another. We do not find a significant relative photometric variability in any member of the pair within 3 the uncertainties. With the relative brightness of the two components and the combined flux known, it is possible to derive the individual absolute magnitudes of Gl 569Ba and Gl 569Bb. We list in Table 1 the resulting decomposition for the - and -bands. The corresponding error bars incorporate the photometric uncertainties of the combined system Gl 569Bab and the uncertainties of the relative photometry. We are confident that the latter is determined with a higher accuracy.
3 Low resolution NIR spectra
We have obtained low resolution spectra of Gl 569Ba and Gl 569Bb in the - (1.158–1.368 m) and -bands (1.992–2.420 m) using the cross-dispersion spectrograph NIRSPEC and the AO facility at the Keck II telescope. The data were collected on 2000 June 20. The raw seeing and transparency conditions were very good during the observations, and the AO correction applied to the primary star Gl 569A provided well resolved images of the binary system Gl 569Bab (AO corrected seeing of 0.05″). NIRSPEC in its spectroscopic mode is equipped with an Aladdin InSb 1024 1024 detector with a pixel projecting 0.0185″ onto the sky. For the present study, we selected the low resolution spectroscopic mode which provides nominal dispersions of 2.8 Å/pix and 4.2 Å/pix in the - and -bands, respectively. The 3 pixel-wide slit was aligned with the two components of the binary (PA 139 deg) so that both targets were observed simultaneously.
Total exposure times were 240 sec and 400 sec for the -band and -band spectra, respectively. The observing strategy employed was as follows: 6 () and 10 () individual integrations of 20 sec () and 10 sec () each at two different positions along the entrance slit separated by about 1.8″. This procedure was repeated twice in the -band. In order to remove telluric absorptions due to the Earth’s atmosphere, the near-infrared featureless A0V-type star HR 5567 was observed very close in time and in air mass (within 0.05 air masses). Calibration images (argon arc lamp emission spectra and white-light spectra) were systematically taken after observing each source.
Raw data were reduced following conventional techniques in the near-infrared. Nodded images were subtracted to remove the sky background and dark current. The spectra of the sources and of the calibration lamps were then extracted using subroutines of the TWODSPEC package available in IRAF. The extraction apertures of Gl 569Ba and Gl 569Bb were selected so that cross-contamination was less than 10%. The extracted spectra of the sources were divided by their corresponding normalized extracted flat-fields, and calibrated in wavelength. The 1 dispersion of the fourth-order polynomial fit was 0.4 Å and 1.0 Å in the and spectra, respectively. The hydrogen P absorption line at 1.2818 m and the B absorption line at 2.1655 m in the spectra of HR 5567 were interpolated before they were used for division into the corresponding science spectra. We are confident that the science spectra have good cancellation of atmospheric features. To complete the data reduction, we multiplied the spectra of our targets by the black body spectrum for the temperature of 9480 K, which corresponds to the A0V class (Allen 2000).
3.1 Spectral types, atomic and molecular features
The resultant average spectra with a resolution of = 1500 in and = 1700 in are depicted in Fig. 2. The strongest molecular and atomic features are indicated following the identifications provided by Jones et al. (1996) and McLean et al. (2000). The spectra of both components, Gl 569Ba and Gl 569Bb, are indeed very similar. The composite spectrum of Gl 569Bab in the optical has been previously studied by Henry & Kirkpatrick (1990) and Kirkpatrick, Henry & McCarthy (1991), who derived a dwarf spectral type of M8.5. In addition, this object is listed in the Table 1 of Kirkpatrick et al. (1991) as a primary dwarf spectral standard. Our data agree with this measurement for the bright component Gl 569Ba, and also provide evidence that Gl 569Bb is not significantly cooler. This is fully consistent with the photometry presented above.
We have obtained equivalent widths of the strongest observed atomic absorptions of K i and Na i in the spectra; the measurements are given in Table 3. Due to the low resolution of our data, the majority of these lines are considerably blended with other spectral features, e.g. the K i line at 1.2435 m is contaminated by a strong molecular band of FeH. The values in Table 3 have been extracted adopting the base of each line as the continuum. We find typical standard deviations in equivalent width close to 10% over the reasonable range of possible continua. Although this procedure does not give an absolute equivalent width, it is commonly used by different authors, and allows us to compare our values with those published in the literature. We have also measured the strengths of the H2O band at 1.330 m and the CO band at 2.294 m in a way similar to that described in McLean et al. (2000), Reid et al. (2001b) and Jones et al. (1994). Our measurements are listed in Table 3 with uncertainties of about 5%. All these values are comparable to those obtained from similar spectral type field stars, which suggests that neither Gl 569Ba nor Gl 569Bb have very discrepant metallicities or gravity.
We note that the equivalent widths of the K i lines and the H2O and CO absorptions in Gl 569Bb appear to be slightly larger than in Gl 569Ba, while the Na i lines in the -band spectrum are smaller. This trend is observed for decreasing temperatures (Jones et al. 1994), and clearly indicates the cooler nature of Gl 569Bb. By fitting a polynomial spectral type-equivalent width relation to the data available for spectral standard stars (see Reid et al. 2001b), we conclude that the differences between Ba & Bb in our measurements are consistent with Gl 569Bb being half a subclass cooler. This would make Gl 569Bb an M9-dwarf (0.5 subclasses).
3.2 Radial velocities
We used our low resolution near-IR spectra taken on 2000 June 20 (MJD = 51715.365) to compute the relative radial velocity of Gl 569Bb and Gl 569Ba via Fourier cross-correlation. Because the spectroscopic data have been corrected for telluric lines, we do not expect these lines to be a large source of uncertainty. Unfortunately, no spectra were taken of the primary star Gl 569A, so we cannot determine the relative radial velocity of the pair with respect it. The velocity dispersion of the data is rather poor (1 pixel 66 km s-1 in and 57 km s-1 in ). Nevertheless, the cross-correlation technique was able to achieve precisions of about 1/4 pixel, so we obtained a relative radial velocity accurate to about 15 km s-1. We verified this by cross-correlating individual spectra of each component against itself. The relative velocity (Gl 569Bb cross-correlated with Gl 569Ba) we measure is 25 km s-1 in and 6 km s-1 in , with an average value of 15.5 km s-1. The peak-to-peak radial velocity variation of the system on the basis of the orbital solution presented in next section is around 14 km s-1; our measurement is consistent within the error bar with the expected value at the epoch of the observations. However, this error bar is rather large and prevents us from making further analysis (like the presence of invisible companions). The maximum peak of the cross-correlation function is in the range 0.93–0.97, which indicates the similarity and the high signal-to-noise ratio of the spectra.
4 Orbit determination and total mass of the pair
We determined the apparent orbit of the binary pair Gl 569Bab by fitting a Keplerian model to the relative astrometric data shown in Table 2. As the fit is non-linear in the orbital elements, we made use of a gradient-following fitting routine (Press 1992) to find the optimal (in a chi-squared, , sense) orbital parameter set. As there may be many local minima in the manifold, and our gradient following routine moves strictly downhill, we ensured that it found the global minimum by starting it at a range of different locations in parameter space. The best-fit parameters are given in Table 4, and the visual orbit is shown together with the astrometry in Fig. 3. The of the residuals is 0.0024″, and the residuals do not show any long-term drifts. Uncertainties (assuming normal errors) were estimated from the covariance matrix of the fit, scaled by the reduced chi-squared (0.96). However, as apparent in Fig. 4 the best-fit values for the semi-major axis and period are correlated, leading to a lower uncertainty in the total mass. The mass uncertainty was estimated by finding contours in parameter space where the was increased by 2.3, 6.2 and 11.8 respectively, corresponding to the 1 , 2 and 3 contours. The 1 , 2 and 3 mass ranges are 0.114–0.135, 0.107–0.142 and 0.101–0.150 respectively, while the best-fit values for the period and semi-major axis correspond to a total mass of 0.123 . From the relative photometry we infer that the mass ratio of the binary is close to, but not exactly, equal. Hence the 2 upper mass limit of the secondary Gl 569Bb is less than 0.071 , i.e. below the hydrogen burning mass threshold, making it a likely brown dwarf.
It is important to note that although we were able to obtain reliable relative astrometry of the Ba-Bb pair (over a separation of ″), the uncertainties in plate scale and orientation and the saturation of the bright star in some images were such that we were unable to reliably measure the orbital motion of each component of the Ba-Bb pair with respect to a separate reference, i.e. Gl 569A (located ″ away). Hence, while we can determine the relative orbit of the Ba-Bb pair to a high degree of precision, we cannot astrometrically determine the mass ratio of the two components. Further studies are needed to confirm or discard the substellar nature of the primary Gl 569Ba. We will combine our photometry (absolute and relative), the total mass of the system and additional information available in the literature to compare the binary with the most recent evolutionary models.
5 Discussion
5.1 Color-magnitude diagram
Figure 5 depicts the location of the Gl 569Bab pair in the near-infrared color-magnitude diagram. To convert their observed magnitudes into absolute magnitudes we have used the astrometric parallax provided by Hipparcos (0.″10191 0.″00167, Perryman et al. 1997), which is very similar to previous astrometric measurements (Heintz 1991). Also shown in this figure are the locations of very late-type dwarfs in the Pleiades cluster (120 Myr, Basri et al. 1996; Martín et al. 1998; Stauffer, Schultz & Kirkpatrick 1998, we use a distance of 120 pc) which have photometry available in the literature (Festin 1998; Martín et al. 2000b), and of objects in the field. Absolute magnitudes and colors of M-type field standard stars have been taken from tables published in Kirkpatrick & McCarthy (1994) and Leggett et al. (1998). For L-type field dwarfs we have adopted the average near-infrared colors provided in Kirkpatrick et al. (2000), and have averaged absolute magnitudes for those objects with parallax available in the literature (see Reid et al. 2000, 2001b; Kirkpatrick et al. 2000).
Overplotted onto the observed data in Fig. 5 are the 0.5, 1.0 and 5.0 Gyr theoretical solar composition isochrones from the evolutionary models of the Lyon group (Chabrier et al. 2000; Baraffe et al. 1998) and from those of the Arizona group (Burrows et al. 1997). We have adopted solar metallicity in our studies because the photospheric abundance of the bright star Gl 569A has been determined to be very close to solar ([Fe/H] = –0.15, Zboril & Byrne 1998). Although the Lyon models do provide magnitudes and colors in the filters of interest, we preferred to compute them from the predicted luminosity and effective temperature at a given mass and age. This allows a direct comparison of the two sets of interior models and minimizes the effects of possible errors in the model atmosphere synthesis. We converted effective temperatures () into colors by using the temperature scales of Leggett et al. (1998) for M-dwarfs and of Basri et al. (2000) for late-M and L-dwarfs. These two temperature scales should be consistent and complementary with each other as the authors make use of the same atmosphere models to obtain their results. We derived absolute magnitudes from theoretical luminosities by using the bolometric correction as a function of spectral type (i.e. color, ) given in Leggett et al. (2000) down to mid-M classes, and in Reid et al. (2001b) for cooler types. To summarize, the second order polynomial fits (1700 3500 K) we used are as follows:
mag
mag
Isochrones in Fig. 5 are plotted for 2900 K, which roughly corresponds to masses smaller than 0.1 at ages around 1 Gyr.
From Fig. 5 we can see that the evolutionary models nicely reproduce the trend delineated by field objects, except for the reddest colors ( 1.5) where models apparently predict brighter magnitudes. Of the two sets of isochrones, the Lyon 1–5 Gyr models seem to produce a better fit to the observed data in the field. The difference in color between Gl 569Ba and Gl 569Bb is consistent with the spectral types of the objects. Within 1 the uncertainties of our photometry, the location of the pair is well matched by isochrones in the age interval 0.2–1.0 Gyr. This indicates a young age for the multiple system, a result which is compatible with the elevated X-ray emission of the “single” M2.5-type primary (Pallavicini, Tagliaferri & Stella 1990; Huensch et al. 1999), with the system belonging to the young galactic disk as inferred from its kinematics (Reid, Hawley & Gizis 1995), with the large rotation rate measured for the star Gl 569A (Marcy & Chen 1992), as well as with the late-M spectral type–lithium–age relationships (Magazzù et al. 1993; see Bildsten et al. 1997).
Lithium is detected in M8–M9 Pleiades BDs (Rebolo et al. 1996; Stauffer et al. 1998), whereas older and slightly more massive objects have depleted it very efficiently. Thus, lithium non-detections in very late-M type objects necessarily imply ages older than the Pleiades. No lithium feature is observed in the composite optical spectrum of Gl 569Bab (Magazzù et al. 1993), thus implying that the binary is older than 0.12 Gyr. The -band spectroscopic data shown in Magazzù et al. (1993) have poor signal-to-noise ratio, and are dominated by the bright and more massive component as it contributes twice as much flux as does the fainter component. We will discuss later how the age of the system can be constrained to a much smaller range using results presented in this paper.
We do not find from our near-infrared photometry strong evidence for the possible binary nature of Gl 569Ba as claimed by Martín et al. (2000a) on the basis of their vs color-magnitude diagram as well as by Kenworthy et al . (2001) on the basis of their colors. The relative position of the two components of the pair in Fig. 5 reasonably fits the location of field dwarfs even within 1 the error bars. If Gl 569Ba is a binary itself, the smaller companion has to be at least a factor five less luminous. We have combined our AO -band images to look for any possible companion. We place a 3 limit at = 16.5 mag (0.015–0.02 ) on the brightness of a possible companion at distances greater than 0.25″, and less than 2″– half the size of the AO detector. We cannot discard, however, the presence of extremely faint and less massive objects around any of the components which our AO observations have not been able to detect/resolve. Follow-up high resolution spectroscopy and/or very detailed analysis of the orbital motion of the pair may reveal the presence of close-in giant planets.
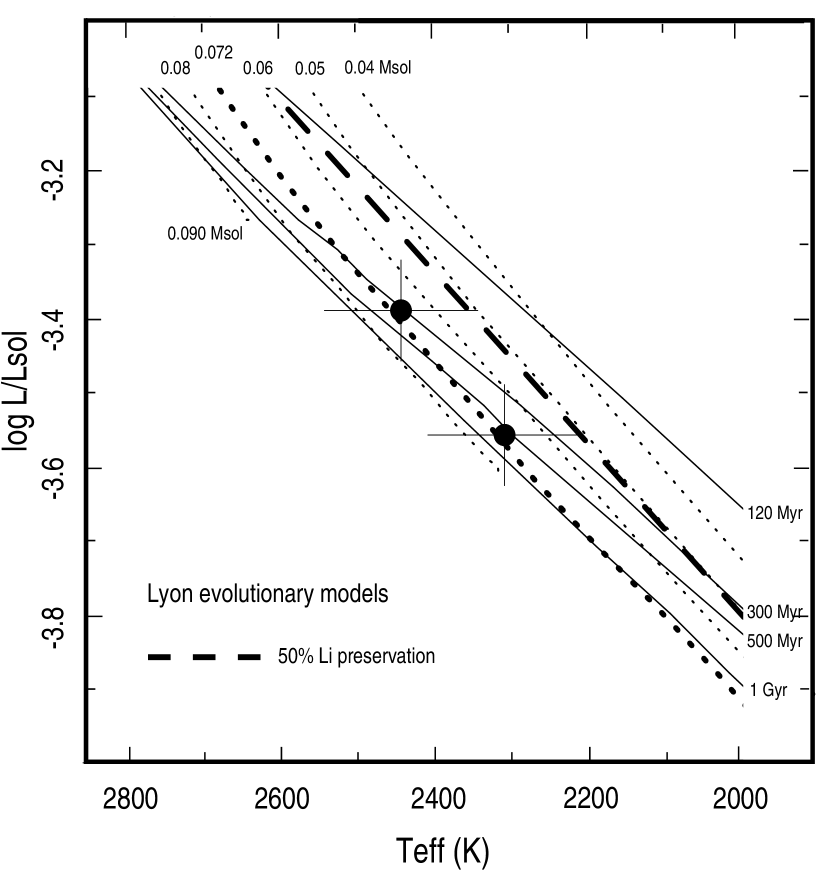
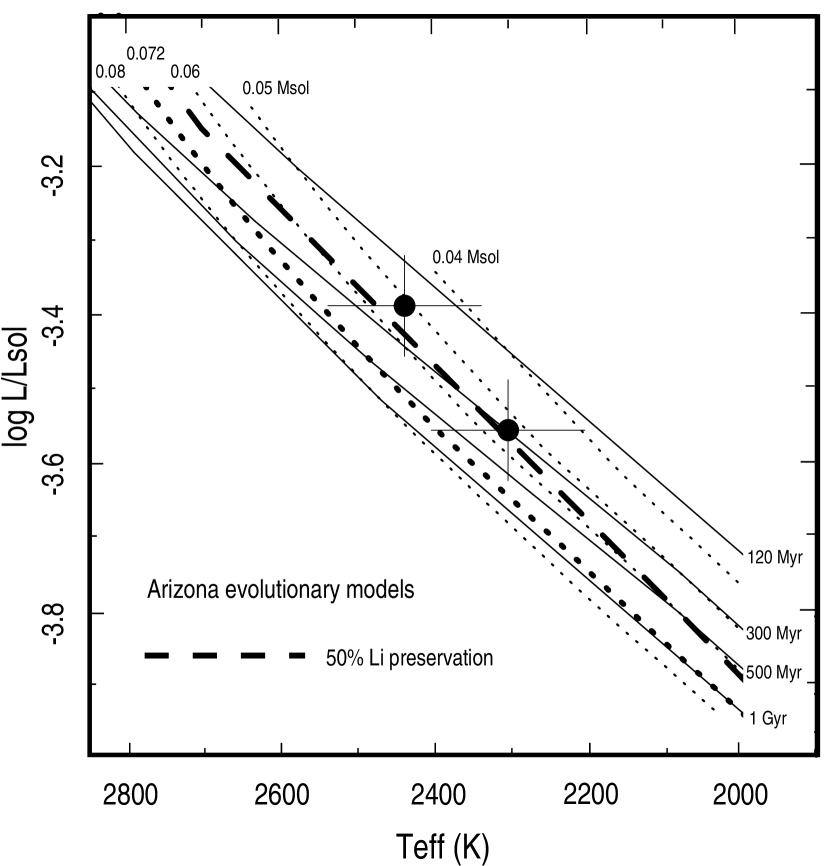
5.2 The HR diagram and substellarity
Figures 6 and 7 show the location of Gl 569Ba and Gl 569Bb in the HR diagram (luminosity as a function of effective temperature) and provide a comparison with state-of-the-art evolutionary models by the Lyon group (Chabrier et al. 2000) and by the Arizona group (Burrows et al. 1997). Solar-metallicity abundance isochrones of ages 120, 300, 500 Myr and 1 Gyr, and evolutionary tracks of masses in the interval 0.04–0.09 are shown in these figures. We use the most recent determination of the substellar mass limit at 0.072 to define the stellar-substellar borderline. Because this value is the smallest of those available in the literature (see e.g. Grossman, Hays & Graboske 1974; D’Antona & Mazzitelli 1994; Burrows et al. 1993), our conclusions on substellarity will be conservative. We indicate in the figures the substellar mass boundary and the location of the 50% depletion limit of lithium burning predicted by the two sets of models. We have obtained the luminosity and effective temperatures of our targets as explained above. The third-order polynomial fit that gives temperatures as a function of the observed () color is the following:
K
This fit has been calculated for colors in the range 0.85–2.06 (spectral types M6–L6), and is based on the temperature calibrations provided by Basri et al. (2000) and Leggett et al. (2000). Bolometric corrections in the - and -bands from Reid et al. (2001b) and Bessell, Castelli & Plez (1998), respectively, have been used to transform magnitudes into bolometric luminosities. The values we derive for the pair are listed in Table 1. The error bars in luminosity take into account the uncertainty of the distance modulus (Hipparcos) and the photometric uncertainties, leading to a total uncertainty of 0.07 dex. The error bars assigned to the effective temperatures come from the uncertainty in the colors alone. These are in general a factor 2 larger than the of the polynomial fit describing the temperature calibration.
Models should be able to provide explanations to all physical properties so far known for Gl 569Ba and Gl 569Bb, i.e., photometry, the total mass of the pair and the destruction of lithium. From Fig. 6 we observe that the location of Gl 569Ba is consistent with severe lithium depletion, in agreement with available optical spectroscopic observations. According to the Lyon models, even the fainter companion Gl 569Bb has depleted its lithium. The likely age of the system is in the range 0.2–1 Gyr, but only with younger ages is it possible to reproduce the astrometric total mass derived for the pair. Therefore, the real constraint to the age of the system is given by the total mass rather than by the error bars in the figure. For the age of 300 Myr, the binary would be formed by objects of 0.069 (Gl 569Ba) and 0.059 (Gl 569Bb), in good agreement with the mean orbital solution. Both masses are below the stellar-substellar borderline and thus the two components would be brown dwarfs. For slightly older ages, individual masses would become larger, as would the total mass. On the basis of the largest possible astrometric total mass value at the 3 level, the pair would be made up of an object on the substellar borderline with 0.078 and a 0.070 -BD at the age of 500 Myr. We tabulate the possible masses of the pair as a function of age in Table 5; these estimations rely on the Lyon models.
The comparison with the Arizona models shown in Fig. 7 also yields very young ages (120–500 Myr) for the system, and thus also small masses for each of the components. To this point, theory and some observations seem to be consistent. However, the Arizona evolutionary models predict hotter temperatures (by about 100 K) around the substellar mass limit at a given age than do the Lyon models, and hence according to these models both Gl 569Ba and Gl 569Bb should have preserved a considerable amount of lithium in their atmospheres. Only by assuming the highest temperatures allowed by the error bars can the Arizona models account for the observed lithium depletion in Gl 569Bab. This would move the pair to a location between 300 Myr and 500 Myr in Fig. 7. In order to be consistent with the additional restriction of the astrometric total mass, ages in the interval 300–500 Myr are required; the resulting masses are 0.055–0.075 for Gl 569Ba and of 0.048–0.068 for Gl 569Bb.
Collecting evidence from the orbital solution, photometry, spectroscopy, and the comparison with evolutionary models, the most likely scenario of the binary Gl 569Bab is: two very late M-type BDs with masses of 0.055–0.078 and 0.048–0.070 in a close orbit, in turn orbiting an early M-type 0.5 star, the whole system with an age in the range 250–500 Myr. Such young ages found in nearby objects are not surprising since it now seems that the Sun is located close to a region that was the site of substantial amounts of recent stellar formation (Zuckerman & Webb 2000).
Figure 8 portrays the mass-luminosity relationship for different ages as given by the evolutionary models. The two members of the pair are plotted with error bars indicating the uncertainty in luminosity and the likely mass range of each component. Masses that have depleted lithium by a factor 2 are also incorporated into the figure. According to the Arizona models, Gl 569Bb may have preserved lithium in its atmosphere, whereas this is quite unlikely based on the Lyon models. Therefore, lithium observations of this BD are needed in order to discriminate which model reproduces neatly the properties of the pair. In addition, precise radial velocity measurements of each component will lead to an accurate determination of the individual masses, and thus will also constitute a better constraint on the models. Nevertheless, models do not appear to be far from reproducing the observational properties of Gl 569Bab. Delfosse et al. (2000) show that the mass-luminosity relationship given by the Lyon models reasonably describes the low-mass stellar regime in the field. The pair Gl 569Bab has lower masses that belong to the substellar regime. Brown dwarfs around stars have been reported in the recent years (see Table 5 in Reid et al. 2001a for a compilation of the complete list), but to our knowledge none of them has been proved to be a binary itself. Gl 569Bab turns out to be the first confirmed resolved binary BD as a companion to a star.
The distance to Gl 569 implies a physical separation of 49 AU between the M2.5-type star and the substellar pair. This large separation and the high mass ratio ( 0.135 and 0.120) between the star and each of the BDs favors the fragmentation of a self-gravitational collapsing molecular cloud as the most plausible explanation for the formation of the system (Boss 2000; Bodenheimer 1998). Whether each component of the pair Gl 569Bab originated from a second fragmentation and collapse process of a small cloud core is not clear (the physical separation is 0.92 AU, and the mass ratio of the pair is 0.89). The activity of the nascent low-mass star when it was gaining mass and becoming more luminous may have caused the disruption of the less massive collapsing core into two close substellar objects before the hydrostatic core could build up enough mass to eventually start hydrogen burning. Energetic outflows and jets up to thousands of AU in length have been detected in low-mass stars of very young star forming regions (e.g., Reipurth et al. 2000; Fridlund & Liseau 1998). We cannot discard the possibility, however, that the protoplanetary disk around the star might have also played an important role in the origin of the companions. Disks extending up to several hundred AU are known to exist around stars (Bruhweiler et al. 1997). Clearly, finding other similar systems will, in addition to providing additional dynamical masses, also contribute to our knowledge of the genesis of such interesting multiple low-mass binaries.
6 Conclusions
We have obtained new observations of the Gl 569Bab pair (low-mass binary companion at a wide separation from the M2.5-type star Gl 569A), which have allowed us to derive the spectral types of each component and the orbital parameters of the system. We find that the total mass of the low-mass binary is (3-) with two detected components of M8.5 and M9 spectral types (half a subclass uncertainty) completing one eccentric ( = 0.32 0.02) orbit every 892 25 days. We have also acquired new and near-IR photometry in order to locate Gl 569Ba and Gl 569Bb in the HR diagram and compare them with the most recent evolutionary models by the Lyon group (Chabrier et al. 2000) and the Arizona group (Burrows et al. 1997). The pair is likely formed by two solar metallicity young brown dwarfs with masses in the interval 0.055–0.078 (Gl 569Ba) and 0.048–0.070 (Gl 569Bb) at the young ages of 250–500 Myr. Our adaptive optics images taken with the Keck II telescope exclude the presence of any other resolved companion with magnitudes brighter than 16.5 (3 ) at separations of 0.25″ up to 2″ from Gl 569Bab. This detection limit corresponds to masses around 0.015–0.02 for the possible age range of the system. Further radial velocity and astrometric measurements will be very valuable to detect giant planets, as well as to provide individual masses for each of the members of the pair.
References
- (1) Allen, C. W. 2000, Allen’s Astrophysical Quantitities. Fourth edition, ed. Arthur N. Cox, New York: Springer Verlag, p. 151
- Baraffe et al. (1998) Baraffe, I., Chabrier, G., Allard, F., & Hauchildt, P. H. 1998, A&A, 337, 403.
- (3) Basri, G., Marcy, Geoffrey. W., & Graham, J. R. 1996, ApJ, 458, 600
- (4) Basri, G., Mohanty, S., Allard, F., Hauschildt, P. H., Delfosse, X., Martín, E. L., Forveille, T., & Goldman, B. 2000, ApJ, 538, 363
- (5) Becklin, E. E., & Zuckerman, B. 1988, Nature, 336, 656
- (6) Bessell, M. S., Castelli, F., & Plez, B. 1998, A&A, 333, 231
- (7) Bildsten, L., Brown, E. F., Matzner, C. D., & Ushomirsky, G. 1997, ApJ, 482, 442
- (8) Bodenheimer, P. 1998, Asp. Conf. Ser., 134, p. 115
- (9) Boss, A. P. 2000, ApJ, 545, L61
- (10) Bruhweiler, F., et al. 1997, Bull. Am. Astron. Soc., 191, 47.03
- (11) Burrows, A., Hubbard, W. B., Saumon, D., & Lunine J. I. 1993, ApJ, 406, 158
- (12) Burrows, A., et al. 1997, ApJ, 491, 856
- (13) Casali, M. M., & Hawarden, T. 1992, UKIRT Newsletter, 4, 33
- (14) Chabrier, G., Baraffe, I., Allard, F., Hauschildt, P. 2000, ApJ, 542, 464
- (15) Chabrier, G., & Baraffe, I. 2000, ARA&A, 38, 337.
- (16) D’Antona, F., & Mazzitelli, I. 1994, ApJS, 90, 467
- (17) Delfosse, X., Forveille, T., Ségransan, D., Beuzit, J.-L., Udry, S., Perrier, C., & Mayor, M. 2000, A&A, 364, 217
- (18) Festin, L. 1998, A&A, 333, 497
- (19) Forrest, W. J., Skrustskie, M. F., & Shure, M. 1988, ApJ, 330, L119
- (20) Fridlund, C. V. M., & Liseau, R. 1998, ApJ, 499, L75
- (21) Gizis, J. E., Kirkpatrick, J. D., & Wilson, J. C. 2001, AJ, in press
- (22) Grossman, A. S., Hays D., & Graboske H. C. 1974, A&A, 30, 95
- (23) Heintz, W. D. 1991, AJ, 101, 1071
- (24) Henry, T. J., & Kirkpatrick, J. D. 1990, ApJ, 354, L29
- (25) Hodgkin, S. T., Pinfield, D. J., Jameson, R. F., Steele, I. A., Cossburn, M. R., & Hambly, N. C. 1999, MNRAS, 310, 87
- (26) Huensch, M., Schmitt, J. H. M. M., Sterzik, M. F., & Voges, W. 1999, A&ASupp., 135, 319
- (27) Jones, H. R. A., Longmore, A. J., Allard, F., & Hauschildt, P. H. 1996, MNRAS, 280, 77
- (28) Jones, H. R. A., Longmore, A. J., Jameson, R. F., & Mountain, C. M. 1994, MNRAS, 267, 413
- (29) Kenworthy, M., Hofmann, K., Close, L., Hinz, P. Mamajek E., Schertl, D., Weigelt, G., Angel R., Balega Y., Hinz, J., & Rieka., G., 2001, ApJ, in press.
- (30) Kirkpatrick, J. D., Henry, T. J., & McCarthy, D. W. Jr. 1991, ApJS, 77, 417
- (31) Kirkpatrick, J. D., & McCarthy, D. W. Jr. 1994, AJ, 107, 333
- (32) Kirkpatrick, J. D., et al. 1999, ApJ, 519, 802
- (33) Kirkpatrick, J. D., et al. 2000, AJ, 120, 447
- (34) Kirkpatrick, J. D., Dahn, C. C., Monet, D. G., Reid, I. N., Gizis, J. E., Liebert, J., & Burgasser, A. J. 2001, AJ, in press
- (35) Leggett, S. K., Allard, F., & Hauschildt, P. H. 1998, ApJ, 509, 836
- (36) Leggett, S. K., Allard, F., Dahn, C., Hauschildt, P. H., Kerr, T. H., & Rayner, J. 2000, ApJ, 535, 965
- (37) Leinert, C., Jahreiß, H., Woitas, J., Zucker, S., Mazeh, T., Eckart, A., & Köhler, R. 2001, A&A, 367, 183
- (38) Magazzù, A., Martín, E. L., & Rebolo, R. 1993, ApJ, 404, L17
- (39) Marcy, G. W., & Chen, G. H. 1992, ApJ, 390, 550
- (40) Martín, E. L., Basri, G., Gallegos, J. E., Rebolo, R., Zapatero Osorio, M. R., & Béjar, V. J. S. 1998, ApJ, 499, L61
- (41) Martín, E. L., Basri, G., Zapatero Osorio, M. R. 1999, AJ, 118, 1005.
- (42) Martín, E. L., Koresko, C. D., Kulkarni, S. R., Lane, B. F. & Wizinowich, P. L.,2000a, ApJ, 529, L37.
- (43) Martín, E. L., Brandner, W. Bouvier, J., Luhman, K. L., Stauffer, J. R., Basri, G., Zapatero Osorio, M. R., & Barrado y Navascués, D. 2000b, ApJ, 543, 299
- (44) McLean, I. S., et al. 1998, Proc. SPIE, 3354, 566
- (45) McLean, I. S., et al. 2000, ApJ, 533, L45
- (46) Pallavicini, R., Tagliaferri, G. & Stella, L. 1990, A&A, 228, 403
- (47) Perryman, M. A. C., et al. 1997, A&A, 323, L49
- (48) Press, W.H., Teukolsky, S.A., Vetterling, W.T., and Flannery, B.P. 1992, Numerical Recipes in C: The Art of Scientific Computing, Second Edition, Cambridge University Press.
- (49) Rebolo, R., Martín, E. L., Basri, G., Marcy, G., & Zapatero Osorio, M. R. 1996, ApJ, 469, L53
- (50) Reid, I. N., Hawley, S. E., & Gizis, J. E. 1995, AJ, 110, 1838
- (51) Reid, I. N., Kirkpatrick, J. D., Gizis, J. E., Dahn, C. C., Monet, D. G., Williams, R. J., Liebert, J., & Burgasser, A. J. 2000, AJ, 119, 369
- (52) Reid, I. N., Gizis, J. E., Kirkpatrick, J. D., & Koerner, D. W. 2001a, AJ, 121, 489
- (53) Reid, I. N., Burgasser, A. J., Cruz, K. L., Kirkpatrick, J. D., Gizis, J. E. 2001b, AJ, in press
- (54) Reipurth, B., Yu, K. C., Heathcote, S., Bally, J., Rodríguez, L. F. 2000, AJ, 120, 1449
- (55) Stauffer, J. R., Schultz, G., & Kirkpatrick, J. D. 1998, 499, L199
- (56) Tinney, C. G., Delfosse, X., & Forveille, T. 1997, ApJ, 490, L95
- (57) Wizinowich, P. L., et al. 1998, Proc. SPIE, 3353, 568.
- (58) Zboril, M., & Byrne, P. B. 1998, MNRAS, 299, 753
- (59) Zuckerman, B., & Webb, R. A. 2000, ApJ, 535, 959


| Object | log | (K) | ||||
|---|---|---|---|---|---|---|
| Gl 569Bab | 10.61 0.05 | 9.45 0.05 | 1.16 0.07 | –3.17 0.07 | 0.101–0.150 | |
| Gl 569Ba | 11.14 0.07 | 10.02 0.08 | 1.12 0.10 | –3.39 0.07 | 2440 100 | 0.055–0.078 |
| Gl 569Bb | 11.65 0.07 | 10.43 0.08 | 1.22 0.10 | –3.56 0.07 | 2305 100 | 0.048–0.070 |
| Date | Epoch | Separation | P.A. |
|---|---|---|---|
| (MJD) | (″) | (∘) | |
| 1999 Aug 29 | 51419.270 | ||
| 2000 Feb 18 | 51592.600 | ||
| 2000 Feb 25 | 51599.644 | ||
| 2000 Jun 20 | 51715.408 | ||
| 2000 Aug 24 | 51780.283 | ||
| 2001 Jan 09 | 51918.665 | ||
| 2001 May 10 | 52039.410 |
| K i wavelength (m) | Na i wavelength (m) | H2OaaRatio of the average flux in a 0.02 m window centred on 1.34 m and on 1.29 m (Reid et al. 2001a). | CObbRatio of the average flux in a 0.06 m window centred on 2.25 m and on 2.33 m (Jones et al. 1994). | |||||||
|---|---|---|---|---|---|---|---|---|---|---|
| Object | SpT | 1.169ccAll wavelengths in m. | 1.177ccAll wavelengths in m. | 1.244ccAll wavelengths in m. | 1.253ccAll wavelengths in m. | 2.206ccAll wavelengths in m. | 2.209ccAll wavelengths in m. | 1.330ccAll wavelengths in m. | 2.294ccAll wavelengths in m. | |
| Gl 569Ba | M8.5 | 6.5 | 7.5 | 4.7 | 4.8 | 1.4 | 0.70 | 0.72 | 1.21 | |
| Gl 569Bb | M9.0 | 6.5 | 7.7 | 5.2 | 5.1 | 0.9 | 0.50 | 0.70 | 1.24 | |
| Parameter | Value | ||
|---|---|---|---|
| Period, | 892 | 25 day | |
| Eccentricity, | 0.32 | 0.02 | |
| Semi-Major Axis, | 0.90 | 0.02 AU | |
| Inclination, | 34 | 3 deg | |
| Arg. Periapsis, | 76 | 4 deg | |
| Long. of Ascending Node, | 141 | 4 deg | |
| Epoch (MJD), | 51820 | 4 day | |
| Age | Gl 569Ba | Gl 569Bb | Total mass |
|---|---|---|---|
| (Myr) | () | () | () |
| 200 | 0.055 | 0.048aaShould have (partially) preserved lithium. | 0.103 |
| 250 | 0.061 | 0.053aaShould have (partially) preserved lithium. | 0.114 |
| 300bbThese estimates match the mean astrometric orbital solution. | 0.069bbThese estimates match the mean astrometric orbital solution. | 0.059bbThese estimates match the mean astrometric orbital solution. | 0.128bbThese estimates match the mean astrometric orbital solution. |
| 400 | 0.072 | 0.065 | 0.137 |
| 500 | 0.078 | 0.070 | 0.148 |
| 700ccThe total mass inferred for this age is even beyond the 3 uncertainty of our astrometric solution. | 0.082ccThe total mass inferred for this age is even beyond the 3 uncertainty of our astrometric solution. | 0.074ccThe total mass inferred for this age is even beyond the 3 uncertainty of our astrometric solution. | 0.156ccThe total mass inferred for this age is even beyond the 3 uncertainty of our astrometric solution. |