Chandra finds X-ray jets are common in low-power radio galaxies
Abstract
We present results for the first three low-power radio galaxies from the B2 bright sample to have been observed with Chandra. Two have kpc-scale radio jets, and in both Chandra resolves jet X-ray emission, and detects soft X-ray core emission and an X-ray emitting galaxy-scale atmosphere of luminosity a few ergs s-1. These are the first detections of X-ray jets in low-power radio galaxies more distant than Cen A and M 87. The cooling time of the galaxy-scale gas implies mass infall rates of order one solar mass per year. The gas pressure near the jets is comparable to the minimum pressure in the jets, implying that the X-ray emitting gas may play an important role in jet dynamics. The third B2 radio galaxy has no kpc-scale radio jet, and here only soft X-ray emission from the core is detected. The ratio of X-ray to radio flux is similar for the jets and cores, and the results favour a synchrotron origin for the emission. kpc-scale radio jets are detected in the X-ray in ks exposures with Chandra more readily than in the optical via HST snapshot surveys.
keywords:
galaxies:active – galaxies:individual: 0206+35 – galaxies:individual: 0331+39 – galaxies:individual: NGC 2484 – galaxies: jets – X-rays:galaxies1 Introduction
Radio observations of low-power FRI (Fanaroff & Riley 1974) radio galaxies are best interpreted by models in which the jet plasma slows from relativistic () to sub-relativistic () speeds within a few kpc of the nucleus (Laing et al. 1999). Decreasing jet asymmetries at sub-kpc to kpc distances from the nucleus can then be understood as the diminishing effect of Doppler boosting. The jets at termination blend into the lobe plasma they supply. In contrast, the jet asymmetry seen in powerful, FRII, sources supports velocities as large as at tens of kpc or more from their cores (Wardle & Aaron 1997). Bright hotspots mark jet termination in these objects.
The relativistic particles responsible for the jets in FRI and FRII sources are expected to emit elsewhere in the electromagnetic spectrum, and the X-ray is no exception. However, it is jet features of the powerful FRII sources which have so far yielded the largest number of X-ray detections. These are (a) hotspots in Cyg A (Carilli, Perley and Harris 1994), 3C 295 (Harris et al. 2000), and 3C 123 (Hardcastle, Birkinshaw & Worrall 2001a), where the X-rays have been interpreted as due to synchrotron self-Compton (SSC) emission of plasma at minimum energy, (b) hotspots in 3C 390.3 (Prieto 1997), 3C 120 (Harris et al. 1999), and Pic A (Wilson, Young & Shopbell 2001), where the interpretation is less clear, and (c) emission associated with large-scale jets in 3C 273 (Marshall et al. 2001), PKS 0637-752 (Schwartz et al. 2000), and Pic A (Wilson et al. 2001).
Low-power radio galaxies typically reside in group-scale X-ray emitting atmospheres (Worrall & Birkinshaw 2000). While the evacuation of the hot X-ray plasma from the radio lobes has apparently been seen in sources such as NGC 1275 (Böhringer et al. 1993), 3C 449 (Hardcastle, Worrall & Birkinshaw 1998), and M 84 (Finoguenov & Jones 2001), and evidence for inverse Compton X-rays from the lobes in Fornax A (Feigelson et al. 1995), jet X-ray emission has been reported only in the two nearby low-power sources Cen A (Döbereiner et al. 1996; Kraft et al. 2000) and M 87 (Biretta, Stern & Harris 1991; Böhringer et al. 2001).
| Name | 408 MHz power | kpc/ | Galactic NH | J2000 X-ray core position | shift | Date | Screened | ||
|---|---|---|---|---|---|---|---|---|---|
| W Hz-1 sr-1 | arcsec | ( cm-2) | J2000 radio core position | (arcsec) | Exposure (ks) | ||||
| B2 0206+35 | 0.0369 | 2.42 | 1.02 | 5.9 | 02 09 38.57 | 35 47 48.3 | 2.6 | 2000 Mar 18 | 7.387 |
| 02 09 38.560 | 35 47 50.92 | ||||||||
| B2 0331+39 | 0.0204 | 0.261 | 0.58 | 14.6 | 03 34 18.40 | 39 21 22.2 | 2.3 | 2000 Apr 1 | 5.150 |
| 03 34 18.419 | 39 21 24.44 | ||||||||
| B2 0755+37, NGC 2484 | 0.0428 | 3.80 | 1.17 | 5.02 | 07 58 27.95 | 37 47 10.6 | 2.2 | 2000 Apr 3 | 6.716 |
| 07 58 28.108 | 37 47 11.81 | ||||||||
We use km s-1 Mpc-1, , throughout. Uncertainties in positions of the radio cores, from data of Figs. 1-3, are estimated to be arcsec for B2 0206+35 and 0331+39 and arcsec for B2 0755+37. Redshift and radio power from Colla et al. (1975).
We have embarked on a high spatial-resolution study with Chandra of the X-ray emission from the inner regions of typical low-power radio galaxies, where the radio-emitting plasma is expected to have relativistic bulk motion. Our targets are drawn from the bright B2 sample, which is the complete subset of 50 sources from the B2 radio survey identified with elliptical galaxies brighter than mag and well matched to BL Lac objects in extended radio properties and galaxy magnitudes (Colla et al. 1975; Ulrich 1989). ROSAT pointed observations with either the PSPC or HRI (or in some cases both) have been made for 80 per cent of the sources in the bright B2 sample (Canosa et al. 1999), making this the largest unbiased sample of exclusively low-power radio galaxies with sensitive X-ray data. We used a correlation of core unresolved (to ROSAT) X-ray and radio emission to argue for a component of soft X-ray emission associated with the inner radio jets (Canosa et al. 1999). However, the spatial resolution and sensitivity were insufficient to distinguish between truly small-scale non-thermal emission and small-scale hot gas possibly associated with cooling flows, and most observations were with the ROSAT HRI with which no spectral information was available. Here we present results for the first three B2 sources to have been observed with Chandra. They indicate that resolvable X-ray jets are common even in low-power radio galaxies.
2 Chandra Observations
We observed B2 0206+35, 0331+39 and 0755+37 with the Advanced CCD Imaging Spectrometer (ACIS) on board the Chandra X-ray Observatory on the dates given in Table 1. The targets were near the aim point on the back-illuminated CCD chip S3, shifted slightly from the original aim point to avoid sitting on a boundary between readout nodes. The observations were made in window mode with frame times of 0.44 s for B2 0331+39 and 0.87 s for the other two sources, in order to guard against the effects of pile-up should all the flux which was unresolved to ROSAT be unresolved also to Chandra. The data provided to us had been processed using version R4CU4UPD7.4 (for B2 0206+35) and R4CU5UPD2 (for the other two sources) of the pipeline software, and we followed the “science threads” from the Chandra X-ray Center (CXC) for CIAO v 1.1.5 to make the recommended corrections to these data, and in particular to apply the appropriate gain file, acisD2000-01-29gainN0001.fits. After screening out 15 per cent of each observation to avoid intervals of high background, the exposure times are as given in Table 1.
The radio core positions are known with high precision, and an overlay of the X-ray and radio images confirms that the astrometry in the pipeline software used on these X-ray data sets is imprecise (see http://asc.harvard.edu/mta/ASPECT/). The X-ray positions given in Table 1 have been shifted to align with the (accurate) radio positions also given in the table.
| B2 Name | Energy (keV) | Weight |
| 0206+35 | 0.65 | 0.39 |
| 0.9 | 0.24 | |
| 1.25 | 0.27 | |
| 1.75 | 0.1 | |
| 0331+39 | 0.7 | 0.47 |
| 1.25 | 0.28 | |
| 1.75 | 0.13 | |
| 3.0 | 0.12 | |
| 0755+37 | 0.6 | 0.42 |
| 0.9 | 0.19 | |
| 1.25 | 0.25 | |
| 2.0 | 0.14 |
Since we are interested in features on scales close to Chandra’s spatial resolution, we have found it convenient to represent the Point Response Function (PRF) with an analytical function, and we give our fitted parameter values here as they may be of use to other workers. The procedure we followed was to use ciao/mkpsf and the CXC-released PRF library to create for each source an image of the PRF with 0.1 arcsec spatial binning and weighted (in four energy bins) according to the source spectrum between 0.4 and 5 keV (since these sources are relatively soft). We convolved the result with a Gaussian of arcsec to mimic the effects of aspect smearing (see http://asc.harvard.edu/ciao1.1/caveats/acis2.html), and then used the iraf/imcnts task to extract the radial profile of the PRF. We found the 12-parameter function
with in units of arcsec, to be a good representation of the PRF. We first fitted the functional form to a profile extracted from the low-resolution PRF library, to find the best parameter values for the PRF wings. We then fixed the parameters of the broadest Gaussian, and re-fitted to the radial profile from the high-resolution PRF library in order to find the best overall representation of the PRF for the observation. The energy weightings used for the three sources are given in Table 2 and the fitted parameter values are in Table 3. The resulting profiles are fairly similar, with half power diameter (HPD) between 0.78 and 0.86 arcsec, and full width half maximum (FWHM) between 0.53 and 0.62 arcsec.
| B2 Name | ||||||||||||
|---|---|---|---|---|---|---|---|---|---|---|---|---|
| 0206+35 | 1.58 | 1.965 | 1.947 | 0.3523 | 2.059 | 1.361 | 2.618 | 1.407 | 5.146 | 4.695 | 1.247 | 10.68 |
| 0331+39 | 2.029 | 3.527 | 1.859 | 0.4326 | 0.9569 | 0.4997 | 0.8484 | 1.638 | 5.456 | 4.871 | 1.256 | 11.36 |
| 0755+37 | 1.948 | 3.538 | 3.454 | 0.3462 | 1.902 | 1.219 | 2.272 | 1.452 | 4.987 | 4.538 | 1.211 | 10.79 |
The profiles are normalized to 1.03 rather than 1.0; this is correct for 0.1 arcsec bins and any radial-profile extraction routine which works like iraf/imcnts in considering square pixels as falling entirely in or out of an annulus rather than weighted by area.
3 X-rays from the galaxy, radio core and jet
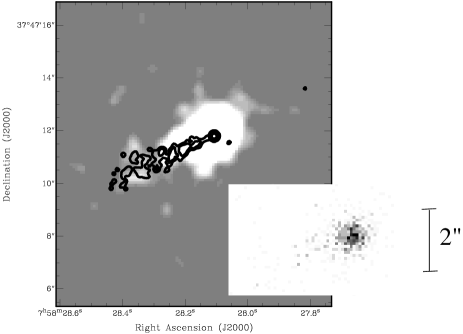
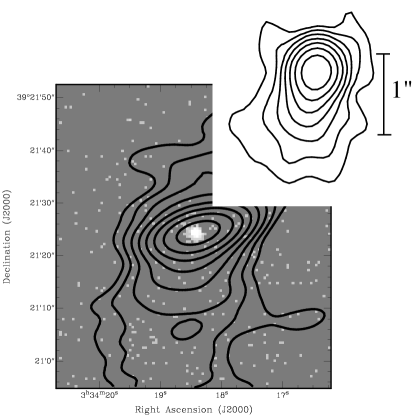
Compared with the ROSAT PSPC, which preferentially detected group-scale gas (Worrall & Birkinshaw 2000), Chandra clearly sees small-scale emission from B2 radio galaxies. As seen in Figs 1 and 2, B2 0206+35 and 0755+37 are very similar, with asymmetric X-ray emission coincident with the dominant kpc-scale radio jet. B2 0331+39 (Fig. 3) shows no such asymmetry, but in this less powerful radio source there is no obvious radio jet, either because of a small viewing angle, which could superimpose the jet X-ray emission on the core, or because well-collimated kpc-scale plasma is simply absent in this source. The relatively high ratio of core (Table 4) to extended (Table 1) radio emission in this source might argue in favour of the former explanation.
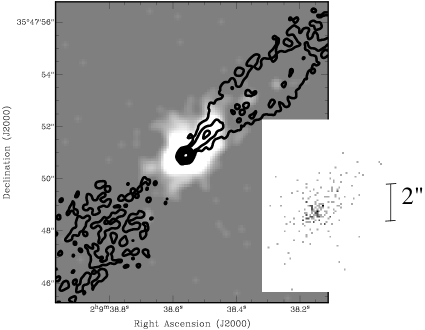
The radial profile of B2 0331+39 gives a good fit to the PRF (Fig. 4). The central emission of the other two sources is weaker and partially extended: fits to the radial profile over a semi-circular region in the anti-jet direction in both cases finds an excess of counts over the PRF. Good fits (Table 5) are found for a combination of point-like and extended emission, modelled as a model with counts per unit area per unit time . Best-fit values of and are 0.7 and 1.15 arcsec, and 0.8 and 2.1 arcsec, for 0206+35 and 0755+37, respectively. The extended emission can be attributed to galaxy-scale gas with a luminosity of a few times ergs s-1. The cooling times of this gas are short compared with the Hubble time, with mass infall of about one solar mass per year (Table 5). Upper limits for B2 0331+39 allow for the presence of galaxy gas at a luminosity only a factor of a few below that measured in the other two sources. It is noteworthy that the galaxy in our sample without a kpc-scale radio or X-ray jet also has the least central, X-ray emitting, cooling, gas.
| B2 Name | Core | Jet | ||||
|---|---|---|---|---|---|---|
| GHz | length | radius | ||||
| mJy | arcsec | arcsec | mJy | Pa | ||
| 0206+35 | 8.44 | 972 | 2 | 0.15 | 202 | 3.1 |
| 0331+39 | 4.86 | 3034 | – | – | – | – |
| 0755+37 | 1.66 | 1504 | 4 | 0.2 | 938 | 2.1 |
For 0331+39, no clear jet is seen; the core flux includes all the components seen on the high-resolution insert in Fig. 3. Jet radius is HWHM of best-fitting Gaussian model. is the minimum pressure in the jet assuming an electron energy spectrum of number index 2.0 between and , no relativistic protons, and a filling factor of unity.

| B2 name | Core | Jet | Gas | /dof | |||||||
| Counts | ( | Counts | ( | Counts | ( | ||||||
| ergs s-1) | (nJy) | ergs s-1) | (nJy) | 15 kpc | ergs s-1) | M⊙/yr | ( Pa) | ||||
| 15 kpc | |||||||||||
| 0206+35 | 2.9 | 9.6 | 41 | 1.6 | 5.2 | 2.6 | 0.1/4 | ||||
| 0331+39 | 75628 | 16.0 | 200.0 | – | – | – | 0.75 | – | – | 7.9/7 | |
| 0755+37 | 19.0 | 47.6 | 98 | 3.9 | 9.7 | 4.2 | 6.8/6 | ||||
Counts and luminosities are for energies between 0.4 and 5 keV. /dof is for spatial fit to a point-source for 0331+39, and to a point source plus an extended component in the anti-jet semicircle for 0206+35 and 0755+37, although the counts and luminosities given are over all angles. Mass deposition rate, , and central gas pressure, , are calculated (Birkinshaw & Worrall 1993) over all acceptable combinations of and . The upper limits for 0331+39 are based on a gas model with , arcsec, keV, and 0.3 solar abundance. Parameter values other than counts use the best-fit spectral parameters from Table 6, with the power-law parameters applied to both core and jet.
| B2 Name | Power law energy | intrinsic | abundance | /dof | |
|---|---|---|---|---|---|
| index, | ( cm-2) | (keV) | /solar | ||
| 0206+35 | – | 8.4/5 | |||
| 0331+39 | – | – | 29.5/30 | ||
| 0755+37 | 19.0/26 |
Absorption through the Galactic column (Table 1) has been applied to all fits. Intrinsic column density is applied only to the power law components: it is neither required nor usefully constrained in the fits for 0206+35. Errors are for one interesting parameter. Upper limits are significance.
The X-ray spectral fits to the net counts within a radius of 10 arcsec around each source (Table 6) support the spatial modelling. While B2 0331+39 gives an acceptable fit to a power law, the other two sources either give unacceptable fits to single-component models (power law or Raymond-Smith thermal), or improves significantly when the second component is added. The normalizations of the power-law and thermal models in the two-component fits imply a division of counts between corejet and gas which agrees well with the spatial separation of components. The gas has a temperature reasonable for its luminosity as compared with the extrapolation of the temperature-luminosity relationship for the larger-scale group/cluster atmospheres around low-power radio galaxies (see figure 7 of Worrall & Birkinshaw 2001).
Our ROSAT studies of low-power radio galaxies had separated some of the PSPC emission into thermal gas associated with the group or cluster (Worrall & Birkinshaw 1994, 2000), and attributed the remaining compact emission, or that unresolved with the HRI (Canosa et al. 1999), to a component associated with the small-scale radio structures. Although Chandra resolves a fraction of the emission we previously associated with the AGN (compare table 4 of Canosa et al. 2000 with Table 5), our description of a low-power radio galaxy as emitting significant small-scale radio-related X-ray emission is confirmed. Chandra’s superior spatial resolution reveals power-law emission from an unresolved core in all three sources, and X-ray jets in the two sources with small-scale radio jets.
Although three is too small a sample to claim a correlation, it is interesting that the core radio flux densities (which are assumed typical in having flat radio spectra) are in the same rank order as the core X-ray flux densities. The core X-ray spectra are soft. A small intrinsic absorption of a few 1020 cm-2 is measured in B2 0331+39, and an upper limit for B2 0755+37 allows for comparable amounts. Such absorption is consistent with expectations from the dusty medium which HST finds to be typical in such radio galaxies: compare the detailed analysis of Ferrarese & Ford (1999) for one source with the general findings concerning dust in B2 radio galaxies of Capetti et al. (2000). It remains plausible that the core X-ray emission is associated with the relativistic particles directly responsible for VLBI-scale radio emission, as our earlier work suggested (Worrall & Birkinshaw 1994).
The galaxy-scale gas may play a role in the confinement, disruption, or slowing of the jets in the crucial region within a few kpc of the nucleus. Calculations of internal jet pressures are model dependent. In Table 4 we give values for the minimum pressure on the simplest assumption that the jets are in the plane of the sky and that relativistic effects can be ignored. The effects of relativistic beaming and projection will tend to reduce these values, by a factor of about four in the case of Bondi et al. (2000)’s model for B2 0755+35. It is interesting that the kpc-scale jet pressures are similar to the central gas pressures. Deeper Chandra X-ray observations are needed for detailed modelling of the interface between the gas and jet plasma, such as in our study of B2 0104+32 (3C 31: Hardcastle et al., in preparation).
4 Discussion and Conclusions
The Chandra observations of B2 radio galaxies support the general picture of a low-power radio galaxy having galaxy-scale gas, a compact X-ray core, and X-ray jet emission associated with fast, one-sided, kpc-scale, radio jets. The presence also of group- or cluster-scale gas is known from ROSAT, but this appears as structureless background in our high-resolution, reduced field-of-view, Chandra images.
For both sources with radio and X-ray jet emission, the jet emission is an appreciable fraction of the core emission (of order 20-50 per cent) in both the X-ray and radio. This similarity of X-ray to radio ratio for the jets and cores argues in favour of the core and jet X-ray components both being radio-related in origin, supporting our earlier conclusions (Worrall & Birkinshaw 1994).
Contending emission mechanisms for the jet X-rays are synchrotron radiation from particles of higher energy than those contributing the radio emission, or Compton scattering of jet-produced or external photons. The X-ray spectrum can help to decide between these possibilities, since it has a direct relationship to the spectrum of the particles responsible for the radiation. A steep X-ray spectrum would tend to rule out a Compton-scattering origin, and instead suggest synchrotron emission from high-energy electrons of steeper spectrum than those emitting in the radio. In B2 0331+39 the X-ray spectrum is indeed steep, but these shallow X-ray observations lead to constraints that are too poor to draw useful conclusions for B2 0206+35 and 0755+37. However, the X-ray flux levels of the jets are most easily explained by a synchrotron model. Synchrotron self-Compton emission with an equipartition magnetic field produces an X-ray flux density orders of magnitude below the observed value, using the jet parameters given in Table 4. FRI jets are generally thought to move too slowly (§1) for the effective energy density in microwave-background photons to be significantly increased by boosting (Tavecchio et al. 2000), and, even if the regions concerned do have very high flow velocities, the jets are unlikely to be close enough to the line of sight for the mechanism to be important. The dominant photon population in the jets is likely to be beamed radiation from the active nuclei, and although estimates of the inverse Compton X-ray yield are strongly model dependent, we find they are likely to fall short by an order of magnitude under plausible assumptions (Hardcastle, Birkinshaw & Worrall 2001b). A synchrotron model requires a steepening of the spectral index between the radio and X-ray if it is not to over-produce the X-rays, but such spectral breaks are observed in well-studied optical synchrotron jets such as M87 and 3C 66B, for which multiwavelength data are compiled in Hardcastle et al. (2001b).
It is easier to detect jet X-ray emission with Chandra than jet optical emission with HST, at least for sources with relatively high core dominances such as these. In two out of our three sample sources, and both of those with kpc-scale radio jets, X-ray jets are detected. In contrast, Capetti et al. (2000) report detection of only three of 57 representative B2 radio galaxies observed in an HST snapshot survey, even though roughly 45 per cent of all B2 radio galaxies have kpc-scale radio jets (Parma et al. 1987). Interestingly, B2 0755+37 is one of the three sources with detected optical jets, and so more detailed modelling of the spectral energy distribution of this jet will be possible.
We are currently analysing data for five other low-power radio galaxies that we have observed more recently with Chandra, two of which are from the B2 sample, and all five show jet features. At the spatial resolution possible with Chandra, X-ray jets are indeed common. As more data are forthcoming it should be possible to make a detailed study of the underlying physics which controls the strength of X-ray emission in these low-power jets.
Acknowledgments
We thank Marco Bondi for the processed MERLIN image of B2 0755+37, John Biretta and Paola Parma for use of their VLA archival data on B2 0206+35 and B2 0331+39, respectively, and staff of the CXC for help concerning calibrations and the ciao and ds9 software.
References
- [] Biretta, J.A., Stern, C.P., Harris, D.E., 1991, AJ, 101, 1632
- [] Birkinshaw, M., Worrall, D.M., 1993, ApJ, 412, 568
- [] Böhringer, H., Voges, W., Fabian, A.C., Edge, A.C., Neumann, D.M., 1993, MNRAS, 264, L25
- [] Böhringer et al., 2001, A&A, 365, L188
- [] Bondi, M., Parma, P., de Ruiter, H., Fanti, R., Laing, R.A., Fomalont, E.B., 2000, MNRAS, 314, 11
- [] Canosa, C.M., Worrall, D.M., Hardcastle, M.J., Birkinshaw, M., 1999, MNRAS, 310, 30
- [] Capetti, A., de Ruiter, H.R., Fanti, R., Morganti, R., Parma, P., Ulrich, M.-H., 2000, A&A, 362, 871
- [] Carilli, C.L., Perley, R.A., Harris, D.E., 1994, MNRAS, 270, 173
- [] Colla, G., Fanti, C., Fanti, R., Gioia, I., Lari, C., Lequeux, J., Lucas, R., Ulrich, M.-H., 1975, A&AS, 20, 1
- [] Döbereiner, S. et al., 1996, ApJ, 470, L15
- [] Fanaroff, B.L., Riley, J.M. 1974, MNRAS, 167, 31p
- [] Feigelson, E.D., Laurent-Muehleisen, S.A., Kollgaard, R.I., Fomalont, E., 1995, ApJ, 449, L149
- [] Ferrarese, L., Ford, H.C., 1999, ApJ, 515, 583
- [] Finoguenov, A., Jones, C., 2001, ApJ, 547, L107
- [] Hardcastle, M.J., Worrall, D.M., Birkinshaw, M, 1998, MNRAS, 296, 1098
- [] Hardcastle, M.J., Birkinshaw, M., Worrall, D.M. 2001a, MNRAS, 323, L17
- [] Hardcastle, M.J., Birkinshaw, M., Worrall, D.M. 2001b, MNRAS, in press
- [] Harris, D.E., Hjorth, J., Sadun, A.C., Silverman, J.D., Vestergaard, M., 1999, ApJ, 518, 213
- [] Harris, D.E. et al., 2000, ApJ, 530, L81
- [] Kraft, R.P. et al., 2000, ApJ, 531, L9
- [] Laing, R.A., Parma, P., de Ruiter, H.R., Fanti, R., 1999, MNRAS, 306, 513
- [] Marshall, H.L. et al., 2001, ApJ, 549, L167
- [] Parma, P., Fanti, C., Fanti, R., Morganti, R., de Ruiter, H.R., 1987, A&A, 181, 244
- [] Prieto, M.A., 1997, MNRAS, 284, 627
- [] Schwartz, D.A. et al., 2000, ApJ, 540, L69
- [] Tavecchio F., Maraschi L., Sambruna R.M., Urry C.M., 2000, ApJ, 544, L23
- [] Ulrich, M.-H., 1989, in L. Maraschi, T. Maccacaro & M.-H. Ulrich, eds, BL Lac Objects, Springer-Verlag, Berlin, p. 45
- [] Wardle, J.F.C., Aaron, S.E., 1997, MNRAS, 286, 425
- [] Wilson, A.S., Young, A.J., Shopbell, P.L., 2001, ApJ, 547, 740
- [] Worrall, D.M., Birkinshaw, M., 1994, ApJ, 427, 134
- [] Worrall, D.M., Birkinshaw, M., 2000, ApJ, 530, 719
- [] Worrall, D.M., Birkinshaw, M., 2001, ApJ, 551, 178