11email: nchristlieb/dreimers@hs.uni-hamburg.de 22institutetext: Harvard-Smithsonian Center for Astrophysics, 60 Garden Street, Cambridge, MA 02140, USA
22email: pgreen@cfa.harvard.edu 33institutetext: Institut für Physik, Universität Potsdam, Am Neuen Palais 10, D-14469 Potsdam, Germany
33email: lutz@astro.physik.uni-potsdam.de
The stellar content of the Hamburg/ESO survey††thanks: Based on observations collected at the European Southern Observatory, Chile (Proposal IDs 145.B-0009 and 63.L-0148). Table B.1 is only available in electronic form at the CDS via anonymous ftp to cdsarc.u-strasbg.fr (130.79.125.5) or via http://cdsweg.u-strasbg.fr/Abstract.html.
We present a sample of 403 faint high latitude carbon (FHLC) stars selected from the digitized objective prism plates of the Hamburg/ESO Survey (HES). Because of the Å spectral resolution and high signal-to-noise ratio of the HES prism spectra, our automated procedure based on the detection of C2 and CN molecular bands permits high-confidence identification of carbon stars without the need for follow-up spectroscopy. From a set of 329 plates (87 % of the survey), covering deg2 to a magnitude limit of , we analyze the selection efficiency and effective surface area of the HES FHLC survey to date. The surface density of FHLC stars that we detect ( deg-2) is 2–4 times higher than that of previous objective prism and CCD surveys at high galactic latitude, even though those surveys claimed a limiting magnitude up to magnitudes fainter. This attests to the highest selection sensitivity yet achieved for these types of stars.
Key Words.:
Stars:carbon – Surveys – Galaxy:halo1 Introduction
Models of the chemical and dynamical properties of the Galactic spheroid (the ‘halo’) are still rather weakly constrained. In the grand scheme, did a monolithic protogalaxy undergo rapid collapse and enrichment (Eggen et al. 1962), or did many smaller dwarf galaxies merge together (Searle & Zinn 1978)? Both processes probably contribute, since there is solid recent evidence of ongoing mergers (Ibata et al. 1994; Majewski et al. 2000). Stars and gas that are tidally stripped from accreting dwarf galaxies remain aligned with the orbit of the satellite for timescales comparable to the age of the Galaxy. Thus, a number of tidal streams exist today whose phase-space signature can constrain the stripping and merging events that contribute to the present-day galactic halo (Johnston et al. 1999).
An important goal of astronomy in this century is to measure and model the potential of the Milky Way using halo stars as tracers. To simultaneously disentangle the remnants of disrupted satellites requires full knowledge of the angular positions, proper motions, radial velocities, and distances of a large number of such stars. But first, a large sample of distant halo stars must be amassed. Intrinsically bright stars visible to large galactocentric distances (– kpc) provide the best opportunity. Because they are readily recognizable from their strong C2 and CN absorption bands, and because they were thought to be giants without exception, faint C stars have been sought as excellent tracers of the outer halo.
Faint high galactic latitude carbon (FHLC) stars have been sought in prior objective prism surveys (e.g., Sanduleak & Pesch 1988; MacAlpine & Lewis 1978) and in the CCD survey of Green et al. (1994). Objective-prism photography with wide-field Schmidt telescopes has yielded low-dispersion spectra for thousands of objects over substantial portions of the sky, but not a large number of carbon stars. Fewer than 1% of the stars in Stephenson’s (1989) catalogue are the faint, high-latitude carbon (FHLC) stars () most useful as dynamical probes of the outer halo. The two most prolific sources of published FHLC stars, the Case low-dispersion survey (CLS; Sanduleak & Pesch 1988) and the University of Michigan – Cerro Tololo survey (UM; MacAlpine & Williams 1981) appear to probe to about and have provided about 30 FHLC stars. Emission-line objects, not FHLC stars, were the primary goal of these photographic surveys, and known FHLC stars were not examined to help predefine selection criteria or estimate completeness. The surface density of FHLC stars from objective-prism surveys is low, about one per 50 deg2 to . At high galactic latitudes, mostly warm carbon stars are found – CH stars, and possibly some R stars. However, color selection of very red stars at high latitude also reveals a small number (one per 200 deg2 to ) of classical intermediate age AGB carbon (AGBC) stars (Totten & Irwin 1998). Margon et al. (2000) recently reported the discovery of more than 30 new FHLC stars in the commissioning data of the Sloan Digitized Sky Survey (SDSS), which may eventually provide the majority of known FHLC stars.
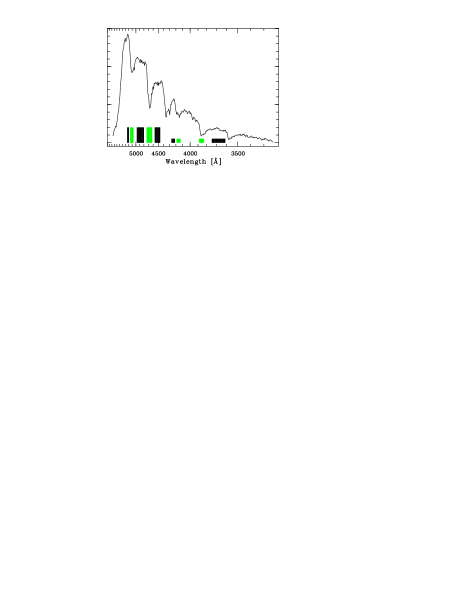
In this paper, we describe our use of the Hamburg/ESO survey (HES; Wisotzki et al. 1996; Reimers & Wisotzki 1997; Wisotzki et al. 2000) to greatly augment the number of known FHLC stars. The HES is an objective-prism survey designed to select bright () quasars in the southern extragalactic sky (; ). It is based on IIIa-J plates taken with the 1 m ESO Schmidt telescope and its 4∘ prism, yielding a wavelength range of and a seeing-limited spectral resolution of typically 15 Å at H. This resolution makes possible the identification of carbon stars with high confidence without follow-up slit spectroscopy, based on their strong C2 and CN molecular bands (cf. Fig. 1).
Since carbon can reach the surface of an isolated star only in late evolutionary stages, it has long been assumed that all carbon (C) stars are giants. Due to their high luminosity (), it is possible to detect the red AGBC stars at large distances: Brewer et al. (1996) have identified C stars even in the local group galaxy M31. The more typical FHLC stars such as CH giants, with , can be detected to kpc in sensitive photographic surveys. However, the long-held assumption that all C stars are giants has fallen. Trigonometric parallax measurements for the carbon star G77–61 (Dahn et al. 1977) showed that this star lies close to the main sequence (). For years, the dwarf carbon (dC) stars phenomenon was assumed to be extremely rare until many new dCs were discovered in the early 1990s (Green et al. 1991, 1992; Warren et al. 1993; Heber et al. 1993; Liebert et al. 1994). Discovery of so many dCs, and the remarkable similarity of their spectra to those of C giants means that care must be taken to distinguish dwarfs from giants in FHLC star samples intended for distant halo studies (Green et al. 1992). We are therefore undertaking a two-part investigation. In the current paper, we describe our automated selection of C stars in the HES, and we present a large, uniformly selected, and flux-limited sample of FHLC stars. We complement this sample in upcoming work with recent epoch astrometry, to measure proper motions for as many objects as possible, and thereby separate the dCs from C giants.
We note that carbon-enhanced, metal-poor stars may be among the FHLC stars presented here. It was recognized by several authors that the fraction of such stars among metal-poor stars rises with decreasing metallicity, reaching % for stars with , and that carbon overabundances are as high as dex (e.g., Norris et al. 1997; Rossi et al. 1999). 12C/13C isotope measurements of a larger sample of such stars would help to identify the carbon production site(s) at work.
2 Carbon Star Selection
The full HES database consists of million extracted, wavelength calibrated spectra. The input catalog for extraction of objective-prism spectra is generated by using the Digitized Sky Survey I (DSS I). An astrometric transformation between DSS I plates and HES plates yields, for each object in the input catalog, the location of its spectrum on the relevant HES plate, and provides a wavelength calibration zero point (Wisotzki et al. 2000).
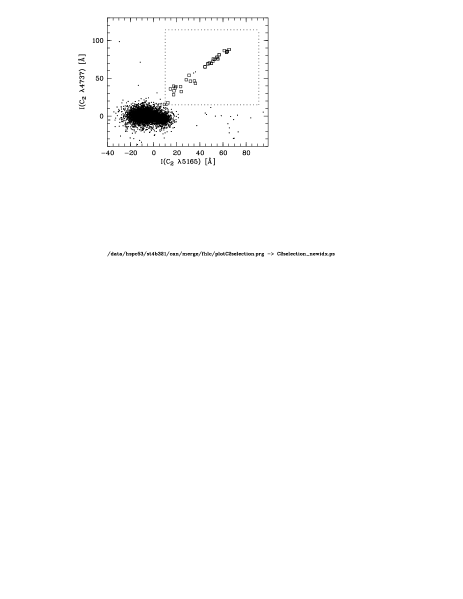
Carbon stars can be identified in the HES data base by their strong C2 and CN bands. We select carbon star candidates when the mean signal-to-noise ratio () in the relevant wavelength range is per pixel and both of the C2 bands , , or both of the CN bands , are stronger than a selection threshold. Band strengths are measured by means of line indices – ratios of the mean photographic densities in the carbon molecular absorption features and the continuum bandpasses shown in Fig. 1, and listed in Tab. 1. The use of pairs of indices prevents confusion with plate artifacts, e.g., scratches. It is very unlikely that two such artifacts are present at the positions of two molecular bands. Selection boxes in the versus and versus planes were chosen well-separated from the dense locus of “normal” stars (see Fig. 2). The selection criteria are listed in Tab. 2.
| Use for band index | ||||
|---|---|---|---|---|
| Passband | C2 5165 | C2 4737 | CN 4216 | CN 3883 |
| 5190–5240 Å | cont | |||
| 5060–5150 Å | flux | |||
| 4800–4970 Å | cont | cont | ||
| 4620–4730 Å | flux | |||
| 4460–4560 Å | cont | |||
| 4210–4270 Å | cont | |||
| 4130–4180 Å | flux | |||
| 3830–3890 Å | flux | |||
| 3610–3740 Å | cont | |||
| Feature | Index range [Å] |
|---|---|
| [10,91] | |
| [15,114] | |
| [2,56] | |
| [13,55] |
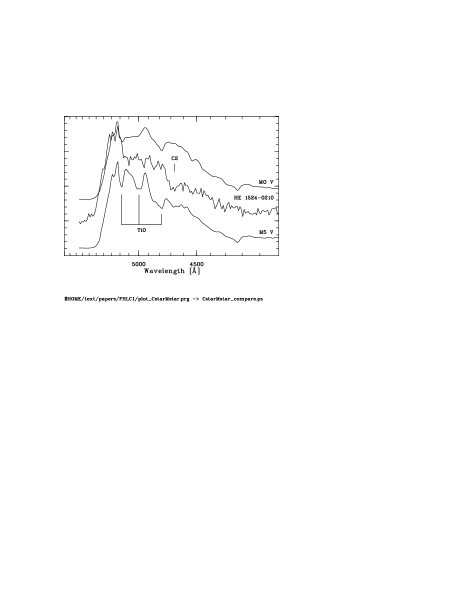
Carbon stars can be distinguished reliably from other late type stars, e.g. M or S stars, even if only weak C bands are present in their spectra (cf. Fig. 3).
Other potential sample contaminators are white dwarfs of type DQ, which show carbon molecular bands. However, since the latter usually have a much bluer continuum (see Fig. 6), they can easily be recognized by visual inspection of the spectra, and by their color. McCook & Sion (1999) list 49 DQs, of which 30 have an available measurement. The average of those is , i.e., mag away from the average of the HES C star sample. Our colors are measured directly from the HES spectra with a mean accuracy of mag (Christlieb et al. 2001, herafter Paper I). The average of HES C stars is , more than 90 % have , and there is no C star of in the HES sample. While 4 (i.e., 13 %) of the 30 DQs with in McCook & Sion (1999) have , the pressure-broadened features of DQs are easily distinguished by visual inspection of the carbon bands (see Fig. 6).
With a rough estimate of their surface density, we can quantify an upper limit for the contamination of the HES C star sample by “red” () DQs. First of all, we have to take into account that the ratio of northern hemisphere to southern hemisphere DQs is unbalanced in McCook & Sion (1999), as much as the total catalog is. This is because the southern hemisphere so far has been surveyed less extensively for white dwarfs. Assuming that the northern hemisphere sample of DQs is complete, we derive a surface density of 9 DQs brighter than in deg2, i.e. deg-2. Hence, the surface density of DQs is deg-2, and we expect DQs to be present on all 329 plates currently used for the exploitation of the stellar content of the HES. Therefore, even if we assume that the sample of DQs known so far is incomplete by a factor of 2, we statistically expect less than 1 DQ to be present in the HES C star sample.
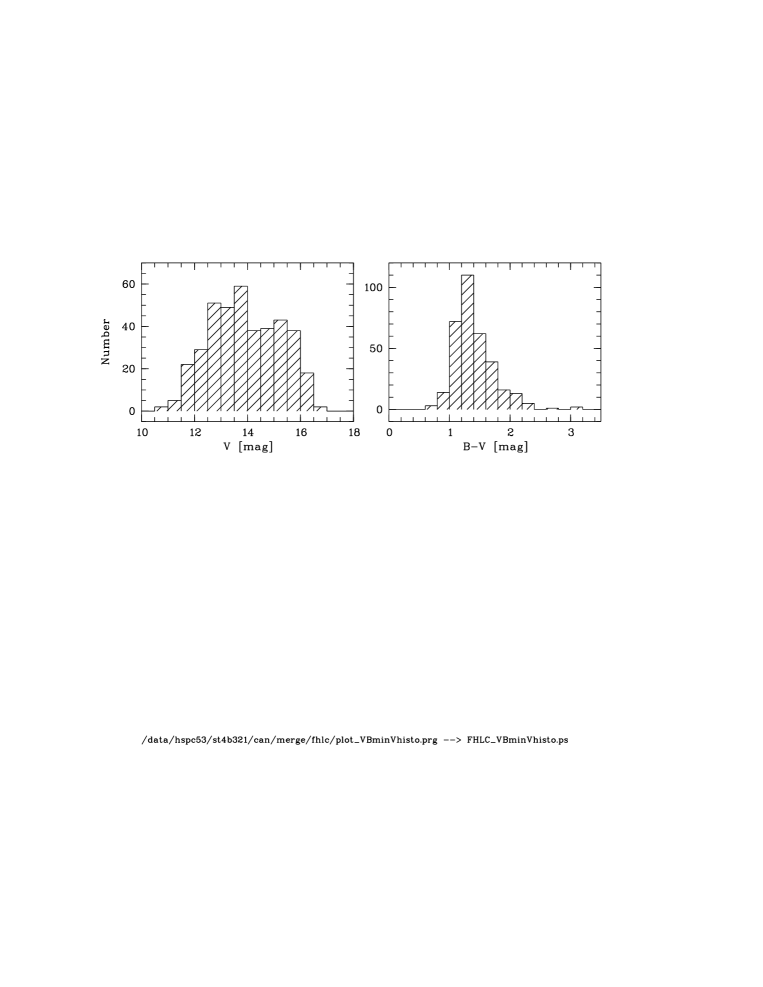
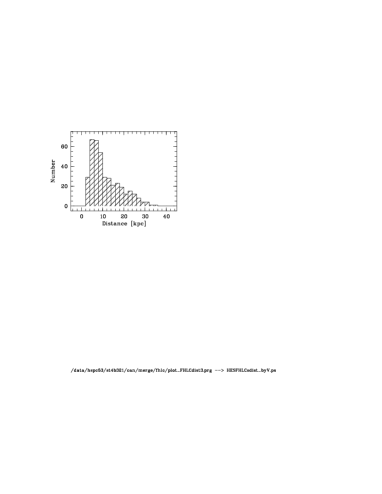
On the 329 HES plates (effective area deg2) we found 403 FHLCs. 90 of them were selected by C2 band indices only, 171 by CN band indices only, and 144 by C2 and CN indices. The and distributions are displayed in Fig. 4. The faintest objects have , and the most distant objects reach kpc (cf. Fig. 5), assuming they are all giants with mag.
3 Testing the Automated Selection
We tested the automated selection extensively and by various methods. In Sect. 3.1 we investigate the selection efficiency. In Sect. 3.2 we derive plate-by-plate selection probabilities for halo dCs on HES plates by simulations. The results of tests with “real” objects are given in Sect. 3.3.
3.1 Selection Efficiency
An important criterion for the evaluation of the quality of a selection algorithm is the selection efficiency, i.e. the fraction of desired stars in the raw candidate sample. Tab. 3 summarizes the results.
| Raw candidate | |
|---|---|
| reduction factor | 1/2900 |
| C stars | 31.6 % |
| UNID | 7.0 % |
| OVL | 29.2 % |
| ART | 8.7 % |
| NOIS | 3.8 % |
| SAT | 15.6 % |
Our selection is very efficient. The low fraction of artifacts demonstrates that the usage of pairs of C2 bands and CN bands indeed very reliably excludes artifacts from selection. However, a considerable number of overlapping spectra (overlaps) are selected. Overlaps are detected by an automatic overlap detection algorithm in the HES, using the direct plate data of the DSS I. It appears that our carbon star selection technique is very sensitive in finding the small number of overlaps not detected by the automatic algorithm.
3.2 Decrease of Selection Probability for Halo dCs
In the HES, some care must be taken when objects with large proper motion are selected. This is because the input catalog for extraction of objective prism spectra is generated by using the DSS I. The dispersion direction of the HES spectra is along declination. Therefore, large proper motions and/or large epoch differences between HES and DSS I plates (13.5 years on average) may result in an offset of the wavelength calibration zero point, leading to smaller C band values, and/or non-detection of objects in the HES, if , i.e., 3 pixels. Offsets of can be recovered by the spectrum extraction algorithm. Note however that proper motions of a typical halo object ( km/s; km/s) result in larger offsets along declination than in R.A., since the galactic plane is tilted by with respect to the equatorial coordinate system.
In order to estimate how many dCs are expected to be missed in our survey due to the epoch difference problem, we carried out a simulation study in which the plate-by-plate selection function for halo dCs was determined. The simulation is similar to that described in Green et al. (1992). We employ a sample of simulated dCs with halo kinematics, as given by Norris (1986). For the solar neighborhood, he gives
| (1) |
and he determined the velocity ellipsoid to be
| (2) | |||||
| (3) | |||||
| (4) |
In each simulation we constructed 100 random velocity vectors , with components following Gaussian distributions according to the above parameters. These velocity vectors were each applied to stars located at the center of the plate under investigation, and converted to proper motions assuming distances . These were computed from the apparent magnitude distribution of a sample of 86 C stars without significant p.m. (see Fig. 4), and assuming for dwarf carbon stars. This yields simulated stars. We compute the position of the star after the time , the epoch difference between DSS I and HES plate, and derive proper motions , from the position differences. We then select the subsample of the 8 600 stars with .
As a test sample for an investigation of the dependence of the selection probability on , we used a sample of 78 C stars from 44 HES plates without significant p.m., as measured in an follow-up campaign carried out in April at ESO, using the Wide Field Imager attached to the MPG/ESO 2.2 m telescope (Christlieb et al. 2001, in preparation). The stars were shifted in 1 pixel () steps through the range , corresponding to . At each shift step, the selection algorithms were applied.
By applying the selection probability (a function of ) to the subsample of the 8 600 stars with , we determine the fraction of stars which would be detected in the HES and selected by our selection algorithm. On the 329 stellar HES plates, % of the simulated halo dCs are detected and selected.
Green et al. (1992) found that 13 % of their C stars are dwarfs. Applying this estimate to our sample, and taking into account that we find only % of the dCs detectable on the HES plates, we estimate that 10–15 out of our 403 FHLCs are dCs. However, since our sample is biased to low-p.m., it is likely that not all of these can be proven to be dCs by their large transverse velocity. Based on our simulations we estimate that additional dCs would be detectable on the HES plates, but are currently missed due to the epoch difference problem. This incompleteness will be addressed in a later paper focusing on dC stars in the HES.
3.3 Tests with Known C Stars
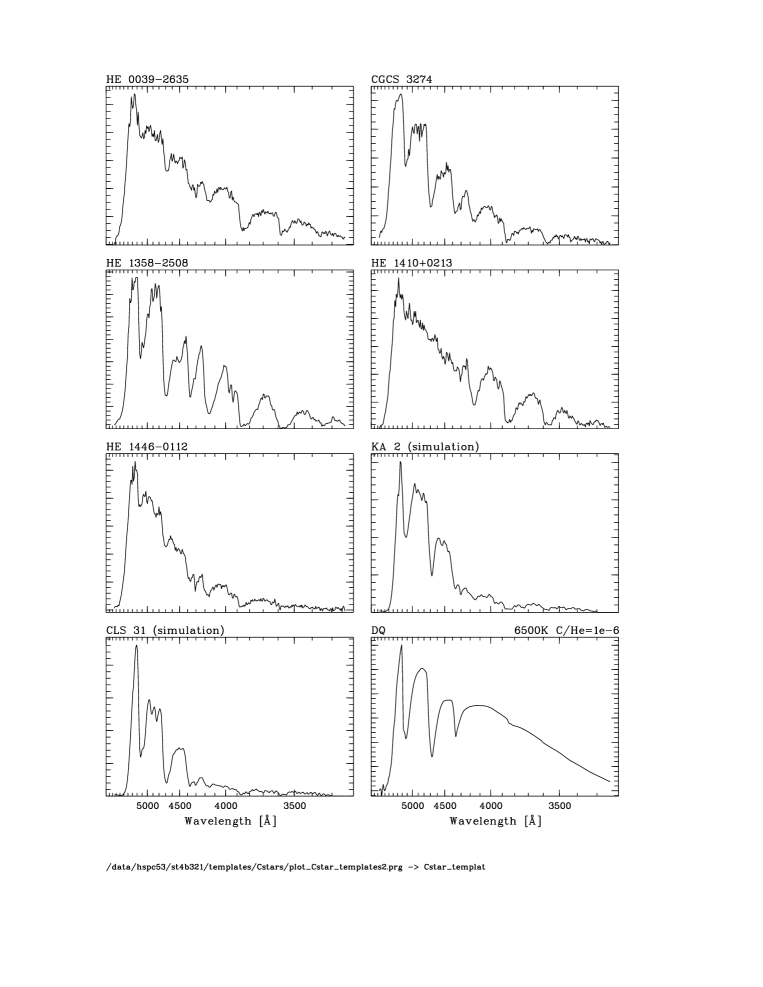
We also compiled a test sample of known dwarf and giant C stars present on HES plates (see Tab. 4). We took all three dCs in the southern hemisphere listed by Deutsch (1994), i.e. LHS 1075, G77–61, and KA 2. The (possible) dCs of Warren et al. (1993), having , unfortunately are by far too faint to be detectable on HES plates. Cross-identification with the C star lists of Slettebak et al. (1969), Stephenson (1989), Bothun et al. (1991), and Totten & Irwin (1998), yielded 21 stars. Another 6 spectra were produced from slit spectra with the procedures described in Paper I.
| Selected by | |||||||||
|---|---|---|---|---|---|---|---|---|---|
| Name | HE Name | C2 | CN | All | Source | ||||
| CGCS 39 | HE 00170055 | (sat.) | 1 | 1 | 1 | S89 | |||
| SKB 2 | HE 00392635 | 13.1 | 1.1 | 1 | 1 | 1 | SKB69 | ||
| BEM91 23 | HE 01001619 | 15.9 | 1.5 | 1 | 0 | 1 | BEM91 | ||
| CGCS 177 | HE 01062837 | 13.8 | 2.1 | 1 | 0 | 1 | S89 | ||
| SKB 5 | HE 01111346 | 13.3 | 1.4 | 1 | 1 | 1 | SKB69 | ||
| 02070211 | HE 02070211 | 15.5 | 2.2 | 0.0 | 0.0 | 1 | 0 | 1 | TI98 |
| BEM91 08 | HE 02280256 | 16.2 | 2.0 | 1 | 0 | 1 | BEM91 | ||
| CGCS 525 | HE 03302815 | 13.8 | 1.5 | 0 | 1 | 1 | S89 | ||
| CGCS 935 | HE 05213425 | 13.0 | 1.3 | 1 | 1 | 1 | S89 | ||
| 09150327 | HE 09150327 | 14.5 | 2.3 | 0.0 | 0.0 | 1 | 0 | 1 | TI98 |
| 10191136 | HE 10191136 | 15.2 | 1.8 | 0.0 | 0.0 | 1 | 0 | 1 | TI98 |
| CGCS 2954 | HE 11040957 | (sat.) | 1 | 1 | 1 | S89 | |||
| CGCS 3180 | HE 12073156 | 12.8 | 1.2 | 0 | 1 | 1 | S89 | ||
| CGCS 3274 | HE 12380836 | (sat.) | 1 | 1 | 1 | S89 | |||
| 12541130 | HE 12541130 | 16.1 | 2.2 | 0.0 | 0.0 | 1 | 0 | 1 | TI98 |
| 13390700 | HE 13390700 | 15.0 | 1.7 | 0.0 | 0.0 | 1 | 0 | 1 | TI98 |
| 14420058 | HE 14420058 | 17.8 | 2.2 | 0.0 | 0.0 | 1 | 0 | 1 | TI98 |
| CGCS 5435 | HE 21441832 | 12.6 | 1.4 | 0 | 1 | 1 | S89 | ||
| CGCS 5549 | HE 22001652 | 12.3 | 0.9 | 1 | 1 | 1 | S89 | ||
| 22130017 | HE 22130017 | 16.4 | 2.4 | 0.0 | 0.0 | 1 | 0 | 1 | TI98 |
| 22251401 | HE 22251401 | 16.5 | 2.9 | 0.0 | 0.0 | 1 | 0 | 1 | TI98 |
| CLS 50 | 0.0 | 0.0 | 1 | 0 | – | Simul. | |||
| CLS 31 | 0.0 | 0.0 | 1 | 1 | – | Simul. | |||
| CLS 54 | 0.0 | 0.0 | 1 | 1 | – | Simul. | |||
| KA 2 | 0.0 | 0.0 | 1 | 1 | – | Simul. | |||
| B15090902 | 0.0 | 0.0 | 1 | 1 | – | Simul. | |||
| UM 515 | 0.0 | 0.0 | 1 | 0 | – | Simul. | |||
| LHS 1075 | HE 00231935 | 16.1 | 1.4 | 0 | 0 | 0 | D94 | ||
| KA 2 | HE 11161628 | 16.6 | 1.3 | 1 | 0 | 1 | D94 | ||
| G77-61 | HE 03300148 | 15.0 | 1.4 | 0 | 0 | 0 | D94 | ||
In our test, all 21 stars not known as dwarfs were selected either by their strong C2 bands, or their CN bands. The simulated spectra were also all selected. Of the three dCs, one (KA 2) was selected, and the other two (G77–61, LHS 1075) not. From these results we conclude that our sample of giant C stars and dwarfs with low p.m. (e.g. dCs belonging to the disk population) is highly complete. From the small number of dCs in our test sample we are not able to draw any definitive conclusions, but our results suggest that only a minor fraction of the halo dCs are detected in the HES. This is consistent with % of the simulated halo dCs being found (see Sect. 3.2).
4 The Surface Density of C Stars
In an effective area of (329 of 380 the HES plates; for a description how the effective area is estimated see Wisotzki et al. 2000), we have isolated a total of 403 C stars. A straightforward estimate of the surface density of FHLC stars we detect with the HES is hence obtained from the ratio of these two numbers, yielding deg-2. However, one has to take into account that the effective area accessible on average for each object depends on its brightness, since the HES limiting magnitude varies from plate to plate. For example, the effective area for an object as faint as is only % of the overall survey area, mainly because only 254 of the contributing plates reach this magnitude (see Fig. 2 in Wisotzki et al. 2000). An additional brightness dependence is caused by the fact that faint objects are more easily affected by overlapping spectra than bright objects. We therefore determine the FHLC surface density as follows:
| (5) |
where was determined as described in Wisotzki et al. (2000). We obtain a FHLC surface density of deg-2 on the 329 HES plates we used.
5 Discussion and Conclusions
In an effective area of we have isolated a total of 403 C stars. Our efforts have thus already increased the number of known FHLC stars by a factor of nearly five.
We find almost quadruple the surface density of carbon stars compared to the surveys summarized by Green et al. (1994). Since those previous surveys claimed limiting magnitudes about mag fainter than the HES, this highlights the greatly enhanced selection sensitivity of FHLC stars in the HES, which is more sensitive to a variety of C2 or CN molecular absorption band strengths. Automated selection techniques may be superior to visible inspection of objective-prism spectra with binocular microscopes, as done e.g. in the survey of Sanduleak & Pesch (1988). Photometric surveys for C stars have generally selected red objects only, which preferentially selects mostly the much less common high latitude AGB stars. Margon et al. (2000) report a FHLC star surface density of “at least” deg-2 in the SDSS. This is still almost a factor of 2 below our value, and again, the SDSS is much deeper than the HES ().
Due to an average epoch difference of years between DSS I and HES plates, we expect to detect and select only % of the halo dCs that we could detect and select if direct plates had been taken simultaneously with the HES plates. Our simulations indicate that 10–15 out of the 403 FHLCs published in this paper are dCs. Note, however, that this number is uncertain, because the kinematics of halo dCs is not precisely known. We estimate that additional dCs are detectable on the HES plates, but are currently missed due to the epoch difference problem. We are extending the current sample to include proper-motion corrected input catalogs for the extraction of HES spectra, to find all dCs, and other objects that can have large proper motions, like halo white dwarfs.
Acknowledgements.
We thank D. Koester for providing model spectra of DQs, and C. Fechner for technical support in preparing this article. This work was partly supported by Deutsche Forschungsgemeinschaft under grant Re 353/40. P.J.G. acknowledges support through NASA Contract NAS8-39073 (ASC).References
- Bothun et al. (1991) Bothun, G., Elias, J. H., MacAlpine, G., et al. 1991, AJ, 101, 2220
- Brewer et al. (1996) Brewer, J. P., Richer, H. B., & Crabtree, D. R. 1996, AJ, 112, 491
- Christlieb et al. (2001) Christlieb, N., Wisotzki, L., Reimers, D., et al. 2001, A&A, 366, 898 (Paper I)
- Dahn et al. (1977) Dahn, C. C., Liebert, J., Kron, R. G., et al. 1977, ApJ, 216, 757
- Deutsch (1994) Deutsch, E. W. 1994, PASP, 106, 1134
- Eggen et al. (1962) Eggen, O. J., Lynden-Bell, D., & Sandage, A. R. 1962, ApJ, 136, 748
- Green et al. (1992) Green, P. J., Margon, B., & Anderson, S. F. 1992, ApJ, 400, 659
- Green et al. (1994) Green, P. J., Margon, B., Anderson, S. F., et al. 1994, ApJ, 434, 319
- Green et al. (1991) Green, P. J., Margon, B., & MacConnell, D. J. 1991, ApJ, 380, L31
- Heber et al. (1993) Heber, U., Bade, N., Jordan, S., et al. 1993, A&A, 267, L31
- Ibata et al. (1994) Ibata, R. A., Gilmore, G., & Irwin, M. J. 1994, Nature, 370, 194
- Johnston et al. (1999) Johnston, K. V., Zhao, H., Spergel, D. N., et al. 1999, ApJ, 512, L109
- Liebert et al. (1994) Liebert, J., Schmidt, G. D., Lesser, M., et al. 1994, ApJ, 421, 733
- MacAlpine & Williams (1981) MacAlpine, G. M. & Williams, G. A. 1981, ApJS, 45, 113
- MacAlpine & Lewis (1978) MacAlpine, G. M. & Lewis, D. W. 1978, ApJS, 36, 587
- Majewski et al. (2000) Majewski, S. R., Ostheimer, J. C., Kunkel, W. E., et al. 2000, AJ, 120, 2550
- Margon et al. (2000) Margon, B., Anderson, S. F., Williams, B. F., et al. 2000, in AAS Meeting, Vol. 197, 1309
- McCook & Sion (1999) McCook, G. P. & Sion, E. M. 1999, ApJS, 121, 1
- Norris (1986) Norris, J. 1986, ApJS, 61, 667
- Norris et al. (1997) Norris, J. E., Ryan, S. G., & Beers, T. C. 1997, ApJ, 488, 350
- Reimers & Wisotzki (1997) Reimers, D. & Wisotzki, L. 1997, The Messenger, 88, 14
- Rossi et al. (1999) Rossi, S., Beers, T. C., & Sneden, C. 1999, in ASP Conf. Ser., Vol. 165, The Third Stromlo Symposium: The Galactic Halo, ed. B. Gibson, T. Axelrod, & M. Putman, 264–268
- Sanduleak & Pesch (1988) Sanduleak, N. & Pesch, P. 1988, ApJS, 66, 387
- Searle & Zinn (1978) Searle, L. & Zinn, R. 1978, ApJ, 225, 357
- Slettebak et al. (1969) Slettebak, A., Keenan, P. C., & Brundage, R. K. 1969, AJ, 74, 373
- Stephenson (1989) Stephenson, C. B. 1989, Publ. W.&S. Obs, 3
- Totten & Irwin (1998) Totten, E. J. & Irwin, M. J. 1998, MNRAS, 294, 1
- Totten et al. (2000) Totten, E. J., Irwin, M. J., & Whitelock, P. A. 2000, MNRAS, 314, 630
- Warren et al. (1993) Warren, S. J., Irwin, M. J., Evans, D. W., et al. 1993, MNRAS, 261, 185
- Wisotzki et al. (2000) Wisotzki, L., Christlieb, N., Bade, N., et al. 2000, A&A, 358, 77
- Wisotzki et al. (1996) Wisotzki, L., Köhler, T., Groote, D., et al. 1996, A&AS, 115, 227
Appendix A HES example spectra of C stars
Appendix B The HES FHLC sample
In Tab. B.1 we list the sample of 403 HES FHLC stars described in this paper. The table is made available only electronically. It contains the following columns:
| hename | HE designation |
|---|---|
| ra2000 | R.A. at equinox 2000.0, derived from DSS I |
| dec2000 | Declination at equinox 2000.0, derived from DSS I |
| field | ESO-SERC field number |
| plate | HES plate number |
| q | Plate quarter |
| objtyp | Object type (stars/bright/ext) |
| B_J | magnitude |
| magnitude | |
| magnitude, derived from HES spectra | |
| magnitude, derived from HES spectra | |
| C2idx1 | Band index of C2 5165 Å |
| C2idx2 | Band index of C2 4737 Å |
| CNidx1 | Band index of CN 4216 Å |
| CNidx3 | Band index of CN 3883 Å |
| selC2 | C2 band index selection flag |
| selCN | CN band index selection flag |
magnitudes are accurate to better than mag, including zero point errors (Wisotzki et al. 2000). magnitudes were derived by the procedures described in Paper I. The object types “stars”, “bright” and “ext” refer to point sources, sources above a saturation threshold, and sources detected as extended in DSS I images, respectively. We do not list , and for saturated objects, because our color calibrations are not valid for them.