Broad emission lines from opaque electron-scattering environment of SN 1998S
Abstract
I propose that broad narrow-topped emission lines with full width at zero intensity km s-1 revealed by early-time spectra of SN 1998S originate from a dense circumstellar (CS) shell with the outer radius cm. The tremendous line width is the result of multiple scattering of photons of the narrow line by thermal electrons of the opaque CS gas. The H line on 1998 March 6 is reproduced by Monte Carlo simulations provided the Thomson optical depth of the CS shell is 3–4 at this epoch. The high density of CS shell implies that a cool dense shell (CDS), which forms at the ejecta-wind interface, is opaque in the Paschen continuum for about 40–50 days after the explosion. This explains, why strong lines from the supernova ejecta were not seen during an initial period of about 40 days after the discovery. The Thomson optical depth recovered from the electron-scattering wings is consistent with observational constraints imposed by the bolometric luminosity, photospheric radius and expansion velocity of the CDS.
keywords:
supernovae – circumstellar matter – : stars.1 Introduction
Supernova SN 1998S discovered on March 2.68 UT (Li & Wan 1998) belongs to a diverse family of SN IIn, which are generally believed to interact with a dense presupernova wind (Filippenko 1991, 1997; Chugai 1990). Of particular interest are the earliest spectra of SN 1998S, taken before 1998 March 12, with strong Balmer emission lines and Wolf-Rayet (WR) features, N III 4640 Å, He II 4686 Å on a smooth black-body continuum (Leonard et al. 2000; Liu et al. 2000; Fassia et al. 2001). The lines have similar profiles, composed of an unresolved line with full width at half maximum (FWHM) km s-1 and a broad line with full width near zero intensity km s-1 (Leonard et al. 2000). The narrow component is identified with the CS gas, while the broad line is attributed to the SN ejecta (Leonard et al. 2000), in accord with a picture generic to SN IIn.
I will present quite different view on the origin of the broad component. It will be explained as a result of broadening of the narrow line due to multiple scattering by thermal electrons in the opaque CS gas. I will show that this conjecture is consistent with observational constraints imposed by the bolometric light curve, photospheric radius and velocity of the ejecta-wind interface. I first outline the phenomenological picture, which will hint, why the CS gas and not SN ejecta is an appropriate site for the early-time broad emission (section 2), then calculate simple models of the ejecta deceleration and bolometric light curve (section 3). In section 4 the line profile will be simulated using Monte Carlo technique.
Henceforth the distance 17 Mpc, the extinction (Fassia et al. 2000), and the redshift 850 km s-1 (Fassia et al. 2001) are assumed.
2 The phenomenological model
Bellow we outline the qualitative physical picture of the spectrum formation in the early-time SN 1998S using arguments based upon the available observational data and results obtained in other papers.
2.1 Why CS Thomson scattering?
SN 1998S exploded after 1998 February 23.7 (Leonard et al. 2000), which suggests that on March 6 SN was less then ten days old. At this age SN ejecta is essentially opaque, and the emission lines from SN ejecta must be affected by the occultation, i.e. they must show strong line asymmetry with the suppressed red part. The early emission lines, on the contrary, are symmetric (Leonard et al. 2000), and their origin from SN 1998S ejecta is, therefore, unlikely.
The alternative explanation for the broad lines, we propose, is that they are the result of narrow line broadening due to electron scattering in an opaque CS shell outside the SN photosphere. The following simple arguments give an order of magnitude estimate of the required Thomson optical depth of the CS shell to produce the broadening effect. Let the H emissivity and scattering electrons are homogeneously distributed in a spherical layer with the Thomson optical depth . The expected ratio of the unscattered, i.e. narrow component, to the total emergent line flux is then . On the other hand, assuming that the CS shell velocity is about km s-1, which is hinted by the UV lines in HST spectra on March 16 (Lentz et al. 2001), we obtain that the narrow component (or unscattered emission) of H in the spectrum on March 6 (Fassia et al. 2001) comprises roughly of the overall line emission, which suggests . With this value the above expression for implies the optical depth of the CS gas . More precise value of will be obtained in Section 4.
2.2 The distribution of the CS matter
The abrupt disapearence of the early-time emission lines after March 12 means that a dense CS shell, responsible for these lines, was overtaken by the SN ejecta to this moment. This argument was used by Fassia et al. (2001) to estimate the outer radius of the CS shell, cm. Note, the radius of the photosphere on March 6 estimated by the extrapolation of empirical data provided by Fassia et al. (2000) is cm .
Apart from this inner CS shell, there is also the CS matter in the outer region , which is revealed by narrow absorption and emission lines in spectra seen after March 12 and by the emergence at d of the ’boxy’ components of H and He I 10830 Å caused by the interaction (Fassia et al. 2001). The modeling of UV lines in the HST spectrum on March 16 (Lentz et al. 2001) indicates that the Thomson optical depth of the CS gas in the region cm is only . Therefore, parctically all the optical depth should be accumulated in the range of with a linear density g cm-1, where we assume , and cm2 g-1. The estimated value of is tremendous, but yet is in line with the similar records in other SN IIn (Chugai 1992). As to the outer CS gas, the value in the range suggests that g cm-1, which is consistent with the wind density required by the late-time ( yr) radio and X-ray emission (Pooley et al. 2001).
The above analysis implies that the CS environment has a ’dense core plus rarefied halo’ morphology. This structure will by described here as a superposition of two components (), each described by the expression
| (1) |
For the template model of the CS gas distribution (Fig. 1), which meets above requirements and will be used bellow for the light curve and line profile models, we adopt , , cm, , , and cm with the linear density in the steady-state wind zones g cm-1 and g cm-1. In addition, we plot the Thomson optical depth (Fig. 1) assuming full ionisation of the CS gas and the hydrogen abundance . The latter is estimated from the fact that the flux ratio of He II 4686 Å to H in the spectrum on 1998 March 6 is about unity (Fassia et al. 2001) and assuming recombination case B. (The low hydrogen abundance may reflect mixing and mass loss). Note, at cm the model yields the Thomson optical depth (Fig. 1), which is in a qualitative agreement with derived by Lentz et al. (2001).

2.3 The opaque cool dense shell
The interaction of the freely expanding SN ejecta with the CS environment produces a double shock structure with the outer (direct) shock, running in the wind and the inner (or reverse) shock propagating inward the SN ejecta (Nadyozhin 1981, 1985; Chevalier 1982). If the CS wind is dense enough ( g cm-1), a cool dense shell (CDS) forms at the ejecta-wind interface due to the cooling and compression of the shocked ejecta in the inner shock (Chevalier & Fransson 1985, 1994). In case of a very dense wind ( g cm-1) the outer shock during the initial epoch of about one month may be radiative as well and contribute to the CDS formation. The evidence for the CDS in SN 1998S is hinted by the ’boxy’ H emission at the late epoch (Leonard et al. 2000; Gerardy 2000; Fassia et al. 2001). The blue slope of the H boxy component, when approximated by the emission from a spherical shell, suggests the average CDS velocity km s-1 and km s-1 according to spectra on day 92 (Fassia et al. 2001) and on day 140 (Leonard et al. 2000) respectively.
Remarkably, the CDS turns out opaque in the Paschen continuum for about 40–50 days. This claim is supported by the following arguments. The mass of the CS shell in the range of cm for the template wind model is . After the CS shell is swept up by the SN ejecta with the density in outer layers one expects that the mass of the CDS should be times larger (Chevalier 1982) or depending on , which lies in the range 8–20 (Chevalier & Fransson 1994). We assume that the excitation temperature is equal to the effective temeperature and approximate the bolometric luminosity evolution by the power law , where erg s-1 and d, which is compatible with the observed luminosity during the period of 15–80 d after the discovery (Fassia et al. 2000). With these remarks, the condition at H or at the Paschen edge results in the following expression for the time of the CDS transparency in the H band
| (2) |
where is the CDS average expansion velocity, and the numerical prefactor in Eq. (2) is obtained for , , H ionisation degree , d, and km s-1, which implies . According to Eq. (2) the value of weakly depends on parameters, which gives us a confidence that the CDS is actually opaque during initial 40–50 days.
Two important consequences follow from the fact that SN ejecta is enshrouded in the opaque CDS. First, the SN photosphere should reside in CDS at the epoch , which matters to the observational test of the deceleration dynamics (section 3). Notably, the optically thick electron-scattering CS gas does not affect the photospheric continuum, because CS shell is effectively thin, i.e. the scattering is conservative. Actually, for the typical density of the CS shell cm-3 and temperature K the ratio of the absorption to the extinction coefficient is , so the thermalization length .
The second point, but of a primary significance, is that the opaque CDS prevents the emergence of strong emission lines from the SN ejecta. Moreover, strong emission lines are not expected from the opaque CDS either. To clarify the latter point, note that the pressure equilibrium and the mass conservation result in a small width of the CDS (Chevalier & Fransson 1994), , which leads to the small width of the SN atmosphere residing in the CDS, . Since the early-time continuum is nearly black-body, , and the line source function in the CDS is limited by the inequality , we conclude immediately that the expected contrast of emission lines formed in the opaque CDS is very small, . It becomes thus clear, why strong emission and absorption lines of SN 1998S ejecta were not seen during the period 10–40 days after the discovery, the observational fact emphasised by Fassia et al. (2001). On the other hand, the opaque CDS does not preclude the emergence of the strong emission lines from the extended CS shell.
To summarize, the qualitative model for the early-time spectrum of SN 1998S may be portrayed as a sharp black-body photosphere embedded into the opaque electron-scattering CS shell, which is responsible for the emission lines observed before March 12.
| Model | |||||||||||
|---|---|---|---|---|---|---|---|---|---|---|---|
| M⊙ | erg | cm | g cm-1 | days | cm | K | |||||
| A | 5 | 1.1 | 2.4 | 8 | 21 | 2 | 47 | 19 | 5.0 | 21700 | 3.4 |
| B | 5 | 1.1 | 2.4 | 10 | 18 | 2 | 47 | 22 | 5.0 | 21500 | 3.8 |

3 The interaction and light curve model
Given the similarity of SN 1998S and SN 1979C photometric and spectral properties (Liu et al. 2000), the light curve of SN 1998S is likely of the same nature as that of SN 1979C. In line with the hydrodynamical model of the SN 1979C (Blinnikov & Bartunov 1993) we suggest that the light curve of SN 1998S is the result of an explosion of a red supergiant with an extended envelope, , and a moderate mass of ejecta . The radioactivity as well as the ejecta-wind interaction are likely responsible for the late-time SN 1998S luminosity. One cannot rule out that the ejecta-wind interaction may contribute to the initial phase of the light curve as well.
The bolometric light curve will be simulated using a linear composition of the analytical bolometric light curve of ’bare’ (i.e. without wind) SN II (Arnett 1980, 1982) and the light curve powered by the ejecta-wind interaction (Chugai 1992). The latter model computes the optical luminosity, produced as a result of reprocessing of the X-ray radiation from the outer and inner shocks. This model is upgraded here to include the Compton cooling of the postshock gas (Fransson 1982) and the reprocessing of the X-ray radiation by the wind material as well. The dynamics of the ejecta deceleration in a thin shell approximation (Chevalier 1982) is solved numerically, which yields the thin shell radius and its velocity . The light curve computed in an approximation of the instant radiation escape from the CS shell, is corrected for the diffusion delay in the CS medium using Sobolev (1980) analytical formula for the escaping luminosity.
The density profile of a freely expanding SN envelope () used for the calculations of the thin shell dynamics is a plateau with an outer power law tale
| (3) |
where and are defined by the SN mass () and kinetic energy (); is an arbitrary refference moment. We adopt a steep density gradient, , to take into account the effect of sweeping up the material of the extended envelope into a dense shell during shock wave breakout phase (Grasberg et al. 1971; Falk & Arnett 1977). The template CS density distribution (Fig. 1) is used. The 56Ni with the mass of (Fassia et al. 2000) is assumed to be mixed within inner half of the SN mass. The average SN ejecta opacity cm2 g-1 is adopted for the Arnett’s model.
The list of the essential parameters of the light curve model includes the ejecta mass , kinetic energy , presupernova radius , the wind parameters and assuming the fixed shape of the density distribution of the SN ejecta and the CS gas. Exploring the parameter space led us to the optimal choice of the SN parameters: , erg and cm. It should be stressed, that these values may be in some error given a simplicity of our model. The density in the inner CS shell () affects the very early phase d of the light curve, although, we are not able to derive reliably from the light curve analysis, since the Arnett’s analytical model underestimates the early luminosity (Arnett 1980). The light curve is insensitive to the outer wind density unless substantially exceeds g cm-1.
In Fig. 2 two models of the light curve are shown for input parameters given in Table 1 and assuming that the explosion occured on 1998 February 24.7 UT, the day after the last pre-discovery observation. This choice is consistent with the evolution of the photospheric radius (Fig. 2). The template CS density distribution (Fig. 1) is used for the model A, while the model B differs by the slightly higher cutoff radius . The parameter is found from the modeling of the light curve, photospheric radius, CDS velocity and the line broadening effect (section 3) using an itterative procedure. Derived values shown in Table 1 include the moment , when the optical depth of the CDS in the Paschen continuum at H wavelength , the time , when the outer shock becomes adiabatic, and three important values on March 6: the radius of the thin shell (), which coincides with the CDS, effective temperature (), and Thomson optical depth () of the wind. The optical depth of the CDS in the Paschen continuum is calculated assuming LTE for and the number density of the CDS defined by the isobaric condition, i.e. with the thermal pressure equal to the dynamical pressure , where is the preshock wind density and is the thin shell velocity. Models A and B produce similar results being consistent with the empirical light curve, photospheric radii and CDS velocity. Some luminosity deficit before day 30 might be related to the mentioned fact that in the analytical light curve the initial luminosity peak is undeproduced (Arnett 1980). Yet, given large uncertainties of data, the difference between the model and the empirical light curve is not dramatic. Note, the factor of two increase in the luminosity corresponds to 20% higher value of .
The CDS is opaque during initial days in agreement with the previous estimates (section 2). Taking into account the six days lag between the explosion and the discovery we conclude that the opaque CDS gets transparent at d after the discovery. This is consistent with the observational fact that strong broad emission and absorption lines from SN ejecta appear only about day 40 after the discovery (Fassia et al. 2001). Remarkably, the outer shock is radiatiave in both models for days. As a result on March 6 with days passed after the explosion the outer postshock gas should cool very quickly resulting in a very thin outer postshock region, i.e. .
4 Line profile calculations
We consider only the H line, although a similar approach may be applied to any other line, including WR lines, observed in early-time spectra of SN 1998S. The model suggests a sharp photosphere with a radius in a fully ionised isothermal CS gas () with an electron temperature (Table 1). Any effects related to the outer shock are omitted; they are of a minor importance for the line profile. The wind velocity law is taken to mimic a radiative acceleration of the wind by the SN radiation. We adopt km s-1 for the distant wind (Fassia et al. 2001) and km s-1 at the photosphere, a rough guess based upon the extrapolated behavior of the maximal velocities of the fast CS gas on March 20 and April 8 (Fassia et al. 2001). The result, actually, is not very much sensitive to unless it significantly exceeds 1000 km s-1. The wind emissivity in H is assumed to scale as a recombination emissivity (erg s-1 cm-3 ster-1), where is the effective recombination coefficient for the H emission (case B), while is an emission correction factor, which allows for uncertainties in the distance, exctinction, electron temperature, hydrogen abundance, as well as for a wind clumpiness and a possible deviation from the recombination case B. The scattering in the wind is essentially conservative, but the photons struck the photosphere will be considered lost. The resonance scattering is neglected. This approximation is justified by our simulations, which do not show a dependence on the resonance scattering at the considered epoch.
The emergent line spectrum is computed using the Monte Carlo technique. The photon frequency at each scattering is randomly chosen adopting the symmetric angle-averaged frequency redistribution function (cf. Mihalas 1978). Note, computations with both angle-averaged and angle-dependent frequency redisribution functions are mutually consistent with a high precision even in the case of as Hillier (1991) has shown in his study of electron-scattering effects in WR stars. The relativistic correction to the Doppler effect and Compton recoil produce a net blue shift (Weymann 1970), where is the average number of scatterings. This effect, although small, is included in the profile modeling.
| Model | |||
|---|---|---|---|
| K | g cm-1 | ||
| D1 | 25000 | 13 | 4.0 |
| D2 | 25000 | 1.3 | 0.4 |
| D3 | 25000 | 16.2 | 5.0 |
| D4 | 30000 | 13 | 4.0 |
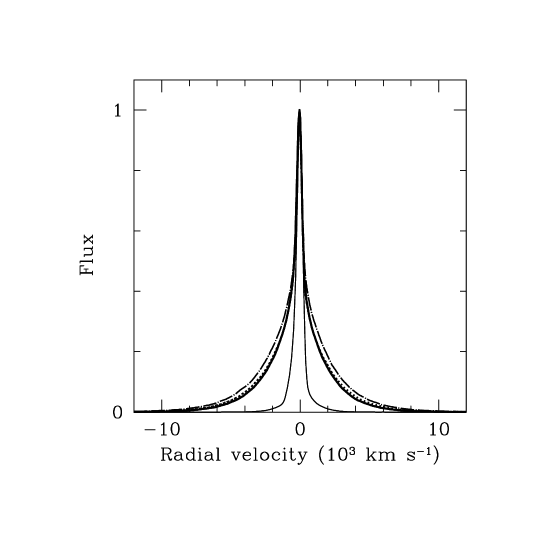
The H line broadening effect in the case of the high Thomson optical depth is illustrated in Fig. 3 with model parameters given in Table 2, which presents the electron temperature, the linear wind density , and the Thomson optical depth. In all the cases the photospheric radius is cm, the wind velocity is km s-1 and the CS density distribution is defined by Eq. (1) with , cm, , . All the profiles are normalized to unity at maximum. A gaussian smoothing with FWHM=6.7 Å is applied henceforth to the computed profile to allow for the finite resolution in the spectrum on 1998 March 6 (Fassia et al. 2001).
Results show that the template model D1 with the Thomson optical depth produces strong nearly symmetric electron-scattering wings. It should be emphasised that the line profile from the expanding electron scattering wind with the opaque core is the result of the combination of several factors including, (i) single scattering broadening related to the outmost layers with ; (ii) broadening due to multiple scattering, which may be interpreted as a diffusion in the frequency space; (iii) the redshift acquired in the course of multiple scattering in the expanding medium; (iv) the photon absorbtion by the opaque photosphere. It should be emphasised that the resulting redshift essentially depends on the wind expansion kinematics. The model D2 with ten times lower optical depth compared to the model D1 clearly shows the blue shift due to the occultation of the wind by the photosphere and the enhanced red wing due to the expansion effect. A primary reason, why the expansion effect is not so apparent in the model D1 relates to the adopted wind kinematics with the velocity dropping outward. In the optically thick situation the contribution of the outer slow expanding gas dominates, which thus account for the small expansion effect in the model D1. Obviously, this effect does not operate in the transparent case D2, where fast inner scattering wind essentially contributes in the line profile. Note, the mentioned bias to the red wing in the model D2 very much resembles the appearence of electron-scattering wings in WR stars (Auer & van Blerkom 1972; Hillier 1991). The model D3 with has markedly stronger wings compared to the model D1 in a wide range of velocities. The 20% higher electron temperature (model D4) slightly increases high velocity wings. Such an effect is practically on the verge of detectability. In this regard we note, that the uncertainty of in the light curve model is of , which is thus insignificant for the line modeling.
The spectrum of H on 1998 March 6 (Fassia et al. 2001) with two ’best’ fit versions of the line profile based upon models A and B are ahown in Fig. 4. To make the plot the emission lines are placed upon the appropriate continuum. As noted before (section 3), parameters of models A and B are found using itterative procedure to fit simultaneously the light curve, photospheric radius, expansion velocity and the line profile. Both models reproduce the observed profile with the emission correction factor being close to unity (1.36 and 1.13 for model A and B respectively). Surprisingly enough that the model A, which only slightly differs from the model B, shows a noticeable blue shift. This is related to the smaller ratio , i.e. higher compactness of the CS shell. Note, the higher blue shift would be inconsistent with the observed profile, which implies that cm. On the other hand with the Thomson optical depth of CS gas at the radii cm as low as (Lentz et al. 2001) the outer boundary of the CS shell cannot significantly exceed cm. Therefore we conclude that cm is an optimal estimate for the cutoff radius of the inner CS shell.
With the single studied epoch we cannot rule out that the density distribution at may deviate from the law . For instance, the profile may be fitted assuming and cm with similar value of the optical depth, . Other uncertainties of the model include the clumpiness, and asymmetry of CS gas. The clumpiness would result in the decrease of the Thomson optical depth compared to the smooth distribution. The global asymmetry of the CS environment (if any) would suggest that our results must be refered to some equivalent spherical model. At any case, uncertainties are not able to change the major result, that the broad line wings on March 6 require the Thomson optical depth of the CS shell in the range of 3–4.

5 Discussion
I have argued that the broad narrow-topped emission lines in the early-time spectra of SN 1998S are the result of the emission and Thomson scattering of line photons in the opaque CS shell with the outer radius of cm. It was demonstrated that the CS density distribution appropriate to the line broadening is consistent also with the constraints imposed by the light curve, photospheric radius and velocity of the CDS. It was shown that the CDS is opaque in the Paschen continuum during about 40–50 days after the SN explosion. The absence of strong emission and absorption lines from SN ejecta during 40 days after the SN discovery (Fassia et al. 2001) is explained as a direct consequence of the opaque CDS. Both the electron-scattering CS environment and the opaque CDS, thus, may produce pronounced observational effects in SN IIn.
Despite an obvious success in explaining the spectral evolution of SN 1998S, the concept of the opaque CDS faces a problem in accounting for the weak broad absorptions of H, HeI and Si II, which are noticeable in SN 1998S spectra before day 40 (Fassia et al. 2001). A plausible explanation for these lines might be that the CDS is not a perfect sphere, but is instead ’punched’ i.e. has ’holes’. In such a case the absorbing gas may be identified with the unshocked gas of SN ejecta seen through the holes in the opaque CDS. A punched structure of the CDS might be caused by the Rayleigh-Taylor instability or by a global wind asymmetry. The latter is implied by the detection of the intrinsic polarization of SN 1998S on 1998 March 7 (Leonard et al. 2000). For instance, the asymmetric opaque CDS might have an appearence of a wide equatorial belt with two transparent poles, one of them lying in the near hemisphere.
In regard to the umbiguous interpretation of the spectropolarimetric data (Leonard et al. 2000) the following property of our model may be relevant. Specifically, the model predicts that the narrow component in the early-time spectrum must consist mostly of the non-scattered radiation, while the broad wings are the result of multiple scattering. With this property more consistent is the interpretation II (polarized broad lines and unpolarized narrow lines) suggested by Leonard et al. (2000).
The origin of the inner CS shell with the outer radius of cm is intriguing. If it was created by the slow red supergiant wind with the velocity km s-1, then the age of this CS shell was 30 yr at the explosion, which cannot be readily associated with any specific time scale of the presupernova. On the other hand, the velocity of the matter ejection might be as high as 100 km s-1, which is still tollerated by the spectral resolution of the narrow component (Fassia et al. 2001). In that case the age of the CS shell was only 3 yr, which reminds the time scale 1–10 yrs for the Ne and O burning in cores of stars (Heger 1998). Woosley (1986) noted that the Ne burning in degenerate cores of stars may result in the violent mass loss roughly 1 yr prior to core collapse. Remarkably, the dense shell of a similar size ( cm) has been invoked to account for the early-time line behavior in SN 1983K (Niemela et al. 1985), which is another SN II with WR features, and in type IIn SN 1994W (Sollerman et al. 1998).
It would be interesting to search for signatures of broadening of CS lines due to scattering by thermal electrons in other SN IIn spectra. To distinguish between the case of narrow lines on top of the broad lines emitted by SN ejecta, likewise in e.g. SN 1988Z (Filippenko 1991; Stathakis & Sadler 1991) and the case of narrow lines with CS electron-scattering wings, the following properties of the early-time spectra of SN 1998S must be stressed: (i) the broad wings are smooth; (ii) strong emission lines have similar profiles; (iii) the continuum is smooth and close to black-body. We deliberatelly do not emphasize the wing symmetry, since in the case of a low Thomson optical depth and a high wind velocity the red wing may become stronger due to the CS expansion effect and the resonance scattering. In this regard of particular interest are SN 1994Y, SN 1994W, and SN 1994ak, reviewed by Filippenko (1997). Their early-time spectra show narrow lines with smooth broad wings on smooth continua. These properties are very suggestive of the CS electron-scattering origin of line wings and the presence of the opaque CDS in these supernovae.
Acknowledgments
I am grateful to Peter Lundqvist, Peter Meikle and Alexandra Fassia for discussions of different issues of SN 1998S and for a creative aura during my visit to Saltsjöbaden and Imperial Colledge.
The study was supported by RFBR grant 01-02-16295.
References
- [1] Arnett W.D. 1982, in Rees M.J., Stoneham R.J. eds. Supernovae: A survey of current research. Reidel Publishing Company, Dordrecht, p. 221
- [2] Arnett W.D. 1980, ApJ, 237, 541
- [3] Auer L.H., van Blerkom D. 1972, ApJ, 178, 175
- [4] Blinnikov S.I., Bartunov O.S. 1993, A&A, 273, 106
- [5] Bowen D.V., Roth K.C., Meyer D.M., Blades J.C. 2000, ApJ, 536, 225
- [6] Branch D., Falk S.W., McCall M.L., Rybski P., Uomoto A., Wills B.J. 1981, ApJ, 244, 780
- [7] Chevalier R. 1982, Ap. J., 259, 302
- [8] Chevalier R., Fransson C. 1985, in Bartel N., ed. Supernovae as distance indicators. Springer, Berlin, p. 123
- [9] Chevalier R., Fransson C. 1994, Ap. J., 420, 268
- [10] Chugai N.N. 1990, Sov. Astron. Lett., 16, 459
- [11] Chugai N.N. 1992, Sov. Astron., 36, 63
- [12] Falk S.W., Arnett W.D. 1977, ApJSS, 33, 515
- [13] Fassia A. et al. 2000, MNRAS, 318, 1093
- [14] Fassia A. et al. 2001, MNRAS (in press)
- [15] Filippenko A.V. 1991, in Woosley S.E., ed. Supernovae. Springer Verlag, New York, p. 467
- [16] Filippenko A.V. 1997, Ann. Rev. Astron. Astrophys., 35, 309
- [17] Fransson C. 1982, A&A, 111, 140
- [18] Gerardy C.L., Fesen R.A., Höflich P., Wheeler J.C. 2000, AJ, 119, 2968
- [19] Grasberg E.K., Imshennik V.S., Nadyozhin D.K. 1971, Astrophys. Space Sci. 10, 28
- [20] Heger A. 1998, The presupernova evolution of rotating massive stars. Ph.D dissertation, MPA 1120
- [21] Hillier D.J. 1991, A&A, 247, 455
- [22] Leonard D.C., Filippenko A.V., Barth A.J., Matheson T. 2000, Astron. J., 120, 1499
- [23] Lentz E.J. et al. 2001, ApJ, 547, 406
- [24] Li W.D. , Wan Z. 1998, IAU Circ. No. 6829
- [25] Liu Q.-Z., Hu J.-Y., Hang H.-R., Qiu Y.-L., Zhu Z.-X., Qiao Q.-Y. 2000, A&A Suppl., 144, 219
- [26] Mihalas D. 1978, Stellar atmospheres. Freeman, San Francisco
- [27] Nadyozhin D.K. 1981, Preprint ITEP No. 1
- [28] Nadyozhin D.K. 1985, Astrophys. Space. Sci 112, 225
- [29] Niemela V.S., Ruiz M.T., Fillips M.M. 1985, ApJ, 289, 52
- [30] Pooley D. et al. 2001, astro-ph/0103196
- [31] Sobolev V.V. 1980, Astrophysics, 15, 274
- [32] Sollerman J., Cumming R.J., Lundqvist P. 1998, ApJ, 493, 933
- [33] Stathakis R.A., Sadler E.M. 1991, MNRAS, 250, 786
- [34] Weymann R.J. 1970, ApJ, 160, 31
- [35] Woosley S.E. 1986, in Hauck B., Maeder A., Meynet G. eds, Nucleosynthesis and chemical evolution, Geneva Observatory, Geneva, p. 1