The Rapid Burster in Liller 1: the Chandra X-ray Position and a Search for an IR Counterpart1,211footnotetext: Based on observations with the NASA/ESA Hubble Space Telescope, obtained at the Space Telescope Science Institute, which is operated by the Association of Universities for Research in Astronomy, Inc., under NASA contract NAS5-26555.22footnotetext: Based on observations obtained with the Apache Point Observatory 3.5-meter telescope, which is owned and operated by the Astrophysical Research Consortium, and on observations made with ESO Telescopes at the La Silla or Paranal Observatories under programme ID 51.5-0043.
Abstract
Despite the unique X-ray behavior of the compact bursting X-ray source MXB1730-335, the “Rapid Burster” (RB) in the highly reddened globular cluster Liller 1, to date there has been no known optical/IR counterpart for the object, no precise astrometric solution that correlates X-ray, radio, and optical positions and thus restricts the number of possible candidates, nor even published IR images of the field. We solve a previous radio/X-ray positional discrepancy, presenting the results of precise Chandra X-ray imaging, which definitively show that the radio source is positionally aligned with MXB1730-335. At the same time, we have detected three additional low luminosity () X-ray sources within two core radii, which are possibly quiescent low-mass X-ray binaries. We present both ground-based and Hubble Space Telescope infrared imaging of the field (in quiescent and bursting X-ray states of the RB), together with the necessary astrometric solution to overlay the radio/X-ray source positions. Even at HST resolution, the RB field is very complex and there are multiple candidates. No object of unusual color, or of substantial variability in quiescent versus active or burst versus non-burst states, is identified. Further, more sensitive HST/NICMOS and/or ground-based adaptive-optics observations are needed to confidently identify the proper counterpart. In the case of the RB, uncertain but plausible calculations on the effects of the burst on the binary companion indicate that detection of a variable candidate should be feasible.
1 INTRODUCTION
Unique in the Galaxy, the Rapid Burster (MXB 1730335, hereafter RB) in the globular cluster Liller 1 is the only low-mass X-ray binary (LMXB) star system observed to emit both type I and II X-ray bursts (Hoffman et al. 1978). Often the rapid chains of bursts occur at intervals as short as 7 s, sometimes producing thousands of bursts per day. The burst flux is related to the time between bursts in a fashion reminiscent of a relaxation oscillator, strongly implying that the neutron star magnetic field acts as a reservoir which fills and empties, causing each burst. Thus with this object we are directly observing the dynamic behavior of the intense magnetic field of a neutron star on a timescale of seconds. This activity only occurs during the outburst phase, which occurs every 6-8 months and lasts only a few weeks. The Rossi X-ray Timing Explorer (RXTE) All-Sky Monitor (ASM) has been continuously monitoring the X-ray sky for years, and has to date observed many outburst episodes from the RB. This outburst behavior is described in detail by Guerriero et al. (1999), and a more general summary of the properties of the RB is given by Lewin et al. (1995).
Despite considerable study of this object in X-rays, there remains no optical counterpart, which is almost surely due to the extreme crowding from cluster stars as well as high interstellar extinction. There have been past searches for IR bursts, analogous to the extraordinary X-ray behavior, using large () apertures centered on the cluster. The results, summarized by Lewin et al. (1995), are tantalizing but ambiguous. Direct identification of a stellar IR counterpart would thus be extremely important in planning of follow-on studies of this fascinating object. Optical work will be extremely difficult for this system, as the interstellar reddening is E for Liller 1 (Frogel et al. 1995; Ortolani et al. 1996). In passing we note that the cluster itself is also astrophysically important: Frogel et al. (1995) conclude it is the most metal rich cluster known.
The most accurate X-ray position to date for the RB was derived from Einstein observations by Grindlay et al. (1984), but the uncertainty there is still several arcseconds. Moreover, there is a considerable () discrepancy between that X-ray position and recently determined positions of a probable radio counterpart. Moore et al. (2000) and Fruchter & Goss (2000) both report on a variable radio source near the center of the cluster. Specifically, Moore et al. (2000) found an apparent correlation between the changes in radio and X-ray fluxes, which strongly implies that the radio counterpart to the Rapid Buster has indeed been isolated. These authors also discuss in detail a likely explanation for the X-ray/radio positional discrepancy, wherein the uncertainty in the X-ray position is underestimated and the uncertainty distribution strongly non-Gaussian.
In order to both resolve the positional discrepancy and determine a far more accurate X-ray position, we have obtained high angular resolution X-ray imaging of the Liller 1 field with Chandra X-ray Observatory and HRC-I. Working within a much smaller error circle for the X-ray/radio source, we have made the first IR/optical imaging search for the counterpart in these bands. We make use of both ground-based observations obtained during an outburst episode and Hubble Space Telescope observations obtained during a quiescent phase. Furthermore, we have serendipitously detected three low luminosity X-ray sources in the core, for which we also analyze the HST IR photometry.
2 X-ray data analysis and results
2.1 Chandra HRC-I observations
We observed Liller 1 with Chandra for 15.4 ks on 2000 August 2. The 3030′ field-of-view high resolution camera imager (HRC-I; Murray et al. 1997) was approximately centered on the cluster center. This mode provides the highest possible spatial resolution available from Chandra, to achieve our primary science goal, and its large FOV raises the probability of detecting additional X-ray sources, which can be matched to cataloged optical star positions, thus improving the astrometry even farther. However, unlike the X-ray CCD detectors, the HRC-I detector has very poor intrinsic energy resolution, so we have no spectral information. On the other hand, it does provide very good time-resolution, down to 16.
2.2 X-ray position of the Rapid Burster
Data reduction was undertaken with routines in CIAO v2.1. In addition to the very bright RB, a Mexican-Hat wavelet source detection routine (wavdetect) found 9 sources at greater than 3 above background in the entire field, beyond the RB’s contaminating PSF wings (a 10″radius region). The routine also gave the source positions, according to the well-determined satellite aspect for this observation. We then compared all these X-ray source positions with both the USNO A-2 and Tycho-2 catalogs (Monet et al. 1998; Høg et al 2000) which contain very accurate (within and respectively) star positions, to identify any matches. Unfortunately, only one match was made to a 10th magnitude star, TYC 7380-976-1, in the Tycho-2 catalog. An offset of and in R.A. and dec. was found between its nominal Chandra and cataloged positions. This is consistent at level with the expected uncertainty of of the Chandra aspect solution for the HRC-I, as determined for many such X-ray-optical pairs in all observations to date. We therefore apply this correction to the nominal Chandra position for the RB, and derive a new X-ray position of , , where we conservatively quote our uncertainties as those of the Chandra aspect.
We are then immediately able to compare the new Chandra X-ray position to the various published positions, as tabulated in table 1 and illustrated in figures 1 and 2. There can be no doubt about the consistency of the new X-ray position with the two radio results, providing compelling evidence of their association, and thus confirming the inaccuracy of the old Einstein result.
| Band | Telescope | (J2000) | Error | (J2000) | Error | Reference |
|---|---|---|---|---|---|---|
| (h, m, s) | () | (∘, ′, ″) | () | |||
| X-ray | Chandra/HRC-I | 17 33 24.61 | -33 23 19.9 | current work | ||
| X-ray | Einstein/HRI | 17 33 24.09 | -33 23 16.4 | Grindlay et al. 1984 | ||
| Radio | VLA (DA) | 17 33 24.61 | -33 23 19.8 | Moore et al. (2000) | ||
| Radio | VLA (CnB) | 17 33 24.56 | -33 23 19.8 | Fruchter & Goss (2000) |
2.3 X-ray state of the Rapid Burster
An X-ray lightcurve was also extracted using all available data. A circular region of 2″ radius (encircling 97% of the energy) and an annulus (80″–120″) were defined centered on the RB to measure source flux and background respectively. The events were then summed into 1s bins using the CIAO routine lightcurve, for each region. Given the brightness of the source flux, and the steady very low level of background flux, we decided that background subtraction was unnecessary. Two illustrative sections of the lightcurve are shown in figure 3; showing type-II bursts every 100s, and two additional type-I burst events (judging solely on morphology) in the lower panel. In terms of the evolution of RB outbursts (Marshall et al 1979; Guerriero et al. 1999), the source was clearly in an active state, exhibiting the rapid, quasi-regular type-II bursting characteristic of the final stages (mode-II) of the phase II of an outburst. We also note that the level of the persistent (i.e. between all bursts) flux did decrease by 30% over the course of the observation. Consideration of the ASM lightcurve (figure 4, lower panel) confirms that our Chandra observation was indeed made in the tail of an outburst, which began about July 10th, 29 days previous. In general, this July 2000 outburst appears to have been weaker than either that of August 1998 or others reported by Guerriero et al. (1999). We have used the range of best fit two-component blackbody spectra as measured by these authors, to convert HRC-I counts to flux, and indeed we measure the persistent unabsorbed flux (0.2–10 keV) to be , more than a 1000 times fainter than quoted by Guerriero et al. at a similar stage during other outbursts. This is yet another example of the complex outbursting behaviour of the RB. We do note, however, that low as this flux is, it is still 10 times brighter than the quiescent detection made by ASCA (Asai et al. 1996).


2.4 Serendipitous low luminosity X-ray sources in the core
The exquisite PSF of Chandra/HRC-I opens up for the first time the possibility of detecting a population of fainter X-ray sources co-inhabiting the center of a cluster with a bright LMXB. We have undertaken such a search within the half-mass radius (27″, Harris 1996) of Liller 1. This region is still largely dominated by the wings of the RB PSF. However, using makegti and dmfilter routines we have created a summed image, using only time-intervals when the RB is between bursts, and many times fainter. We used a sliding cell technique (celldetect) to identify sources, which were then centroided to give the nominal Chandra positions. Four sources were detected; the RB of course, plus two additional ones at 5 confidence and a third at 4 . The corrected positions, count rates, assumed spectral models and corresponding luminosities (quoted in the 0.5–2.5 keV band for ease of comparison to ROSAT results) are detailed in table 2. All three low luminosity sources lie within approximately two core radii, taken as (Harris 1996), a region in which we would only expect extragalactic background sources at these flux levels or greater (Giacconi et al. 2001), so we can be reasonably confident of their association with the cluster.
Indeed, the relatively high values of our new sources are immediately suggestive as to their nature. The sensitive Chandra/ACIS spectro-imaging surveys of the globular clusters 47 Tuc (Grindlay et al. 2001) and Cen (Rutledge et al. 2001) have revealed that the brightest sources are most likely quiescent LMXBs (qLMXBs) on X-ray spectral grounds, with the next brightest class, probably magnetic CVs, 10-100 times fainter. These new Liller 1 sources have values consistent with these qLMXBs.
| Object | Position | Error | HRC-I count rate | Spectral model | (.5-2.5 keV) |
|---|---|---|---|---|---|
| , (J2000) | () | (counts s-1) | (blackbody or | ( )aaLuminosity for a distance of 10.5 kpc, and corrected for substantial interstellar absorption by cm-2 (Marshall et al. 2001) | |
| (h, m, s), (∘, ′, ″) | thermal bremsstrahlung)bbThe range of for the RB is that found by Guerriero et al. (2000) for the dominant cooler blackbody component in their fit to its persistent emission. For the other sources representative temperatures are shown for blackbody fits to qLMXBs, and thermal bremsstrahlung fits to CV spectra. | ||||
| Rapid Burster | 17 33 24.61ccPosition as derived from all data, but that for the persistent emission alone is fully consistent. | ddpersistent emission | keV | ||
| -33 23 19.9 | keV | ||||
| CXOU J173324.1-332316.0 | 17 33 24.14 | =0.3 keV | |||
| (C1) | -33 23 16.0 | =0.1 keV | |||
| =5 keV | |||||
| CXOU J173324.1-332321.7 | 17 33 24.17 | =0.3 keV | |||
| (C2) | -33 23 21.8 | =0.1 keV | |||
| =5 keV | |||||
| CXOU J173324.1-332325.7 | 17 33 24.12 | =0.3 keV | |||
| (C3) | -33 23 25.7 | =0.1 keV | |||
| =5 keV |
3 Search for IR counterparts
3.1 Optical/IR Astrometry
In general, the very accurate USNO-A2.0 star catalog (Monet et al. 1998) makes it possible to tie an arbitrary field rather easily to the International Celestial Reference System (ICRS) with sub-arcsecond precision. We use this catalog to tie the field of Liller 1 to the ICRS, and use the empirical uncertainty estimators of Deutsch (1999) to determine the size of the error circles we examine. We adopt an optical radial uncertainty of from the last row of Table 1 in that work.
We begin with a -band image of Liller 1 obtained from ESO NTT science archive; this 130130′′ image was first discussed in a study of Liller 1 by Ortolani et al. (1996). The stellar profiles have FWHM , and the image is sampled at pixel-1. We select 33 bright and isolated stars in common between the USNO-A2.0 catalog (epoch 1975.4 in this field) and the -band image (epoch 1994.4) and fit an astrometric solution to the image using IDL procedures written by E.W.D. and from the Astronomy User’s Library (Landsman 1993). The residuals of the fit (=) imply an approximate uncertainty () in the alignment to the USNO-A2.0 frame of before considering proper motion effects.
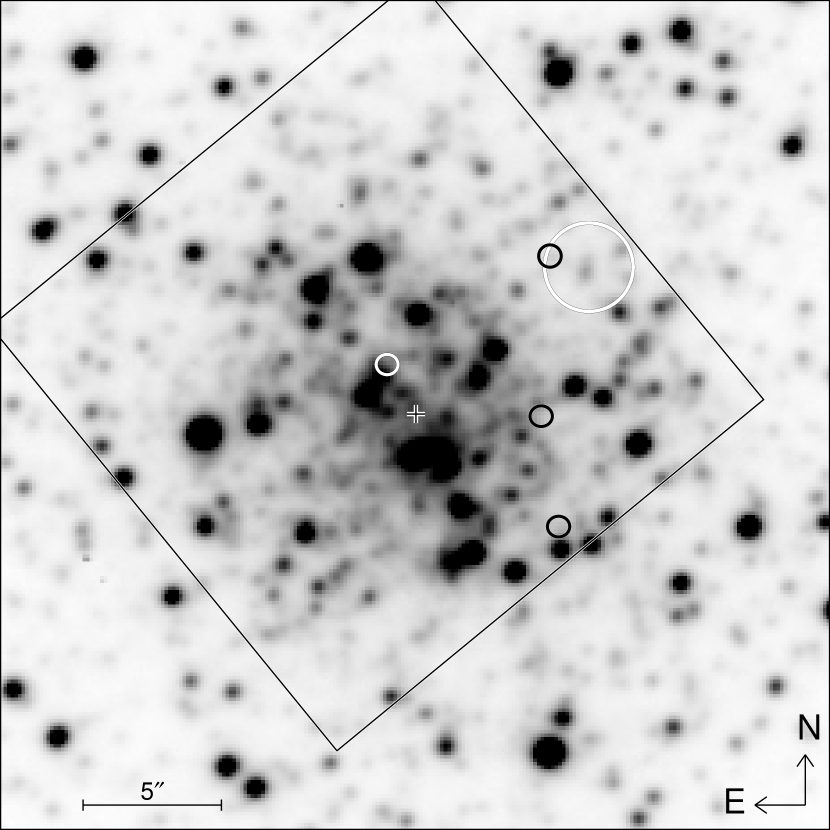
In Fig. 1 we show a 3030′′ region of the -band image centered on the cluster. We have estimated the approximate center of the cluster from this image as marked with a symbol. The 1 error regions for X-ray sources are also overplotted; the respective positions for the RB in white, from Einstein (large) and Chandra (small), whilst the three low luminosity sources detected by Chandra are in black. The tilted square indicates the field-of-view of the HST IR image, the central part of which is shown in more detail in Fig. 2.
3.2 HST NICMOS Imagery
There are many HST NICMOS images of Liller 1 in the Hubble Data Archive, but only one set of observations are positionally suitable for a search for the RB in the core of the cluster. The two observations are made with the NIC2 camera (1919′′ field of view sampled at pixel-1) and the F110W and F160W filters, which are similar to the and bands, respectively. We reprocess the raw n4lc01010 and n4lc01040 datasets, observed on 1998 August 8, with the STSDAS calnica task and the latest calibration reference files.
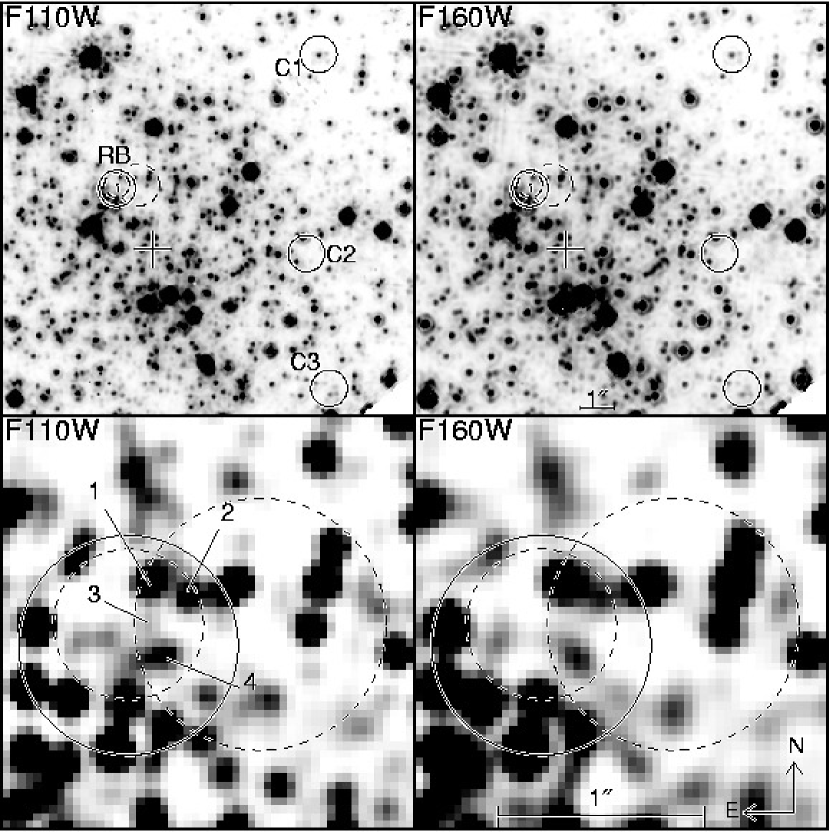
Each observation includes four individual exposures at different offsets. Since the field is so crowded, even by HST standards, we employ the STSDAS dither package (Fruchter et al. 1998) to combine the four frames on a finer pixel grid. The frames are drizzled into a final image with pixels. This process significantly mitigates the loss of resolution due to the undersampling of the PSF. In Fig. 2 we display the resulting combined images. The images were obtained with the F110W (left) and F160W (right) filters, and the central peaks of stellar objects have FWHM and , respectively. The upper panels show a 1414′′ field including the positions of all 4 sources detected by Chandra. The lower panels show restored images, zoomed-in on the RB position alone; we applied a Lucy-Richardson restoration technique, in order to remove the pronounced Airy ring structure in the wings of the PSF.
On each frame we draw three sets of error regions. The small solid circles are those of our Chandra X-ray source positions, whilst the smaller dashed circle denotes the RB radio position of Moore et al. (2000) and larger dashed circle denotes the RB radio position of Fruchter & Goss (2000). In each case the size of the axes represents the combination of the optical astrometric uncertainties (), with the X-ray/radio uncertainties (see tables. 1 and 2). The center of the cluster is again marked.
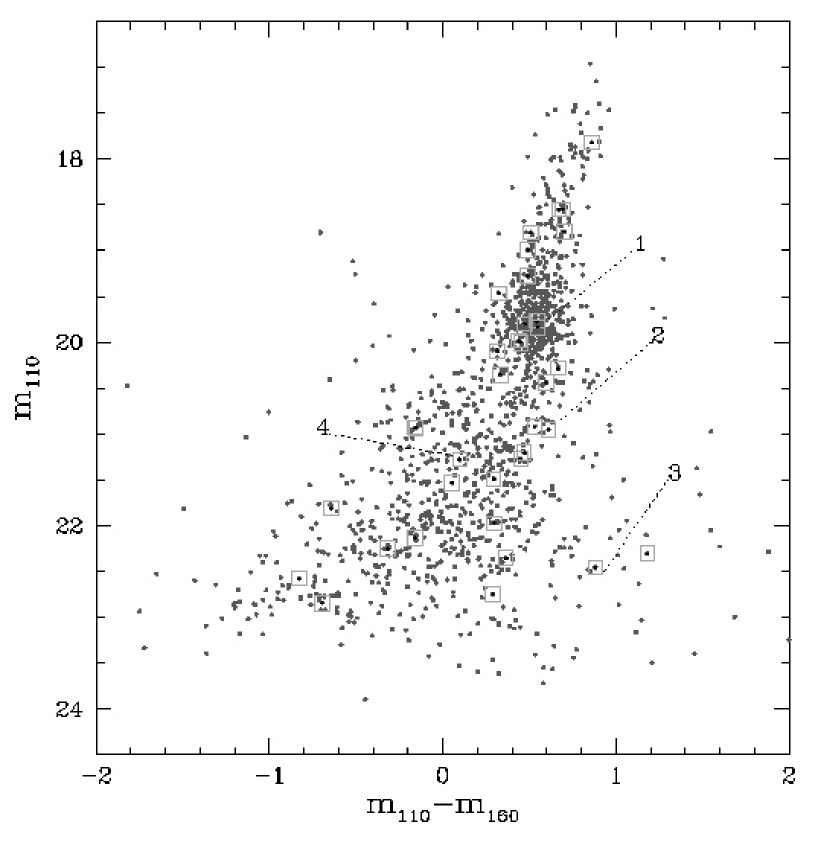
We have performed aperture photometry on all stars within 2″ of each X-ray/radio source position, and constructed an IR color-magnitude diagram (see fig. 5). The stars within each 1 error region are identified by the boxes. In the case of the RB, its counterpart is most likely to lie within the overlap region of its three positional determinations, hence we have also numbered four stars therein. Unfortunately, it is immediately obvious than none of these stars of positional interest have markedly unusual IR colors at the epoch of the HST observations. As the RB was in quiescence during this NICMOS observation (see fig. 4), all four sources were X-ray faint at the time. The lack of unusual IR colors implies that there was little contribution from any accretion disc and that we are mostly observing the secondary star in each case; hence their IR colors are those of a typical cluster star. In terms of variability, a qLMXB typically shows ellipsoidal variations, due to the changing aspect of the distorted (Roche lobe-filling) donor star. However, these observations were relatively short, and can place no useful constraints on such variability.
3.3 Apache Point K-band Observations
In an attempt to detect the RB counterpart by observing its IR variability, we have also obtained a set of time-resolved, resolution imaging observations of Liller 1 in the K band, taken with the Apache Point (APO) 3.5-m telescope during a recent X-ray outburst episode which began around 1998 August 17 (Fox & Lewin 1998). The observations were acquired on multiple nights in 1998 August-September, approximately one hour per night, including times of simultaneous pointed X-ray observation by RXTE during which X-ray bursts were recorded. We search both the X-ray and radio error circles for a variable object, using an image-subtraction technique. The infrared APO observations were done with the GRIM II infrared imager, which yields pixel-1 over the array in its F/10 mode. We attempted observations on eight nights, of which five yielded usable data. Figure 4 shows the ASM X-ray light curve with the epochs of our IR APO observations overlaid. Due to the hour angle and southern declination, only hr of observation was possible on each night. The best exposures were stacked to create a deep image for each night. The resolution of the stacked images ranged from to . GRIM often produces better image quality than this, but not at this large airmass ).
The IR images are stacked to improve signal to noise and remove detector imperfections. First we look for possible variability between nights by stacking the best exposures from each night and subtracting the stacks from one another. The stacked images are rotated and shifted to align optimally, and the image with the better PSF is convolved with a kernel which causes both images to have matching PSFs. The kernel is determined with the psfmatch task in the IMMATCH package within IRAF. Finally, the two images are scaled to the same relative flux and subtracted.
No obvious significant flux difference is evident within the X-ray/radio error circles in the subtracted images. To quantify the flux difference that should have been detectable, we add artificial stars in the original stacked images. We extract a bright star PSF, scale it appropriately, and add it to the images in regions near the error circles with similar flux levels. We find that we could have easily detected a flux difference corresponding to a object fading by 1 mag.
On 1998 August 28 one orbit of RXTE PCA X-ray observation was simultaneous with our IR observation. Type I and II X-ray bursts were detected during this X-ray observation. The X-ray observation window and the observed burst times were kindly provided to us by D. Fox (private communication).
We stack all the IR exposures which occurred during an X-ray burst and subtracted a stack of exposures which were obtained between bursts. Again, no obvious excess flux is detected. Using artificial star tests, we determine that we could have easily detected a flux difference corresponding to a object fading by 1 mag inside the X-ray/radio error circles.
4 DISCUSSION
The accurate X-ray position and corresponding astrometric solution imply that there is unlikely to be a confident identification of an IR counterpart to the RB on positional grounds alone: the field is simply too complex, and we are largely ignorant of the expected IR properties of this exotic object. Thus detection of variability might be a key to identification of the counterpart.
Previous IR observations of this object made use of large aperture () photometers. Several IR bursts were claimed in some of these previous studies (e.g. Kulkarni et al. 1979) although additional extensive IR non-detections are documented by Lawrence et al. (1983a), who cast doubt upon previous claims. Indeed, the bursts detected by Kulkarni et al. (1979) would be fabulously bright if real: the peak intensities appear to be comparable to the total flux of the center of the entire cluster. Such intense bursts would have nearly saturated our detector.
In order to make a separate estimate of the IR flux we might expect, we use the example of an optical burst observed from MXB 1636–53 by Lawrence et al. (1983b). Using the observed persistent and brightest UBV magnitudes for that object, we estimate a persistent and brightest based on the 25,000 and 50,000 K blackbody temperatures, respectively, derived by Lawrence et al. (1983b). Assuming a similar distance and correcting for the reddening to Liller 1, E, we crudely estimate a persistent and brightest . This argument was originally put forward by Fox et al. (1998) who reached a similar conclusion. It is unclear how accurate these estimates may be, as the absolute optical/IR luminosity depends heavily upon the size of the reprocessing region; moreover as not even an orbital period is known for the RB, we have no idea whether its geometry is comparable to MXB 1636–53. Our observed upper limits from the ground-based IR data fall short of testing these model estimates, principally due to seeing effects. However, such tests should be feasible with future HST or ground-based adaptive-optics IR observations.
In the case of the three probable qLMXBs we have detected with Chandra, the identification of counterparts may prove even more difficult. Detection of ellipsoidal variability or another observation catching a source in outburst might work. However, we have little knowledge as to their outburst recurrence timescales, as X-ray source confusion with the RB has always been a limitation before. Even the long-term coverage of the Liller 1 field by RXTE/ASM shows no evidence for more than one source going into outburst, and pointed observations during these outbursts have always confirmed the RB as the source. Interestingly, one of low luminosity sources, CXOU J173324.1-332316.0, is aligned with the old Einstein position for the RB. One might speculate that if this source were in outburst at the time of that determination it might have contributed at least to an underestimation of the true positional uncertainties for the RB. In any case our new precise Chandra position, consistent with two independent radio positions, confirms without doubt the true location of the RB within Liller 1.
References
- (1) Asai, K., Dotani, T., Kunieda, H., & Kawai, N. 1996, PASJ, 48, L27
- (2)
- (3) Deutsch, E. W. 1999, AJ, 118, 1882
- (4)
- (5) Frogel, J. A., Kuchinski, L. E., & Tiede, G. P. 1995, AJ, 109, 1154
- (6)
- (7) Fox, D. W., & Lewin, W. H. G. 1998, IAUC 6813
- (8)
-
(9)
Fox, D., Smith, D., Lewin, W., & Rutledge, R. 1998, The
Astronomer’s Telegram No. 32
(http://fire.berkeley.edu:8080/) - (10)
- (11) Fruchter, A. S., Goss, W. M. 2000, ApJ, 536, 865
- (12)
- (13) Fruchter, A. S., Hook, R. N., Busko, I. C. & Mutchler, M., 1998, in Proceedings of 1997 HST Calibration Workshop, STScI, ed. S. Casertano, et al., 518
- (14)
- (15) Giacconi, R. et al. 2001, ApJ, 551, 624
- (16)
- (17) Grindlay, J. E., Heinke, C. E., Edmonds, P. D., & Murray, S. S. 2001, Science, 292, 2290
- (18)
- (19) Grindlay, J. E., Hertz, P., Steiner, J. E., Murray, S. S., & Lightman, A. P. 1984, ApJ, 282, L13
- (20)
- (21) Guerriero, R. et al. 1999, MNRAS, 307, 179
- (22)
- (23) Harris, W.E. 1996, AJ, 112, 1487
- (24)
- (25) Hog E. et al. 2000, A&A, 355, L27
- (26)
- (27) Hoffman, J. A., Marshall, H. L. & Lewin, W. H. G., 1978, Nature, 271, 630
- (28)
- (29) Kulkarni, P. V., Ashok, N. M., Apparao, K. V. M., & Chitre, S. M. 1979, Nature, 280, 819
- (30)
- (31) Landsman, W. B. 1993, in ASP Conf. Ser. 52, Astronomical Data Analysis Software and Systems II, ed. R. J. Hanisch, R. J. V. Bissenden, & J. Barnes (San Francisco: ASP), 246
- (32)
- (33) Lawrence, et al. 1983a, ApJ, 267, 301
- (34)
- (35) Lawrence, et al. 1983b, ApJ, 271, 793
- (36)
- (37) Lewin, W. H. G., van Paradijs, J., & Taam, R. 1995, in X-ray Binaries, ed. W. H. G. Lewin, J. van Paradijs, and E. P. J. van den Heuvel (Cambridge: University Press), 175
- (38)
- (39) Marshall H. L. et al. 2001, 122, 21
- (40)
- (41) Marshall H. L., Ulmer, M. P., Hoffman J. A., Doty, J. & Lewin, W. H. G. 1979, ApJ, 227, 555
- (42)
- (43) Moore, C. B., Rutledge, R. E., Fox, D. W., Guerriero, R. A., Lewin, W. H. G., Fender, R., & van Paradijs, J. 2000, ApJ, 532, 1181
- (44)
- (45) Monet, D., et al. 1998, USNO-A2.0: A Catalog of Astrometric Standards (Washington: US Nav. Obs.)
- (46)
- (47) Murray, S. S. et al. 1997, Proc. SPIE, 3114, 11
- (48)
- (49) Ortolani, S., Bica, E., & Barbuy, B. 1996, A&A, 306, 134
- (50)
- (51) Rutledge, R., Bildsten, L., Brown, E. F., Pavlov, G. G., & Zavlin, V. E. 2001, submitted to ApJ (astro-ph/0105405)
- (52)
Note added in proof – A. Tennant (2001, private communication) has derived an independent position for the RB from Chandra timing data, which while not as accurate as that discussed here, does tend to confirm the positional association of the X-ray and radio sources.