Chandra observations of the X-ray jet in 3C 66B
Abstract
Our Chandra observation of the FRI radio galaxy 3C 66B has resulted in the first detection of an X-ray counterpart to the previously known radio, infra-red and optical jet. The X-ray jet is detected up to 7 arcsec from the core and has a steep X-ray spectrum, . The overall X-ray flux density and spectrum of the jet are consistent with a synchrotron origin for the X-ray emission. However, the inner knot in the jet has a higher ratio of X-ray to radio emission than the others. This suggests that either two distinct emission processes are present or that differences in the acceleration mechanism are required; there may be a contribution to the inner knot’s emission from an inverse-Compton process or it may be the site of an early strong shock in the jet. The peak of the brightest radio and X-ray knot is significantly closer to the nucleus in the X-ray than in the radio, which may suggest that the knots are privileged sites for high-energy particle acceleration. 3C 66B’s jet is similar both in overall spectral shape and in structural detail to those in more nearby sources such as M87 and Centaurus A.
keywords:
galaxies: active – X-rays: galaxies – galaxies: individual: 3C 66B – radiation mechanisms: non-thermal1 Introduction
In the first year of its operation, the Chandra X-ray Observatory has vastly increased the number of known X-ray counterparts to radio features of extragalactic radio sources. Several X-ray detections of hotspots in classical double sources (e.g. Harris, Carilli & Perley 1994; Harris, Leighly & Leahy 1998) had already been made with ROSAT, but Chandra has detected several new objects (3C 295, Harris et al. 2000; 3C 123, Hardcastle, Birkinshaw & Worrall 2001; 3C 263, Hardcastle et al. in preparation) as well as giving new spectral information on existing detections (Wilson, Young & Shopbell 2000, 2001). However, the most striking result has been the detection of a number of new X-ray jets. Individual knots in the jets of some prominent objects had already been detected in the X-ray in a few cases (e.g. M87, Harris et al. 1997, Neumann et al. 1997; Centaurus A, Döbereiner et al. 1996, Turner et al. 1997; 3C 273, Röser et al. 2000) but the superior sensitivity and resolution of Chandra has allowed the imaging of a number of continuous features which meet the Bridle & Perley (1984) criteria for classification as a jet. The early detections were of powerful FRII objects (PKS 0637752, Schwartz et al. 2000, Chartas et al. 2000; Pictor A, Wilson et al. 2000) but it is becoming clear that X-ray jets are also common in nearby FRI sources. This was unexpected, since optical FRI jets are rare and since inverse-Compton processes in FRIs might be expected to produce only very faint emission. In a previous paper (Worrall, Birkinshaw & Hardcastle 2001) we reported on the first two new FRI X-ray jets to be discovered with Chandra, based on short ( ks) Chandra observations. In this paper we present a deep observation of a third new X-ray jet, in the nearby radio galaxy 3C 66B.
3C 66B is a low-luminosity FRI radio galaxy with a redshift of 0.0215, hosted by the elliptical galaxy UGC 1841, which lies in a small group on the edge of the cluster Abell 347, part of the Perseus-Pisces supercluster. In the radio, its bright jet was one of the first to be discovered (Northover 1973) and it has subsequently been well studied (e.g. Leahy, Jägers & Pooley 1986). Detailed comparisons have been made between the jet and the weaker counterjet (Hardcastle et al. 1996, hereafter H96). An optical counterpart to the jet was discovered by Butcher, van Breugel & Miley (1980), and identified from its polarization properties as synchrotron radiation (Fraix-Burnet et al. 1989). The optical jet has since been observed at a number of wavelengths with the Hubble Space Telescope (HST) FOC and STIS (Macchetto et al. 1991; Sparks et al. in preparation), and the optical structure has been shown to agree well with the radio (Jackson et al. 1993). Most recently, Tansley et al. (2000) have used ISO to detect a mid-infrared jet whose properties are consistent with those found at other wavebands. Giovannini et al. (2001) report on global VLBI observations which show that the high jet to counterjet ratio persists to sub-pc scales. The counterjet, if present, is below the noise limit for most of the length of the pc-scale jet, although they do detect a counterjet component very close to the VLBI core, perhaps implying jet velocity structure or variations in velocity along the jet. They suggest that the source lies at about 45∘ to the line of sight, consistent with earlier inferences from the kpc-scale jet asymmetries (H96).
In the X-ray, some extended emission associated with the source, as well as compact nuclear emission, was detected with Einstein (Maccagni & Tarenghi 1981), and also appears in ROSAT Position Sensitive Proportional Counter (PSPC) All-Sky Survey data (Miller et al. 1999); however, the source appeared unresolved to the ROSAT High Resolution Imager (HRI; Hardcastle & Worrall 1999). Neither observatory had the resolution or sensitivity to detect a possible counterpart to the radio and optical jet, which is bright only out to about 7 arcsec from the nucleus. Our observation with Chandra was intended to search for the X-ray jet. In a future paper we expect to present results from our approved XMM-Newton observations of 3C 66B’s gaseous environment.
Throughout this paper we assume km s-1 Mpc-1. One arcsec corresponds to 0.61 kpc in this cosmology at the redshift of 3C 66B. Spectral index is defined in the sense .
2 Observations and data processing
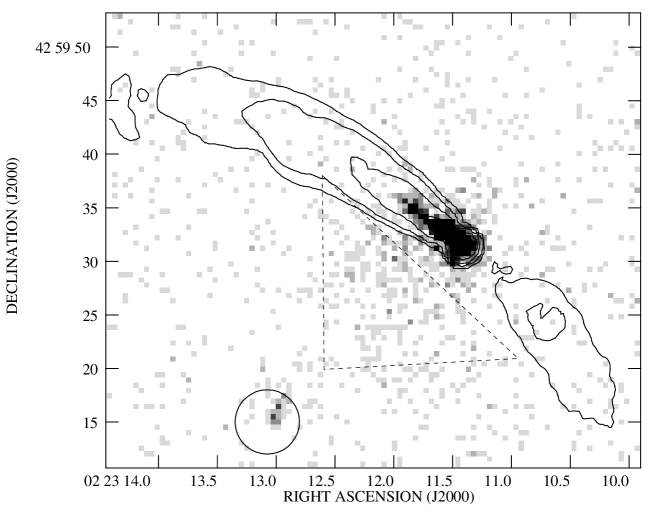
We observed 3C 66B for 43968 s with Chandra on 2000 November 20th. Because it was possible (based on ROSAT fluxes) that the count rate from the nucleus would give rise to pileup, we chose to read out only 400 rows from each of the 6 ACIS-S CCDs, thus reducing the frame time. 3C 66B was positioned in the centre of the readout region, near the aim point of the back-illuminated S3 chip. We followed the ciao ‘science threads’ using ciao version 2.0.2 to generate a new Level 2 events file with the 0.5-pixel randomization removed and containing events with the standard set of grades. The observation was affected by the well-known high-background problem, and after filtering to remove the most strongly affected intervals we were left with an effective exposure of 32762 s. Fig. 1 shows the Chandra image produced from these data. Diffuse emission on scales comparable to the optical galaxy, a nuclear component and the jet are all detected in X-rays, and these are discussed further in the following sections. In each case, spectra were extracted using ciao, with the best available responses being constructed for each extraction region, and analysed using xspec. Spectra were binned such that every bin had net counts, and fits were restricted to the energy range 0.5–7.0 keV.
3 Extended emission
Some extended emission can clearly be seen in Fig. 1, lying predominantly to the SE of the nucleus. Emission from the southeastern companion galaxy of UGC 1841 is also detected, with about 50 net counts. Radial profile analysis and examination of smoothed or binned images show that 3C 66B lies near the centre of a relatively smooth, low-surface-brightness distribution of X-ray-emitting gas which extends out to at least 40 arcsec from the core and contributes 0.5–7.0 keV counts to the image. Because the counts in much of this region are dominated by background, and because the extended emission very likely fills our readout region, it is difficult to obtain a useful spectrum of this large-scale emission. However, we have measured the spectrum of the clump of gas to the SE of the source, which contains 0.5–7.0 keV counts using an off-source background region (a source-centred annulus between 55 and 60 arcsec from the core). It is well fitted (, where denotes degrees of freedom) with a mekal model with an assumed 0.5 cosmic abundance and keV (errors are for one interesting parameter throughout), using Galactic absorption ( cm-2; Stark et al. 1992). This temperature is similar to that seen in extended gas close to the host galaxies of other FRI sources (Worrall & Birkinshaw 2000, Worrall et al. 2001).
The large-scale bending of the jets in 3C 66B, seen in Fig. 1, is plausibly caused by the motion of the host galaxy through the group-scale gas in a northwesterly direction. If this is the case, it is interesting that the high-surface-brightness extended emission lies behind the galaxy, to the SE. This may be evidence for ongoing ram-pressure stripping of hot gas associated with UGC 1841.
The small number of counts from the companion galaxy prevents us from analysing its spectrum in detail, but its emission appears significantly harder than that of the nearby extended gas; the best-fitting , assuming Galactic absorption, is 2.7 keV, and is greater than 1.0 keV at the 99% confidence level. The X-ray emission appears to be slightly off-centre, in the direction of 3C 66B. The luminosity of the detected emission is about ergs s-1, so it is plausible that it originates in a population of X-ray binaries.
4 The nucleus
The nucleus of 3C 66B produced counts between 0.5 and 7.0 keV, using an extraction circle with radius 3 Chandra pixels (1.5 arcsec) to avoid contamination with jet and thermal emission, and taking background from an off-source region (a 30-arcsec circle centred 48 arcsec to the SE of 3C 66B). Its spectrum is adequately fitted () with a simple power-law model and Galactic absorption, in which case the energy index . The fit is improved () if the Galactic is allowed to vary; the improvement is significant at the 90 per cent level on an F-test and the best-fitting value of is cm-2, with . A similar improvement () is obtained if the local absorption column is fixed at the Galactic value and the excess absorption is intrinsic to the nucleus of UGC 1841, in which case the intrinsic column is cm-2. Finally, we can obtain slightly improved fits (; the improvement is again significant at the 90 per cent level) if there is a contribution to the core spectrum at the per cent level (in terms of total flux in the 0.5–7.0 keV band) from hot gas with keV, fixing the absorption column for both thermal and power-law components at the Galactic value and the abundance at 0.5 cosmic. This temperature is similar to that seen in the off-nuclear extended emission and the addition of this component has the effect of flattening the best-fitting core spectrum, . The normalization of the thermal component implies a gas density somewhat higher than that in the extended emission discussed above, but this is consistent with our expectations, and so we adopt this model. The low intrinsic absorption and steep spectrum of the core are consistent with the results for other Chandra-observed FRI radio galaxies in Worrall et al. (2001).
The unabsorbed 0.5–4.0 keV luminosity of the non-thermal component of the core in our adopted model is ergs s-1. The 1-keV flux density is nJy (values based on other models are similar). This is substantially lower than the value of nJy that we quoted, based on the ROSAT HRI data, in Hardcastle & Worrall (1999). But when we take into account the fact that the ROSAT data point would have included a contribution from the jet and the extended emission in the 1.5-arcmin source circle used to determine the HRI count rate, the difference becomes less significant. The ROSAT data still predict around 40 per cent more counts in the central regions of the source than are observed with Chandra, but the ROSAT count rates have uncertainties of around 25 per cent, so that the difference is at less than the level. We cannot conclude that there is significant evidence for X-ray nuclear variability.
The centroid of the X-ray nucleus is offset by about 0.22 arcsec to the east of the radio nucleus, whose position is known to high accuracy. Since this discrepancy is within the known uncertainties in Chandra astrometry, we have assumed that the radio and X-ray nuclei coincide, and have shifted the Chandra data accordingly in what follows.
5 The jet
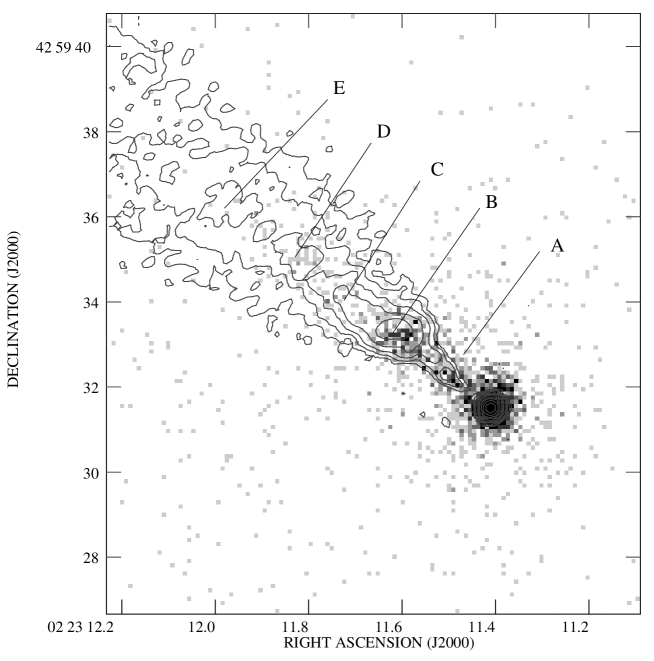
Fig. 2 shows a high-resolution image of the jet overlaid with contours from the 8.2-GHz VLA map of H96. X-ray emission from the jet is seen out to 7 arcsec from the core, or somewhere between knots D and E in the notation of Fraix-Burnet et al. (1989), and may continue to larger distances at low significance. The X-ray emitting region is thus a good match to the optical synchrotron jet as seen by the HST. As with the optical emission, it seems that the X-rays are coming from the jet as a whole rather than just from individual knots; there is clearly emission from the inter-knot regions between knots B, C and D.
The jet (using a polygonal extraction region enclosing the jet emission seen on the high-resolution map of Fig. 2) contains counts (0.5–7.0 keV), using the same off-source background region as for the nucleus. The spectrum is adequately fitted () with Galactic absorption and a single power law of , which gives a 1-keV jet flux density of nJy. The fit is not significantly improved () if the Galactic is allowed to vary; the best-fitting ( cm-2) is consistent at the level with the best-fitting value obtained for the core, but also with a Galactic absorption column. Again, the best fits (, an improvement only significant at the 90 per cent level on an F-test) are obtained with a weak contribution from thermal gas with an emission measure similar to that obtained in the fit to the extended emission and with keV, in which case . The net flux density of the non-thermal component in this model is nJy. In order to simplify comparisons later in the paper between the jet spectrum and that of individual knots, we will use the simple power-law model with Galactic absorption in what follows, noting that both fits are consistent at the level with a power-law index and a 1-keV flux density of 13 nJy.
We can compare the integrated flux density from the jet to that seen in other wavebands. Tansley et al. (2000) tabulated flux densities for the region of the jet out to knot E (8 arcsec from the core). In Fig. 3 we plot the rest-frame spectrum of this region of the jet. Note that we have corrected the HST flux densities taken from Jackson et al. (1993) both for the larger aperture (as in Tansley et al.) and for the effects of Galactic reddening, using the of 0.40 quoted by Burstein & Heiles (1984). It can be seen that when this is done the net radio-to-X-ray spectrum can be modelled as synchrotron radiation from electrons with a broken power-law energy distribution, with a flat spectrum at low frequencies, , steepening in the infra-red to and retaining this value out to the X-ray. The spectral index measured from the X-ray data is consistent with this picture (within , if the simple power-law model is adopted), and the fact that the HST data points lie slightly below the line could be attributed to uncertainties in the value of Galactic reddening (the best-fit values of derived above would imply higher values for than the value given by Burstein & Heiles, for example). Since the radio and optical emission of the jet is known to be synchrotron, we might infer from this that the X-ray emission is also all synchrotron in origin.
| Knot | 8.2-GHz flux | Size | Equipartition | 1-keV flux | ||||
|---|---|---|---|---|---|---|---|---|
| density (mJy) | (arcsec) | B-field (nT) | density (nJy) | |||||
| A | 2.72 | 10 | ||||||
| B | 25.1 | 12 |
Radio spectral indices are measured from our MERLIN 1.5-GHz and VLA 8.2-GHz images. X-ray spectra and flux densities use the spectral model for the jet described in the text, with Galactic absorption (unabsorbed flux densities are quoted). Equipartition field strengths are calculated neglecting the effects of Doppler boosting and projection, and assume a low-frequency spectral index of 0.5 and a low-energy cutoff corresponding to , with no contribution to the energy density from non-radiating particles such as relativistic protons. Optical flux densities used to calculate spectral indices are measured from the HST STIS images.

However, a more complicated picture is necessary when we look at the X-ray jet in more detail. Fig. 2 shows that the radio-to-X-ray ratio is by no means constant along the jet. The innermost regions of the jet, within 2 arcsec of the core, are responsible for a large fraction of the jet X-ray emission, but a negligible fraction of the total jet radio flux. The ratio of X-ray counts to radio flux in this region (traditionally denoted ‘knot A’, though in fact it describes the whole of the inner jet before the flare point, consisting of two knots and some extended emission) is a factor higher than in the brightest radio knot, knot B, at about 3 arcsec from the nucleus. This can be seen in Fig. 4, which shows the X-ray and radio fluxes as a function of distance along the jet. The difference arises somewhere between the optical and X-ray regimes, as illustrated in Fig. 5, which shows the flux density of each knot in the radio, ultraviolet and X-ray bands. All the knots have similar radio-to-optical spectra and show spectral steepening between the optical and X-ray, but knot A’s optical-to-X-ray spectrum is much the flattest. This has the effect that knot A, though the faintest radio and optical knot, is the second brightest X-ray feature in the source. The radio spectral index (between 1.5 and 8.2 GHz) of knot A is also different from the other knots; using matched regions on the VLA and our unpublished L-band MERLIN maps, we estimate that is about 0.75 for knot A and typically 0.6 for the other knots. However, the X-ray spectrum of knot A, using an adjacent background region, is indistinguishable from that of the rest of the jet, within the errors, at (assuming the Galactic absorption column and fitting a single power law). Table 1 compares the parameters of knots A and B. Fig. 5 also shows that knots C and E have a steeper optical-to-X-ray spectrum than knots B and D, although the errors are large.
The offset of arcsec between the X-ray and radio peaks of knot B (Fig. 4), with the X-ray peak being closer to the core, is a notable feature of the jet. There is no offset of this magnitude between the optical and radio profiles of the jet either here or at any other point along its length (cf. Jackson et al. 1993), so this is an effect which only appears at high energies. In contrast, the X-ray knots C and D seem very well aligned with their radio counterparts.


No X-ray emission is detected from the counterjet in 3C 66B. The upper limit on emission from the counterjet in a region similar to the region in which jet emission is seen is net counts, or about 0.5 nJy, an X-ray jet-counterjet ratio of . The radio jet-counterjet ratio in this region is , which is consistent; these data indicate that the counterjet does not have a flatter radio-to-X-ray spectrum than the jet.
6 Emission processes
What process is responsible for the X-ray emission from the jet of 3C 66B?
For knots B–E a simple synchrotron explanation still seems viable; in fact, removing the X-ray flux due to knot A from the integrated flux densities plotted in Fig. 3 would improve the agreement between the X-ray flux and the extrapolation from the optical data. The differences between the radio-optical-X-ray spectra of the individual knots (Fig. 5) can be accommodated without too much difficulty in a model in which the electron spectra and/or magnetic field strengths are slightly different in the different knots.
There are two obvious difficulties faced by a synchrotron model for the X-rays. Firstly, there is the necessity to produce the inferred electron spectrum, which is not a conventional continuous-injection spectrum, since it breaks by in spectral index, nor a conventional aged synchrotron spectrum, where the curvature is due to a high-energy cutoff so that spectral index increases with frequency after some critical frequency. Secondly, there is the extremely short synchrotron loss timescale for X-ray-emitting electrons, approximately 30 years for electrons radiating at 1 keV in knot B in 3C 66B if we assume the magnetic field strength is close to the equipartition value of 12 nT (Table 1). This loss timescale rules out the possibility that the acceleration of the synchrotron-emitting particles takes place in a single region of the jet, for example in knot A or in the nucleus (a possibility which was in any case only remotely viable given the optical emission; H96). Even if the magnetic field strength is extremely low, inverse-Compton losses due to scattering of microwave background photons and starlight limit the lifetime of the electrons emitting in the X-ray. This considerably constrains so-called ‘low-loss channel’ models in which the electrons are transported in a region of low magnetic field strength to the required places in the jet. If we require that the critical frequency of electrons, after they have left the low-loss channel and started to emit substantial amounts of synchrotron radiation, be above the X-ray band, then (e.g. Leahy 1991)
where is the magnetic field strength in the emitting regions, is the magnetic field strength in the low-loss channel, is the effective magnetic field strength due to inverse-Compton losses (, where is the energy density in photons), and is the time spent in the low-loss channel; is a constant with value, in appropriate units, nT3 yr2 GHz. Even in the limit that is zero, this means that the time spent in the channel must be yr (where and are in nT), while the light travel time to the end of the jet is yr (and plausible electron travel times to this location are probably a factor of a few higher). For nT, the value used by H96 (the photon energy density is assumed to be dominated by starlight), these times cannot be reconciled unless nT, two orders of magnitude above equipartition values near the end of the jet. Since the effective energy density in CMB photons in the jet frame increases with the bulk Lorentz factor (see below), it is not possible to evade this constraint by requiring the flow through the low-loss channel to be highly relativistic. We therefore regard such models as implausible. Instead, there must be regions at which acceleration takes place distributed throughout the jet – ‘in situ acceleration’ – and these must produce similar electron energy spectra at all points beyond knot A. Chandra’s spatial resolution does not allow us to distinguish between a model in which there are a number of discrete acceleration regions along the jet spine and one in which acceleration takes place everywhere in the jet, but the lack of clear radio-optical spectral-index gradients (Jackson et al. 1993) suggests that the latter is the case. However, the offset between the X-ray and radio peaks of knot B might support a model in which the bright radio knots are privileged sites for high-energy particle acceleration; in this model the shock is located close to the X-ray peak, and the offset is caused by rapid synchrotron losses of the X-ray emitting particles in the high magnetic field strength of knot B as they stream away from the shock. The more strongly peaked X-ray emission profile (Fig. 4) may be additional evidence to support this picture.
There is also no clear reason why a synchrotron model should not describe knot A, but we would like to be able to understand why synchrotron emission there is so different from the rest of the jet. Because the spectral break in the integrated jet spectrum lies in the infra-red, it is hard to construct a model in which simple differences in physical conditions, such as magnetic field strength, are responsible for the differences in the ultraviolet-to-X-ray spectrum in knot A; they would be expected to affect the STIS flux of the knot too. So, if the knot A X-rays are synchrotron emission, the high-energy electron spectrum must be quite different there. If the difference in the low-frequency radio spectral indices of knot A and the rest of the jet is significant, the electron energy spectrum of knot A must be different at all energies represented by our observations. Since the high-energy electrons are accelerated in situ, this implies in turn that the acceleration process must be different in some way in this part of the jet. [Since the equipartition magnetic field strength in knot A is similar to that in knot B, as shown in Table 1 (the much lower radio flux density is offset by the smaller physical size of the region) the electron synchrotron ages are similar to those quoted above, and so it is difficult to avoid the necessity of in situ acceleration in knot A.] If we believe that the inner jet, represented by knot A, is physically different from the rest of the jet, then differences in the acceleration process there would perhaps not be surprising; one possible model, discussed in H96, is that the knot A region represents a supersonic, relativistic jet, like those in FRII sources, which then disrupts and becomes trans-sonic and turbulent at knot B. Since the location of acceleration of the particles responsible for emission from FRII-type jets is far from clear, this model makes few concrete predictions. Alternatively, knot A may just be the first in a series of oblique shocks that take place as the jet decelerates. In this case, the knot A shock or shocks would be the strongest, and could be the most efficient at producing a population of high-energy particles; the X-ray excess in knot A could be explained as synchrotron emission from this newly accelerated electron population.
What are the alternatives to a synchrotron model for the excess emission in knot A? Thermal emission seems implausible; if the jet is intrinsically two-sided, there is no reason to expect to see thermal emission only on the side oriented towards us. The most promising alternative to synchrotron is inverse-Compton (IC) scattering by the relativistic electrons in the jet of some population of lower-energy seed photons, a process which should produce X-ray emission with a spectral index similar to that of the radio data, . The X-ray spectral index of knot A is somewhat steeper than this, so that an IC origin for its emission is contraindicated. However, we cannot rule out the possibility at a high confidence level given the uncertainties on our X-ray spectrum.
There are four possible seed photon populations for IC emission; in increasing order of their likely lab-frame energy density, these are the microwave background (CMB), synchrotron photons, starlight, and photons from the beamed nucleus of 3C 66B (BL Lac light). Of these, the first three are too weak to produce significant X-ray emission unless the magnetic field strength in knot A is about 2 orders of magnitude below the equipartition/minimum energy level. As Tavecchio et al. (2000) and Celotti, Ghisellini & Chiaberge (2001) have pointed out, the effective energy density of CMB photons in the jet frame is increased significantly if the jet is relativistic, going approximately as , where is the bulk Lorentz factor. But the jet speeds required would be much larger than those implied by sidedness analysis of 3C 66B (H96) and in any case a corresponding large increase in observed IC emission is only seen if the jet is at small angles to the line of sight; this model cannot work in 3C 66B if the angle to the line of sight is , as estimated by Giovannini et al. (2001). The most promising seed photon population is the light from a hidden BL Lac in the nucleus of 3C 66B. Using the faster (and therefore more favourable) beaming speed estimated by Giovannini et al., , we estimate that this photon population may come within an order of magnitude of producing the required energy density in photons; this is close enough that comparatively small departures from equipartition (a factor of a few in ) can bring the predicted X-ray flux up to the observed levels. A contribution to the X-ray flux of knot B from this process, which could be significant if the beaming cone angle is less than the jet opening angle (as it is for ), might help to explain the radio-X-ray offset seen for that feature, though some fine-tuning (e.g. of magnetic field strength) would be necessary to ensure that the IC emission did not dominate and cause knot B’s spectrum to resemble knot A’s. However, our calculation is carried out assuming that knot A is at rest with respect to the nucleus. If, as seems likely, knot A is moving at relativistic speeds away from the nucleus, the effectiveness of this process at producing observed X-rays is reduced. In particular, if the jet is intrinsically two-sided and the X-ray emission comes from inverse-Compton scattering of nuclear photons, the jet to counterjet brightness contrast of knot A in the radio and X-ray requires , which would push down the effective photon energy density. Very roughly, we might expect this to go down as (cf. Celotti et al. 2001), so factors of at least 2 are probably involved, requiring correspondingly larger departures from equipartition.
7 Comparison with other sources
7.1 M87

The X-ray emission detected from the complex of knots A, B and C in M87 with Einstein, ROSAT and XMM-Newton (Biretta, Stern & Harris 1991, Neumann et al. 1997, Böhringer et al. 2001) seems likely to be synchrotron. The X-ray spectral index is found by Böhringer et al. to be , and the EUVE data point at Hz (Berghöfer, Bowyer & Korpela 2000) lies on the line with connecting optical and X-ray data points. This makes it unlikely that the jet spectrum can be fitted with standard aged synchrotron models, as suggested by Perlman et al. (2001). M87’s radio-to-X-ray jet spectrum is plotted in Fig. 6, with comparison points from 3C 66B (taken from Fig. 3); the overall spectra are strikingly alike, with similar low-energy and high-energy spectral indices (the X-ray spectral indices are consistent at the joint level if we assume the simple power-law model for 3C 66B’s spectrum) and a similar spectral break at around Hz. We infer that the unknown acceleration process responsible for 3C 66B’s jet spectrum is also at work in M87.
The AB complex in M87 is in several ways analogous to knot B in 3C 66B. They are at similar projected distances, kpc, from their active nuclei, and they both represent the point where a narrow, faint radio jet abruptly brightens. Because of this it is significant that Böhringer et al. confirm that the X-ray peak of the ABC complex in M87 is offset towards the core by arcsec, or projected kpc. This compares very well with the offset of projected kpc we see in knot B of 3C 66B. The similarity between the two sources would tend to support the model, discussed above, in which the X-ray marks the location of a shock and particle acceleration. It will be important to see whether this offset can be seen in other sources and in other knots of M87 — the model predicts that the size of the offset depends quite strongly on the magnetic field strength in the knot, which should easily be testable with Chandra observations. It will also be interesting to see whether there is any anomalous X-ray brightness of the inner jet of M87, comparable to the situation in 3C 66B’s knot A.
7.2 Centaurus A
In Centaurus A, the jet X-rays have also been modelled as synchrotron emission, and their spectrum is similar to that of the jet in 3C 66B (Turner et al. 1997), but no optical constraints are available. Kraft et al. (2000) use Chandra HRC data to show that there is a good detailed correspondence between individual knots in the radio and X-ray regimes. We have examined archival Chandra ACIS-I data on Centaurus A and confirm the result of Turner et al. that the X-ray spectral index of the inner jet is , very similar to the values seen in 3C 66B and M87. Intriguingly, the inner knot of Cen A’s X-ray jet [A1, in the notation of Burns, Feigelson & Schreier (1983)] has an X-ray-to-radio ratio ten times higher than its nearest neighbours (A2, A3, A4) but a spectral index which is identical to theirs within the errors; the similarity to the behaviour of 3C 66B’s knot A is striking. The well-constrained steep spectrum of Cen A’s knot A1 and the similar distances of knots A1 and A2 from the nucleus both suggest that an inverse-Compton model is unlikely to be viable in explaining the X-ray excess in knot A1 in Cen A. New high-resolution radio maps available to us show that there are also substantial offsets between some of the radio and X-ray knots in the Cen A jet. These data will be discussed in more detail elsewhere.
7.3 3C 273
M87 and Cen A are both similar in total radio power to 3C 66B. By contrast, in the third pre-Chandra X-ray jet, that of the luminous quasar 3C 273, it has been clear for some time that a synchrotron model may have difficulties (Harris & Stern 1987, Röser et al. 2000). More recently, two groups have analysed new Chandra images (Sambruna et al. 2001, Marshall et al. 2001). Sambruna et al. argue that X-ray flux densities from several regions in the jet lie above a spectral extrapolation from the optical continuum, which would imply that the X-rays cannot be synchrotron emission from the population of electrons responsible for the radio and optical jets. Instead, Sambruna et al. favour a model in which the jet is highly relativistic and the X-rays are inverse-Compton scattered microwave background photons. Marshall et al. interpret the optical data rather differently and, despite finding rather flat X-ray spectra (), suggest that the emission can be modelled satisfactorily as synchrotron, with a single power law connecting the radio to the X-ray in the innermost knot and spectral steepening near the optical for the others. In either case, 3C 273 is probably not directly comparable to 3C 66B, but it is interesting that its X-ray-to-radio ratio decreases with distance along the jet, which is again suggestively similar to the differences we see in 3C 66B between knot A and the rest of the source.
7.4 New jets
The emission mechanisms are more uncertain for the jets newly discovered with Chandra. In PKS 0637752, the model that seems to find most widespread favour is the boosted-inverse-Compton model (Tavecchio et al. 2000), and such a model is also possible for Pictor A (Wilson et al. 2001). However, the required extreme relativistic motions on kpc scales are inconsistent with the much lower jet speeds inferred in large samples of FRIIs from jet sidedness and prominence statistics (Wardle & Aaron 1997, Hardcastle et al. 1999). It does not seem likely that this type of model will be viable in general for the jets in FRIs, since much detailed study suggests that these are at best mildly relativistic on kpc scales (e.g. Laing 1996; Laing et al. 1999), and since it works best for jets close to the line of sight, whereas the evidence seen so far with Chandra suggests that essentially every FRI radio source with a bright radio jet also has a detectable X-ray jet.
For the new FRI jets discovered by Worrall et al. (2001) less is known about the radio-optical spectra, but in at least one of them, B2 0755+37, the level of the known optical jet (Capetti et al. 2000) permits a synchrotron model for the X-rays with a spectrum very similar to that of 3C 66B. We have data in hand for four other FRI sources with X-ray jets, two of which have known optical jet emission. At least two of them, like 3C 66B, show evidence for an anomalously X-ray bright inner jet.
8 Conclusions
We have detected a new X-ray jet in the FRI radio galaxy 3C 66B. The Chandra ACIS-S image shows a good overall correspondence between X-ray and radio knots, although more detailed analysis shows significant variation in the X-ray-to-radio ratio along the jet, with the inner knot showing anomalously bright X-ray emission for its radio strength. The brightest radio and X-ray knot, knot B, is significantly closer to the core in the X-ray images than on the radio map, which may be evidence that the knots are privileged sites for high-energy particle acceleration.
3C 66B’s X-ray jet seems likely to be due to synchrotron emission, although it is possible that some of the X-ray brightness of the inner regions of the jet is due to inverse-Compton scattering of light from the BL Lac nucleus. A synchrotron explanation is possible for all the X-ray jets in other low-power, FRI sources known to us, if the radio-optical-X-ray synchrotron spectra are similar, with a flat () radio spectrum breaking to a steeper values () in the infra-red or optical. However, multi-frequency optical observations and good X-ray spectroscopy are required to test this conclusion. An X-ray jet with a strong upper limit on optical jet flux would pose a challenge to this simple picture. We can also expect to see a more complex situation when Chandra images of M87 become available.
If the X-ray emission in 3C 66B and other FRI sources is synchrotron, there is almost no way to avoid the necessity of in situ particle acceleration throughout the X-ray-emitting regions of FRI jets. The radio-optical-X-ray spectrum of 3C 66B and the spatial distribution of the optical and X-ray emission are hard to explain in any standard particle acceleration/ageing model. Processes such as magnetic field reconnection (e.g. Birk & Lesch 2000) may need to be incorporated into the standard model of FRIs if Chandra continues to find large numbers of X-ray synchrotron jets in these objects.
References
- [] Berghöfer T.W., Bowyer S., Korpela E., 2000, ApJ, 535, 615
- [] Biretta J.A., Stern C.P., Harris D.E., 1991, AJ, 101, 1632
- [] Birk G.T., Lesch M., 2000, ApJ, 530, L77
- [] Böhringer H., et al., 2001, A&A, 365, L181
- [] Bridle A.H., Perley R.A., 1984, ARA&A, 22, 319
- [] Burns J.O., Feigelson E.D., Schreier E.J., 1983, ApJ, 273, 128
- [] Burstein D., Heiles C., 1984, ApJS, 54, 33
- [] Butcher H.R., van Breugel W., Miley G.K., 1980, ApJ, 235, 749
- [] Capetti A., de Ruiter H.R., Fanti R., Morganti R., Parma P., Ulrich M.-.H., 2000, A&A, 358, 104
- [] Celotti A., Ghisellini G., Chiaberge M., 2001, MNRAS, 321, L1
- [] Chartas G., et al., 2000, ApJ, 542, 655
- [] Döbereiner S., Junkes N., Wagner S.J., Zinnecker H., Fosbury R., Fabbiano G., Schreier E.J., 1996, ApJ, 470, L15
- [] Fraix-Burnet D., Nieto J.-.L., Poulain P., 1989, A&A, 221, L1
- [] Giovannini G., Cotton W.D., Feretti L., Lara L., Venturi T., 2001, ApJ in press (astro-ph/0101096)
- [] Hardcastle M.J., Alexander P., Pooley G.G., Riley J.M., 1996, MNRAS, 278, 273 [H96]
- [] Hardcastle M.J., Alexander P., Pooley G.G., Riley J.M., 1999, MNRAS, 304, 135
- [] Hardcastle M.J., Birkinshaw M., Worrall D.M., 2001, MNRAS, 323, L17
- [] Hardcastle M.J., Worrall D.M., 1999, MNRAS, 309, 969
- [] Harris D.E., Biretta J.A.J., Junor W., 1997, MNRAS, 284, L21
- [] Harris D.E., Carilli C.L., Perley R.A., 1994, Nat, 367, 713
- [] Harris D.E., Leighly K.M., Leahy J.P., 1998, ApJ, 499, L149
- [] Harris D.E., Stern C.P., 1987, ApJ, 313, 136
- [] Harris D.E., et al., 2000, ApJ, 530, L81
- [] Jackson N., Sparks W.B., Miley G.K., Macchetto F., 1993, A&A, 269, 128
- [] Kraft R.P., et al., 2000, ApJ, 531, L9
- [] Laing R.A., 1996, in Hardee P.E., Bridle A.H., Zensus J.A., eds, Energy Transport in Radio Galaxies and Quasars, ASP Conference Series vol. 100, San Francisco, p. 241
- [] Laing R.A., Parma P., de Ruiter H.R., Fanti R., 1999, MNRAS, 306, 513
- [] Leahy J.P., 1991, in Hughes P.A., ed., Beams and Jets in Astrophysics, Cambridge University Press, Cambridge, p. 100
- [] Leahy J.P., Jägers W.J., Pooley G.G., 1986, A&A, 156, 234
- [] Maccagni D., Tarenghi M., 1981, ApJ, 243, 42
- [] Macchetto F., et al., 1991, ApJ, 373, L55
- [] Miller N.A., Owen F.N., Burns J.O., Ledlow M.J., Voges W., 1999, AJ, 118, 1988
- [] Neumann M., Meisenheimer K., Röser H.-.J., Fink H.H., 1997, A&A, 318, 383
- [] Northover K.J.E., 1973, MNRAS, 165, 369
- [] Perlman E.S., Biretta J.A., Sparks W.B., Macchetto F.D., Leahy J.P., 2001, ApJ in press
- [] Röser H.-.J., Meisenheimer K., Neumann, M., Conway R.G., Perley R.A., 2000, A&A, 360, 99
- [] Sambruna R.M., Urry C.M., Tavecchio F., Maraschi L., Scarpa R., Chartas G., Muxlow T., 2001, ApJ Letters in press, astro-ph/0101299
- [] Schwartz D.A., et al., 2000, ApJ, 540, L69
- [] Stark A.A., Gammie C.F., Wilson R.W., Bally J., Linke R.A., Heiles C., Hurwitz M., 1992, ApJS, 79, 77
- [] Tansley D., Birkinshaw M., Hardcastle M.J., Worrall D.M., 2000, MNRAS, 317, 623
- [] Tavecchio F., Maraschi L., Sambruna R.M., Urry C.M., 2000, ApJ, 544, L23
- [] Turner T.J., George I.M., Mushotzky R.F., Nandra K., 1997, ApJ, 475, 118
- [] Wardle J.F.C., Aaron S.E., 1997, MNRAS, 286, 425
- [] Wilson A.S., Young A.J., Shopbell P.L., 2000, ApJ, 544, L27
- [] Wilson A.S., Young A.J., Shopbell P.L., 2001, ApJ, 547, 740
- [] Worrall D.M., Birkinshaw M., 2000, ApJ, 530, 719
- [] Worrall D.M., Birkinshaw M., Hardcastle M.J., 2001, MNRAS submitted