Normal Branch Quasi-Periodic Oscillations in Sco X-1: Viscous Oscillations of a Spherical Shell Near the Neutron Star
Abstract
We present a comprehensive classification of all observed QPOs within the framework of the transition layer model using a large set of Rossi X-ray Timing Explorer (RXTE) data for Sco X-1. The model assumes an optically thin material along the observer’s line of sight in the horizontal branch and an increasingly optically thick material while in the other two branches that is consistent with X-ray and radio observations and the disk transition layer model of QPOs. We identify the Hz frequencies in the normal branch as acoustic oscillations of a spherical shell around the neutron star (NS) that is formed after radiation pressure near the Eddington accretion rate destroys the disk. The size of the shell is on the order of one NS radii from the NS. We also estimate the upper limit of Sco X-1’s magnetic field to be G at about one NS radii above the NS surface while in the horizontal X-ray branch.
1 Introduction
Sco X-1 is the brightest persistent non-solar X-ray source in the sky (Giaconni et al. 1962). Sco X-1’s distance is parsec (Bradshaw et al. 1997) and its X-ray luminosity is close to the theoretical Eddington limit for a 1.4 neutron star (). Sco X-1 belongs to a class of ’Z’-type low mass X-ray binaries (LMXBs) that show a Z-shape in their X-ray color diagram (CD) and their hardness-intensity diagram (HID) (Hasinger & van der Klis 1989). The upper branch of this diagram is called the horizontal branch (HB), the lower branch is called the flaring branch (FB), and the normal branch (NB) connects the other two to form the Z. All of the Z-type sources have a similar-shaped FB and NB, but not HB. The Cygnus-like sources (Cyg X-2, GX5-1 and GX 340+0) exhibit a “horizontal” HB, whereas the Sco-like sources (Sco X-1, GX 17+2 and GX 349+2) exhibit a “vertical” HB (Kuulkers et al. 1997). The differences in the two Z source groups have been suggested to result from different inclination angles to the line-of-sight (Hasinger & van der Klis 1989; Hasinger et al. 1989; Hasinger et al. 1990a; Kuulkers et al. 1994; Kuulkers 1995) or differing NS magnetic field strength (Psaltis et al. 1995).
Most Z-sources also exhibit X-ray quasi-periodic oscillations (QPOs) from a few hertz to kilohertz which vary in intensity and frequency as a function of position in the X-ray CD. The X-ray NB is characterized by the presense of 1%-5% amplitude, 6-20 Hz normal/flaring-branch quasi-periodic oscillations (N/FBOs). There is an almost linear correlation between Sco X-1’s kHz and 6 Hz QPOs. The standard interpretation (see van der Klis 1995 and references therein and Hasinger et al. 1990b) of the 6 Hz QPO is that, as the mass accretion rate increases to near Eddington, part of the accretion occurs in an approximately spherically symmetric radial inflow with a radius of a 100 km.
The standard interpretation was proposed before the discovery of kHz QPOs (Strohmayer et al. 1996; van der Klis et al. 1996; Zhang et al. 1996) and could not discuss any qualitative and quantitative dependence between these two QPO features. A new explanation is needed because it was never clear how frequencies produced by structures/phenomena with sizes of km could be strongly correlated with kHz QPO frequencies, presumably occuring in regions with sizes of an order of magnitude less ( km).
Titarchuk, Lapidus & Muslimov (1998), hereafter TLM98, considered the possibility of the dynamical adjustment of a Keplerian disk to the innermost sub-Keplerian boundary conditions (e.g., at the surface of a NS) to explain most of Sco X-1’s observed QPOs [transition layer model (TLM)]. In TLM98 the authors conclude that a transition sub-Keplerian layer between the NS surface and the last Keplerian orbit forms as a result of this adjustment. We have extended the TLM98 analysis to include the Hz low frequency oscillations observed in the NB.
In §2, we briefly describe the new RXTE and radio observations of Sco X-1. After a summary of the variety of QPO phenomenon in Z-sources, we confirm the various QPO relationships of TLM and the QPO classification of Titarchuk, Osherovich & Kuznetsov (1999) hereafter TOK99, and of Wu (2001) to include 6 Hz NBOs in §3. In §4, armed with the RXTE observation and the orientation to the line-of-sight of Sco X-1, we suggest that the strong 6 Hz N/FBOs are associated with viscous oscillations in an accreting spherical halo surrounding the NS. In §5, we calculate the characteristic velocities of the transition layer from observed values of the viscous, and kHz QPO frequencies and finally, we estimate Sco X-1’s magnetic field based on observational data. Our summary and conclusions follow in §6.
2. Observations
We observed Sco X-1 as part of a multi-frequency X-ray and radio (Fomalont et al 2001a & b) campaign using the RXTE proportional counting array (PCA) during August 3 and 22, 1997, February 27 and 28, 1998, and June 10-13, 1999. Data were simultaneously collected in the 2-60 keV energy band at both 16s and 250s resolutions. The 250s data produced power density spectra for determining QPOs. The power density spectra were fitted with either a constant plus a Lorentizan or a power law plus a Lorentizan to determine QPO frequencies. Details of these observations will be provided in Bradshaw et al. (2002).
3. Classification of Sco X-1’s QPOs, Including 6 Hz NBOs
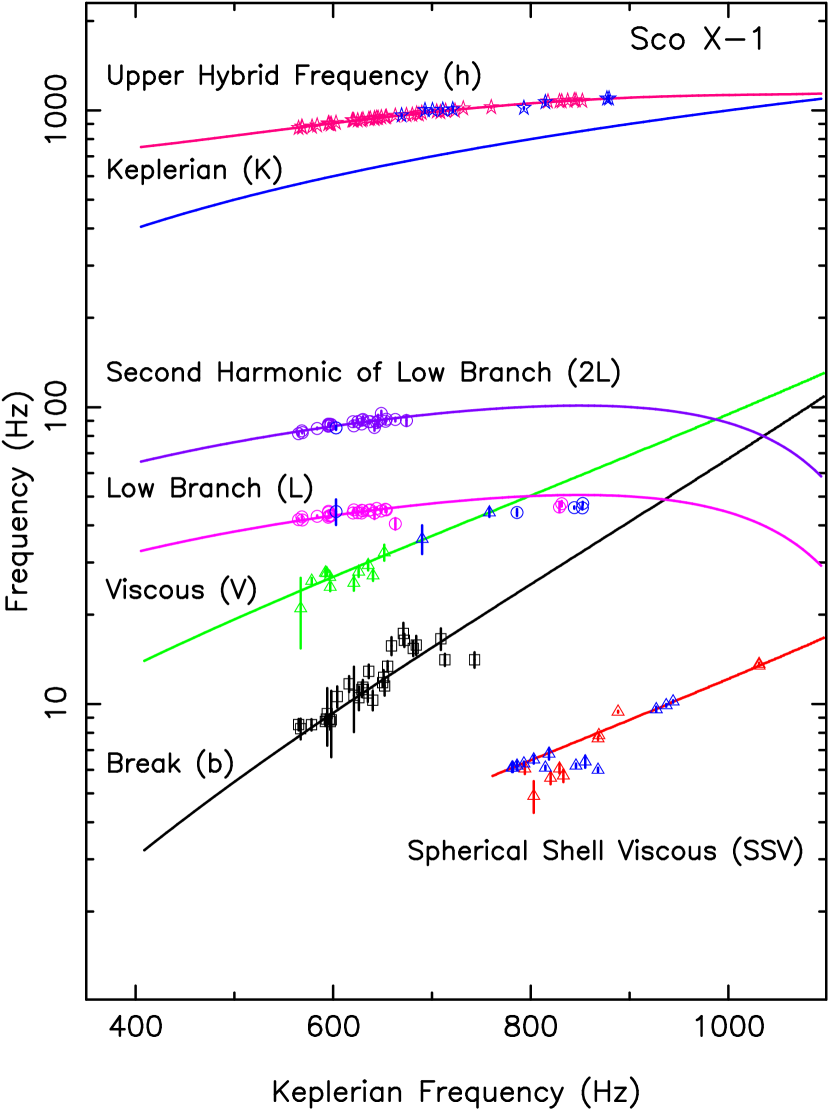
Understanding QPO relationships allows us to develop a better understanding of the accretion processes and physical parameters in bright LMXBs. TOK99 suggested a “QPO classification” for Sco X-1’s observed frequencies that includes: (1) the Keplerian frequency of matter above a transition layer, , (2) a hybrid frequency , greater in frequency than , (3) and a horizontal branch oscillation (HBO), , both of them are formed due to the Coriolis force in the rotational frame of reference, (4) the second harmonic, 2 of the HBO, discovered by van der Klis et al. (1996), (5) a viscous frequency, , related to accreting matter’s radial drift timescale, and (6) a break frequency , related to the radial diffusion timescale in the transition layer.
Correlations between kHz frequencies and 6 Hz (NBO) frequencies were presented in Figure 4 and Table 1 of van der Klis et al. (1996, hereafter VDK96) and correlations between kHz frequencies and HBO frequencies were presented in van der Klis et al. (1997, hereafter VDK97). The VDK96,97 data were obtained by the RXTE during observations of Sco X-1 in February 1996. TOK99 compared those observations with a theoretical dependence derived using the TLM, which is included in Figure 1. VDK96,97 and our 1997, 1998, and 1999 observations found upper kHz frequencies for almost all observations of Sco X-1. However, low kHz (Keplerian) frequencies were only detected in about half of the observations, requiring us to convert upper kHz frequencies to Keplerian frequencies using the upper hybrid relation defined in Osherovich & Titarchuk (1999) to compare Keplerian and 6Hz frequencies. The frequencies of the observed QPOs for Sco X-1 are plotted in Figure 1 as a function of the Keplerian frequency. In addition to the classification plot presented in TOK99 (Figure 2), we include Hz frequencies, representing spherical viscous oscillations, and newly observed QPO points, marked by blue stars, circles and triangles. The 6 Hz QPOs have frequencies satisfying the theoretically derived dependence of the viscous frequencies on . The theoretical curve for the Hz frequencies is identical to that for the viscous frequencies but with a normalization coefficient (see TOK99, Eq. 6). We find that the Hz frequencies are related to the viscous frequency branch but the normalization of the theoretical dependence of viscous frequencies on the Keplerian frequencies drops almost an order of magnitude (factor of 7.8 for Sco X-1) when the accretion rate (or luminosity) approaches Eddington.
4. 6 Hz Viscous Oscillations of a Spherical Halo
We suggest that the viscous frequency change by a factor of about an order of magnitude is caused by a radical change in the cross-section of the accretion flow. In Titarchuk and Osherovich (1999), hereafter TO99, the authors argue that where is a radial component of the accretion flow velocity and is a size of the transition layer, (i.e the distance between the transition layer outer boundary, and the NS surface, ). In the TLM, is an adjustment radius where the Keplerian disk adjusts to the sub-Keplerian transition layer (TL) and the QPO frequency is a Keplerian frequency at . Thus, a small change of should lead to a small change of the transition layer size and, hence, the viscous frequency. Under these assumptions, the only reason for a break in the viscous frequency is a break in the radial velocity . Assuming continuity of the accretion flow, we conclude that, at the stage corresponding to near 800 Hz (i.e, ), the disk-like transition layer no longer exists. The accretion geometry becomes quasi-spherical down to the NS surface. Hence, while the mass accretion rate changes relatively little, the geometry of accretion changes drastically and the cross-section of the flow increases by almost an order of magnitude (from , , to ).
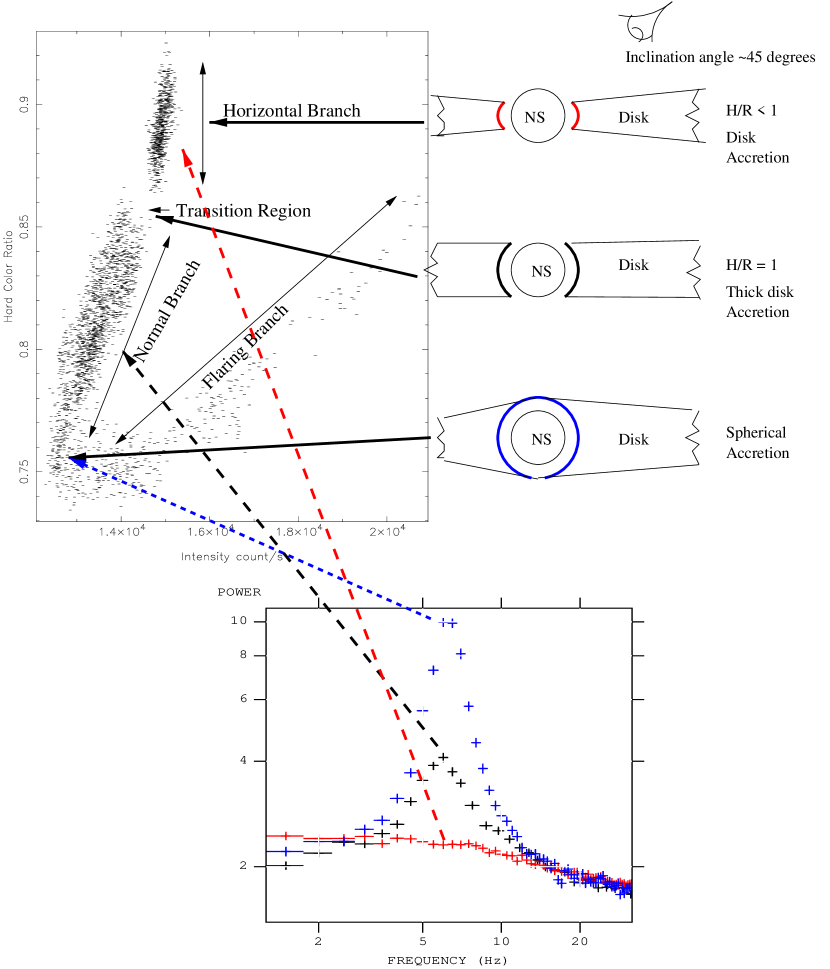
This geometrical change leads to a frequency mode change and approximately an order of magnitude decrease of the viscous frequency. The high accretion rate puffs up the transition layer and matter accretes onto the NS almost spherically, forming a transition shell instead of a transition layer. This shell produces a frequency [see Titarchuk, Bradshaw & Wood (2001), hereafter TBW01 and compare with Hasinger (1987)]
| (1) |
where is the sonic velocity and is 0.5 and for the stiff and free boundary conditions in TL respectively. Figure 2 provides a schematic of the evolution to spherical accretion. This conclusion, based on the radical viscous (NBO) frequency change in the TLM, is similar to that suggested by Hasinger (1990). However, our model interprets the Hz QPOs as acoustic oscillations of a spherical shell surface located within 20 km of the NS surface instead of the radial inflow within a radius of 100 km, presented in the standard model.
Observational support for a switch between the disk scale height-neutron star radius ratio from to in Sco X-1 may be provided by its vertical HB and by Sco X-1’s degree look angle (Fomalont et al. 2001a). The intensity of a photon source embedded in a medium of optical depth and with the scattering probability is given by (e.g. Sobolev 1975), where is an effective optical depth taking into account the electron (Thomson) scattering of X-ray photons and extinction (e.g., due to free-free and bound-free absorption). Assuming a flux source function, , given by this equation a balance is achievable between the variable intrinsic flux () and the variable optical depth that results in an approximately constant observed intensity () in HBO.
The HB is presumed to have the least accretion rate and above the transition region noted in Figure 2 (disk accretion), smaller amounts of accreting material obscure the observer’s line-of-sight to the NS. As the accretion rate increases sufficiently to produce a disk scale height to NS radius , more matter obscures the observer’s line-of-sight to the NS and Sco X-1 enters the NB. Further increases in accretion rate linearly increase the source intensity, but the observed optical depth increases too, from both a relative density increase and an increase in the path length through the obscuring material. This results in the decrease in observed intensity (because of the exponential dependence of on ) and a softening of the X-ray flux, as observed in the normal branch of Sco X-1’s HID and CD. The Sco-like source, GX 17+2, has a HID and transition region gap (Wijnands et al. 1997, Figure 1b) almost identical to Sco X-1. GX 17+2’s horizontal branch HID shows a slight slope toward lower intensity as the hard-color ratio increases. In the context of our model, GX 17+2 has a line-of-sight inclination angle that is greater, by a small amount, than the inclination angle of Sco X-1.
For a Cygnus-like Z source, the look angle is presumably greater than Sco X-1’s and thus the line-of-sight is nearly tangent to the disk surface. The X-ray emission region is effectively semi-infinite in this case, i.e. the observed radiation flux is more independent of the emission region’s optical depth and is linearly proportional to the mass accretion rate. As the accretion rate decreases past a point where the disk scale height is , decreases linearly with accretion rate, resulting in a HB with hardness increasing slowly and intensity decreasing rapidly as seen in Cyg X-2’s HID and CD.
5. The Transition Layer B-field
5.1 Viscous Velocity
Solutions presented in TO99 showed that, we can interpret as a frequency of viscous (presumably magnetoacoustic) oscillations in the transition region. The fundamental frequency of acoustic oscillations in a bounded medium with the free boundary conditions is (TBW01, see also Eq. 1). For a given Keplerian frequency the transition layer size , where and and is the gravitational constant. Thus, and for given Hz, Hz (TOK99) and , cm, . This radial velocity, , estimate translates to a plasma temperature of the transition layer of about 19 keV, provided that the viscous oscillation is determined only by thermal motion and can be verified by fitting the Sco X-1 photon spectra. However, our photon spectra fitting resulted in a transition layer temperature of 2.8 keV, suggesting that the oscillation is not determined only by thermal motion.
5.2 B-field estimate
We fitted HB and NB spectra between 8.0-25 keV with the Comptonization model of Sunyaev & Titarchuk (1980) (compST). The fitted data yielded a plasma temperature and optical depth of the transition layer of keV and , respectively. From this temperature, we derive a “Comptonization velocity” of . This velocity is a factor of 4 smaller than . In order to find the upper limit of the magnetic field of strength at the outer radius of the transition layer, we assume that the viscous frequency is determined by compresssional Alfvén waves only (see, Lang 1999 for a definition of the Alvén wave). TBW01 found that for Alfvén waves
| (2) |
where is the Alfvén velocity for magnetic field strength at and the matter density . We express . Thus we can estimate as
| (3) |
In §5.1, we calculated cm using cm as being related to . By using and , we estimate the upper limit of the magnetic field strength to be G at 22 km radius, e.g., the outer edge of the disk transition layer of Sco X-1 in the HB. This distance is about one NS radii from the surface. It is worth noting that deriving the B-field near the NS by this approach is based on our observation-based knowledge of the lower kHz QPO frequency , viscous frequency , and best-fit Comptonization optical depth and temperature . If a velocity inferred from and is much greater than , we estimate the B-field using as a frequency of the Alvén wave. Thus, this approach is general and applies to any NS system for which the above information is available.
6. Summary and Conclusions
A simple model of Sco X-1 that assumes an optically thin material along the observer’s line of sight in the horizontal branch and an increasingly optically thick material while in the other two branches is consistent with X-ray and radio observations and the disk transition layer model of QPOs. As the accretion rate increases, material from the disk puffs up and obscures the NS because the disk scale height increases (e.g., ). Sco X-1 then enters the normal branch. X-ray photons are softened by the added matter along the line-of-sight. This softening is observable as the normal branch of the Z.
We have shown that all predicted frequencies of the transition layer model for QPOs correspond with Sco X-1 observations. Furthermore, we have identified the Hz frequencies in the normal branch as acoustic oscillations of a spherical shell around the NS. This spherical shell is formed when the radiation pressure near the Eddington accretion rate destroys the disk. The size of the shell is on the order of one NS radii. We argue that there is switching from disk accretion to spherical accretion in the vicinity of the NS surface when the luminosity approaches Eddington. Our confidence in this phenomenon for Sco X-1 is based on two tests related to the QPOs classification picture and the hardness-intensity diagram. We view the striking correspondence between the data (Figures 1 & 2) and the predictions of the transition layer model as confirmation that we have correctly identified the QPO phenomena observed in Sco X-1. In addition, the best-fit parameters extracted from the photon spectra (e.g., the plasma temperature and the optical depth of the transition layer) enabled us to determine an upper limit of Sco X-1’s transition layer field while in the horizontal branch.
We thank Jean Swank and the staff of NASA’s RXTE Flight Operations Team and Guest Observer Facility at GSFC for X-ray data reduction support. We also wish to thank Sergey Kuznetsov and Michael van der Klis for the Sco X-1 data files.
References
- Bradshaw et al. (1999) Bradshaw, C. F., Fomalont, E. B. & Geldzahler, B. J., 1999, ApJ, 512, L121
- Bradshaw et al. (2002) Bradshaw, C. F., Fomalont, E. B. & Geldzahler, B. J., 2002, in preparation
- Fomalont et al. (2001a) Fomalont, E. B., Geldzahler, B. J., & Bradshaw, C. F., 2001a, ApJL, 553, L27
- Fomalont et al. (2001b) Fomalont, E. B., Geldzahler, B. J.,& Bradshaw, C. F., 2001b, ApJ, in press
- Giacconi et al. (1962) Giacconi, R., Gursky, H., Paolini, F. R. & Rossi, R., 1962, Phys. Rev. Lett., 9, 439
- Hasinger (1987) Hasinger, G., 1987, A & A, 186, 153
- Hasinger et al. (1989) Hasinger, G., Priedhorsky, W. C., & Middleditch, J., 1989, ApJ, 337, 843
- Hasinger et al. (1990) Hasinger, G., van der Klis, M., Ebisawa, K., Dotani, T., & Mitsuda, K., 1990 A & A, 235, 131
- Hasinger & van der Klis (1989) Hasinger, G. & van der Klis, M., 1989 A&A, 225, 79
- Kuulkers (1995) Kuulkers, E., 1995, PhD thesis, University of Amsterdam
- Kuulkers et al. (1997) Kuulkers, E., van der Klis, M., Oosterbroek, T., van Paradijs, J., & Lewin, W. H. G., 1997, MNRAS, 287, 495
- Kuulkers et al. (1994) Kuulkers, E., van der Klis, M., Oosterbroek, T., Asai, K., Dotani, T. van Paradijs, J., & Lewin, W. H. G., 1994, A&A, 289, 795
- Lang (1999) Lang, K.R. 1999, Astrophysical Formulae, Berlin: Springer.
- Middleditch & Priedhorsky (1986) Middleditch, J. & Priedhorsky, W., 1986, ApJ, 306, 230
- Osherovich & Titarchuk (1999a) Osherovich, V.A. & Titarchuk, L.G. 1999, ApJ, 522, L13
- Priedhorsky et al. (1986) Priedhorsky, W., Hasinger, G., Lewin, W. H. G., Middleditch, J., Parmar, A., Stella, L., White, N., 1986, ApJ, 306, L91
- Psaltis et al. . (1995) Psaltis, D., Lamb, F. K., & Miller, G. S., 1995, ApJ, 454, L137
- Psaltis et al. (1998) Psaltis, D., 1998, ApJ, 501, L95
- Sobolev (1975) Sobolev, V.V. 1975, Light Scattering in Atmospheres, Oxford: Pergamon
- Strohmayer et al. (1996) Strohmayer, T. E., Zhang, W., Swank, J. H., Smale, A., Titarchuk, L., Day, C., & Lee, U. 1996, ApJ, 469, L9
- Titarchuk et al. (2001) Titarchuk, L. G., Bradshaw, C. F. & Wood, K. S., 2001 submitted to ApJ
- Titarchuk & Osherovich (1999) Titarchuk, L.G. & Osherovich, V.A. 1999, 518, L95 (TO99)
- Titarchuk et al. (1999) Titarchuk, L., Osherovich, V., Kuznetsov, S., 1999, ApJ 525, L129 (TOK99)
- Titarchuk, Lapidus & Muslimov (1998) Titarchuk, L., Lapidus, I.I.,& Muslimov, A. 1998, ApJ, 315, 499 (TLM98)
- van der Klis (1995) van der Klis, M., 1995, in X-ray Binaries, eds. W. H. G. Lewin, J. van Paradijs, & E. P. J. van den Heuvel, (Cambridge U. Press)
- van der Klis et al. (1997) van der Klis, M., Wijnands, A.D., Horne, K. & Chen, W. 1997, ApJ, 481, L97 (VDK97)
- van der Klis et al. (1996) van der Klis, M. et al. 1996, ApJ, 469, L1
- Wood et al. (2001) Wood, K.S., Titarchuk, L.G., Ray, P.S. Wolff, M.T., Lovellette, M.N., Bandyopadhyay, R.M. (2001) submitted to ApJ
- Wu (2001) Wu, Xue-Bing, 2001, ApJ, in press
- Zhang et al. (1996) Zhang, W., Lapidus, I.I., White, N. E., & Titarchuk, L. G. 1996, ApJ, 469, L17