Chandra Detection of a Hot Gaseous Corona Around the Edge-on Galaxy NGC 4631
Abstract
We present a Chandra X-ray observation that shows, unambiguously for the first time, the presence of a giant diffuse X-ray-emitting corona around the edge-on disk galaxy NGC 4631. This corona, with a characteristic thermal temperature of – K, extends as far as 8 kpc away from the galactic plane. The X-ray morphology resembles the radio halo of the galaxy, indicating a close connection between outflows of hot gas, cosmic rays, and magnetic field from the galactic disk. Enhanced diffuse X-ray emission is apparently enclosed by numerous H-emitting loops blistered out from the central disk of the galaxy, as is evident in a comparison with our deep Hubble Space Telescope imaging.
1 Introduction
Though postulated more than four decades ago (Spitzer 1956), the existence of a hot ( K) extended corona around our Milky Way galaxy is still subject to debate. What limits our ability to understanding the corona around the Milky Way is our location in its midst. Given the expected characteristic temperature of degrees for this gas, soft X-ray emission is the primary tracer for the Galactic corona. However, the soft X-ray sky observed from our location within the Galaxy is very confusing due to the multiple origins of X-ray-emitting hot gas. Any extended Galactic corona, if present, is embedded between a nonuniform foreground, produced by the Local Hot Bubble around the Sun and various contributions from other nearby interstellar gas clouds, and an extragalactic soft X-ray background of an uncertain spectrum. Disentangling these components along a typical line of sight is extremely difficult, if not impossible.
The most direct way to study extended galactic coronae is to observe nearby edge-on disk galaxies. ROSAT observations of such galaxies have demonstrated that extra-planar X-ray emission is present in relatively normal spirals (NGC 891, Bregman & Houck 1997; NGC 4631, Wang et al. 1995). Such “normal” edge-on galaxies, in which star formation is not dominated by galactic nuclear regions, but extend over a large fraction of the galactic disk, are ideal for investigating general properties of galactic halos and their connections to galactic disks. The limited sensitivity and spatial resolution of ROSAT, however, did not allow for an unambiguous separation of diffuse emission from discrete sources, let alone a detailed study of morphology, ionization, and dynamics of hot gas.
In this Letter we report preliminary results from observations of the SBc/d type galaxy NGC 4631 with the Chandra X-ray observatory and the Hubble Space Telescope. This galaxy is ideal for studying soft X-ray emission from its galactic corona because of the very low Galactic foreground absorption () and its edge-on orientation with respect to the viewing direction. Active star formation is apparent throughout much of the NGC 4631 disk, apparently triggered by interactions with neighboring galaxies. Evidence for this interaction includes the presence of HI tidal tails (Weliachew, Sancisi, & Guelin 1978). Such active star formation is presumably a necessary condition for the heating of coronal gas.
2 Chandra Observation and Data Calibration
Our Chandra observation was carried out with the Advanced CCD Imaging Spectrometer chip S3 (ACIS-S3) at the focal plane of the telescope mirror. The spatial resolution of the observation before any smoothing is , corresponding to pc at the 7.6 Mpc distance of the galaxy. This superb resolution, together with the high sensitivity of the instrument and the long exposure ( ks), allows us to remove point-like sources and to directly probe the corona and its relation to other galactic components. We calibrated the data using primarily the software package ciao v2.1 with the latest calibration products (caldb version 2.3). We selected data only in the energy range of 0.3–7 keV. Particle background is greatly enhanced at higher energies, while the calibration of both the gain (uncertainties up to ) and quantum efficiency (up to ) of the detector are unreliable at lower energies. We excluded bad pixels, rows and node boundaries, and screened the data for high and low background times by clipping observation periods with an offset exceeding from the mean quiescent count rate (). This filtering led to the exclusion of 8% of the total counts and 6% of the total exposure time, resulting in a cleaned exposure time of 55.1 ks.
We further conducted both background subtraction and exposure correction of the data. We use deep (138 ks) blank-field background datasets with similar foreground absorption and identical focal plane temperature as our NGC 4631 observation to determine the position depended background rates. The same data filtering criteria were applied. We created bad pixel and node-boundary removed exposure maps in various energy bands. For the spectral analysis of extended X-ray emission, we constructed weighted instrument effective area and spectral response matrices, using a low-resolution (bin size ), 0.3–2.5 keV band image of diffuse emission in detector coordinates. The weighting corrects for variations (up to ) in the instrument sensitivity across the detector (e.g., effective area, gain, and quantum efficiency). It is important to note that the currently available instrument response matrices at low energies ( keV) employ various approximations, which may not be appropriate and may lead to underestimation of line strength. Since NGC 4631 fills nearly the entire ACIS-S3 field-of-view, we extracted the background from the same detector regions in the empty-field background observations described above as the source regions in the NGC 4631 observations.
3 Analysis and Results
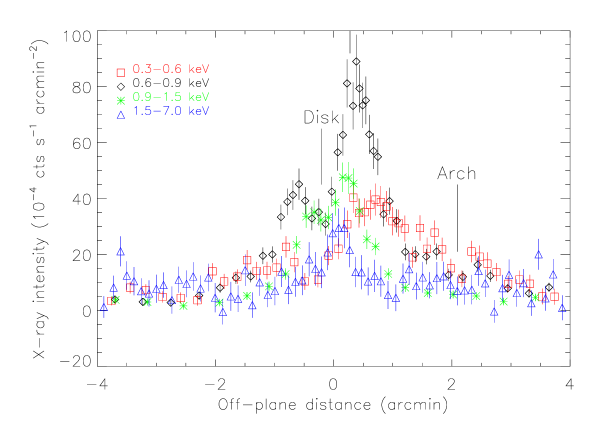
Chandra images in the soft and hard X-ray bands are presented in Fig. 1. Whereas there is little indication for extra-planar emission in the hard band, the enhanced emission in the soft band extends as far as 8 kpc away from the plane of the galaxy, preferentially towards the north. The diffuse emission becomes progressively more extended with decreasing energy (Fig. 2). The distribution of the low surface brightness emission is nearly symmetric, relative to the minor axis of the galaxy. This extra-planar soft X-ray emission clearly represents the corona of the galaxy.
We have conducted a preliminary X-ray spectral analysis of the corona. We extracted a point-source excised spectrum in a corona region 4′ wide and 25 high (cf. Fig. 2b). The spectrum in the 0.3–2 keV range can be characterized reasonably well (; Fig. 3) by a thermal plasma model with two temperature components: 0.18(0.16–0.20) keV and 0.61(0.48–0.71) keV. The jointly fitted metal abundance and absorption column density are 8(5–12)% solar and –, which is consistent with the expected foreground absorption. The uncertainties quoted in the parentheses are 90% confidence intervals. Assuming that the model is a reasonable characterization of the corona emission, we derive a conversion ratio of the emission measure (in units of ) to the observed count intensity () of 91 (27) for the low (high) temperature component. The average ratio of the low to high temperature emission measures is over the corona region. The low-temperature component dominates the outer corona (), whereas the high-temperature component becomes significant in regions close to the disk. The characteristic gas density and thermal pressure () are and K in the outer (inner) corona. The total luminosity of the corona is a few times in the 0.3–2 keV band; the uncertainty in the absorption correction is large. More careful analysis is required, especially in regions close the disk. Nevertheless, the amount of observed diffuse X-ray emission clearly accounts for only a small fraction () of the estimated energy input from supernovae in the galaxy (Wang et al. 1995).
The energy-dependent distribution of the diffuse X-ray emission is further illustrated in Fig. 4. The emission in the lowest energy range (0.3–0.6 keV) has the flattest distribution. The dip just below the galaxy’s major axis (), most prominent in lower energy bands, is caused by X-ray absorption from the galactic disk which is slightly tilted with its near side below the major axis. The dip at spatially coincides with a giant dusty arch discovered recently by Neininger & Dumke (1999). In fact, this arch seems to enclose the enhanced soft diffuse X-ray emission, approximately outlined by the outer white contour in Fig. 2a, in the northern central region of the galaxy.
4 Multiwavelength Comparison
Fig. 2b presents a morphological comparison of the diffuse X-ray and H emissions from NGC 4631. Whereas the H line emission represents primarily warm gas photo-ionized by stars, the soft diffuse X-ray emission arises in coronal gas. The coronal gas is distributed further out from the disk than the warm gas, although the galaxy might also have a very low surface brightness H-emitting halo, which may extend further out (Donahue, Aldering & Stocke 1995). The enhanced X-ray emission arises in regions containing coherent vertical H filaments, primarily in the upper central portion of the galactic disk. The left one quarter of the disk, though highly disturbed, does not show many vertical H filaments or much enhanced extra-planar diffuse X-ray emission.
This association between enhanced H/X-ray filamentary features appears most vividly in Fig. 5, which covers the inner region of the galaxy (cf. Fig. 2b). We obtained this deep H image using the Wide-Field Planetary Camera 2 (WFPC2) on board the Hubble Space Telescope (HST): eight orbits narrow-band imaging plus one broad-band continuum. The image shows numerous filaments emanating from the disk, mostly apparent in the upper-right part of the image. Such coherent loop-like features most likely represent “a froth of merged superbubbles”, which were created by massive star clusters, have broken out from the dense neutral gas of the disk, and are expanding into the halo (e.g., MacLow, McCray & Norman 1989; Norman & Ikeuchi 1989). The overall correlation between this froth and the enhanced diffuse X-ray emission is apparent. However, relatively bright loops do not seem to have a configuration with open tops, as one might expect in galactic chimney models. The prominent V-shaped double filaments, just above the large dark cloud near the center of the image, may not be an opened chimney and most likely represent walls of many projected loops. X-ray emission within the loops is generally enhanced by a factor of up to . Furthermore, the WFPC2 image reveals several bow-shaped filaments far away from the central plane of the galaxy. The largest and brightest one, as labeled as “Arc” in Fig. 5, “covers” the top of the V-shaped filaments. These H filaments may represent the illuminated edges of in-falling clouds, which could originate in cooled halo gas or in instabilities of the dusty arch.
The overall X-ray morphology of the corona (e.g., Fig. 1b) resembles the well-known radio halo of this galaxy (Hummel & Dettmar 1990), indicating a close link between outflows of hot gas and cosmic ray/magnetic field from the galactic disk. One scenario for the formation of such a radio halo is that hot gas draws magnetic fields (and cosmic rays) from the disk into the halo, before being ultimately confined by the magnetic field tension at large off-plane distances (Wang et al. 1995).
The unusually low metal abundance inferred from our spectral fit is apparently an artifact, which could be caused by the poorly calibrated instrument response shape below keV (§2) and/or by the overly-simplified spectral model we have assumed. A realistic temperature distribution should span a range, which tends to smooth out temperature-sensitive spectral features resulted from metal emission lines. While our spectral analysis provides an estimate of the temperature range, a realistic model is yet to be developed for a reliable measurement of the abundance. More importantly, however, the out-flowing gas may not be in an ionization equilibrium state (Breitschwerdt & Schmutzler 1999). We are currently conducting a spatially-resolved spectroscopic analysis of the Chandra data and are investigating a self-consistent dynamical and thermal plasma emission model.
Now with the corona around NGC 4631 firmly detected, one may naturally ask questions such as: does the extent of galactic coronae always coincide with the radio halos? Is the galaxy-galaxy interaction necessary to generate the coronae? Do properties of diffuse hot gas depend on the Hubble type of a galaxy? Ongoing and future observations with the Chandra and XMM-Newton X-ray observatories will allow us to answer these questions, leading to a better understanding of our own Galaxy as well as the structure and evolution of galaxies in general.
References
- (1) Bregman, J. N., & Houck, J. C. 1997, ApJ, 485, 159
- (2) Breitschwerdt, D., & Schmutzler, T. 1999, A&A, 347, 650
- (3) Donahue, M., Aldering, G., & Stocke, J. T. 1995, ApJ, 450, L45
- (4) Hoopes, C. G., Walterbos, R. A. M., & Rand, R. D. 1999, ApJ, 522, 669
- (5) Hummel, E., & Dettmar, R.-J. 1990, ApJ, 236, 33
- (6) MacLow, M. M., McCray, R., & Norman, M. L. 1989, ApJ, 337, 141
- (7) Neininger, N., & Dumke, M. 1999, Proc. Natl. Acad. Sci. USA, 96, 5360
- (8) Norman, C. A., & Ikeuchi, S. 1989, ApJ, 345, 372
- (9) Spitzer, L. 1956, ApJ, 124, 20
- (10) Wang, Q. D., et al. 1995, ApJ, 439, 176
- (11) Weliachew, L., Sancisi, R., & Guelin, M. 1978, A&A, 65, 37
Diffuse soft X-ray and H intensity distributions of NGC 4631. The Chandra image (a) is produced in the 0.3–0.9 keV band and discrete sources (marked by crosses) are excised. The ground-based H image (b) is reproduced from Hoopes et al. (1999). The X-ray contours are at 1.3, 2.5, 4.2, 6.6, 10, 15, 21, 31, . The rectangular box marks the region from which the corona spectral data in Fig. 3 was extracted, whereas the square box illustrates the location of the inner region shown in Fig. 5.

HST WFPC2 H image of the central region of NGC 4631 (Fig. 2b). High level X-ray contours in Fig. 2 are plotted and a few tentatively identified H-emitting loops are outlined in right-hand panel.