CONSTRAINTS ON A LOCAL GROUP X-RAY HALO
Abstract
A simple model for a hot Local Group halo is constructed, using the standard -model for the halo density and by choosing model parameters based on all available observations of X-ray emission in other groups of galaxies and on optical data on Local Group morphology. From the predicted X-ray intensities, total Local Group mass, and central cooling time of the halo, we derive very conservative upper limits on the central halo density and global temperature of cm-3 and keV, irrespective of realistic values of the density profile parameters and . A typical poor group value of requires keV and cm-3, from which it is concluded that the Local Group is very unlikely to possess a significant X-ray halo. The prospects for further constraining of halo parameters from UV absorption line observations are considered. We explicitly calculate the ability of the halo to distort the cosmic microwave background (CMB) in terms of the resulting CMB temperature variations and multipole anisotropies.
1 INTRODUCTION
It is well established Mulchaey et al. 1996b ; Mahdavi et al. (2000); Helsdon & Ponman (2000) that some groups of galaxies contain an X-ray emitting intragroup medium. Thus, one might also suspect the Local Group to possess hot, intergalactic gas. The significance of such a Local Group X-ray halo, however, has been a matter of debate, and it has even been suggested Suto et al. (1996) and subsequently rejected Banday & Gorski (1996); Pildis & McGaugh (1996) that this halo might influence the observed microwave background anisotropies through the Sunyaev-Zel’dovich effect.
Previous models of intergalactic gas distributed in a Local Group halo and/or its possible diffuse X-ray emission include those of Kahn & Woltjer (1959) and Oort (1970); Hunt & Sciama (1972); Suto et al. (1996), and related works by Banday & Gorski (1996) and Pildis & McGaugh (1996); Bland-Hawthorn (1999) and Maloney & Bland-Hawthorn (1999); Sidher, Sumner, & Quenby (1999); and a recent observational study by Osone et al. (2000).
Here we present a new model based on the standard -model for the density of halo gas, but with more realistic parameters for the gas and for the Local Group itself than previously presented in the literature. The choice of input parameters is based on recent optical observations of the Local Group as well as on all available X-ray observations of other groups and clusters of galaxies. We examine the constraints imposed on a Local Group X-ray halo by observations of the soft X-ray background, estimates of Local Group mass, and by the fact that the existence of a present-day hot halo requires it to be stable towards cooling over a significant fraction of the Hubble time .
The paper is organized as follows. In § 2 we present the model halo, with particular emphasis on its deviations from earlier models. In § 3 we discuss the observational (X-ray and optical) constraints on the model. Model results for X-ray intensities, gravitating mass, and cooling time scale are presented in § 4 and compared with observations in § 5, from which revised model parameters are extracted. Features of the new model, including its ability to absorb distant UV radiation and its effect on the Cosmic Microwave Background (CMB hereafter), are given in § 6, and conclusions are presented in § 7.
2 MODELLING THE LOCAL GROUP HALO
2.1 Density Profile
The Local Group Halo (LGH hereafter) is here assumed to be spherically symmetric, isothermal, and described by the standard -model of Cavaliere & Fusco-Femiano (1976),
| (1) |
where is the central electron number density, is radial distance, is the core radius, and is a dimensionless parameter. This gas profile provides a good fit to the X-ray emission of galaxy groups and is therefore often assumed for the spatial distribution of gas in groups with an X-ray-detectable intragroup medium Mulchaey et al. 1996b ; Helsdon & Ponman (2000).
While presenting our model of the LGH, we will briefly recapitulate important characteristics of previous models and the associated results. In this context, the first three papers mentioned in § 1 should be treated separately. It suffices to mention that Kahn & Woltjer (1959) suggested a homogeneous temperature and density of Local Group intergalactic gas of keV and cm-3, respectively. In their model, and in that of Oort (1970), this gas is required to dynamically stabilize the Local Group, but the argument is based on the then known masses of M31 and the Galaxy of % of the currently accepted values. Hunt & Sciama (1972) estimate the LGH temperature and density to be keV and cm-3 from the now obsolete assumption that the observed soft X-ray background at keV could largely arise from an enhancement of X-ray emission from the LGH gas due to the gravitational influence of the Galaxy moving through this intergalactic gas.
Newer models all assume the X-ray halo to be spherically symmetric and isothermal, and all assume in equation (1), with the exception of Sidher et al. (1999) who assume an -behavior, where is the distance along the line of sight. We note, however, that while appears to be representative of clusters of galaxies (e.g., Jones & Forman 1984), poor groups tend to have shallower gas profiles, with Mulchaey et al. 1996b ; Dahlem & Thiering (2000); Helsdon & Ponman (2000), which will thus act as our initial model value. Regarding the other density structure parameter, , Suto et al. (1996) use kpc as does Bland-Hawthorn (1999), while Maloney & Bland-Hawthorn (1999) consider the range . Banday & Gorski (1996) and Osone et al. (2000) only restrict themselves to core radii smaller than the distance from the observer to the LGH center. For a relatively poor group like the Local Group, a value of kpc (again typical of clusters) seems rather large when viewed in light of observational results on other groups (Mulchaey et al. 1996b; Pedersen, Yoshii, & Sommer-Larsen 1997; Dahlem & Thiering 2000). In contrast, Pildis & McGaugh (1996) choose kpc, which appears more reasonable as a starting point. Finally, for the central density , values both above and below cm-3 have been used in LGH models. Typical gas densities in clusters are of this magnitude, which may therefore apply also to the central parts of groups, as confirmed by the results of e.g., Davis et al. (1995), and Dahlem & Thiering (2000). Hence, this value of is initially implemented in our model.
2.2 Temperature
From X-ray observations of other poor groups of galaxies, intragroup plasma temperatures for groups containing at least one elliptical galaxy are typically inferred to be keV Mulchaey et al. 1996b ; Tawara et al. (1998); Davis et al. (1999); Helsdon & Ponman (2000), which is also the value used in the models of Suto et al. (1996) and Pildis & McGaugh (1996). A more obvious choice for a LG model would be the virial temperature of any hot Local Group medium. Strictly defined, , where is the 3-D velocity dispersion of ions in the halo gas, is the proton mass, and is the mean molecular weight in amu. Using the radial velocity dispersion of Local Group galaxies of km s-1 van den Bergh (2000), we obtain keV. On the other hand, according to Maloney & Bland-Hawthorn (1999) and to the result that would be obtained for by Mulchaey et al. (1996b) using the above value of , keV. Thus, the model constraint of cm-2 of Maloney & Bland-Hawthorn applies at keV. However, since any estimate of the virial temperature is based on a number of assumptions, in particular that the the velocity ellipsoid of the galaxies is isotropic, and that the typical ion velocity is comparable to that of the galaxies, it is instructive to consider a range of realistic temperatures for a hot Local Group halo (the former assumption has for example not yet been justified for Local Group galaxies). Further, due to the pronounced substructure exhibited by the Local Group luminous mass, may not be a reliable estimator of the Local Group gravitational potential, and hence, virial temperature. Therefore, we will consider all temperatures in the range to keV, i.e. on the order of the above virial temperature and up to a value representative of poor groups with an X-ray detectable intragroup medium. Although the Local Group does not contain any major elliptical galaxies (the only elliptical being the E2 dwarf M32 with a -magnitude of as compared to, e.g., the Small Magellanic Cloud with ; van den Bergh 2000) we will, however, as a starting point use the above mentioned typical group temperature of keV.
2.3 Metallicity
Regarding the metallicity of halo gas, is used in all previous models when modelling the LGH X-ray emission Suto et al. (1996); Osone et al. (2000), although Maloney & Bland-Hawthorn (1999) also consider and . The value , however, is typical of clusters and rich groups of galaxies (e.g., Hwang et al. 1999) whereas poor low-temperature ( keV) groups tend to have somewhat lower metallicities, possibly because their gravitational potentials are too shallow to retain all the enriched ejecta of the constituent galaxies Tawara et al. (1998); Davis et al. (1999); Hwang et al. (1999). This view is supported by the gas-to-total-mass ratios of such groups being lower than in rich groups and clusters David et al. (1995); Renzini (1997). As the LG is certainly a relatively poor group, for the LG gas seems more reasonable. This upper limit on will henceforth be adopted as our model value.
2.4 Observer Position
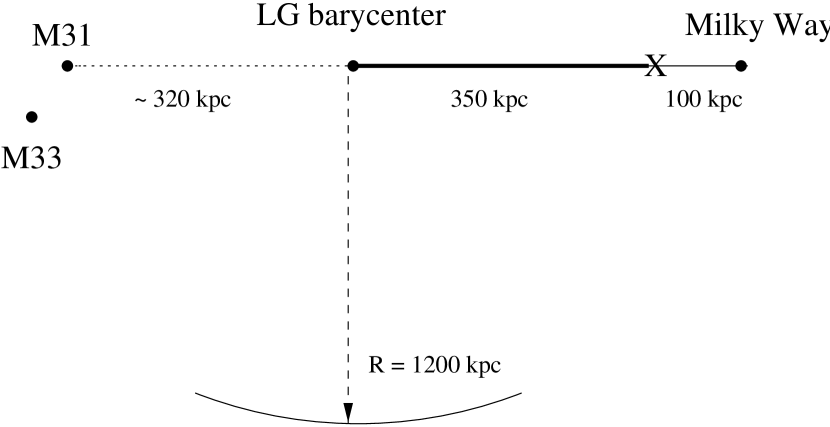
A final vital parameter is the distance from the observer to the LGH center. Suto et al. (1996) use when modelling the halo X-ray emission, and claim on the basis hereof that the LGH may contribute a non-negligible part to the low-energy ( keV) X-ray Background, but without taking into account Galactic foreground absorption. They use kpc, when estimating the upper limit on the LGH-induced Sunyaev-Zel’dovich effect in COBE data. This value is also adopted in the model of Sidher et al. (1999), while Maloney & Bland-Hawthorn (1999) again consider the entire range . We may, however, obtain a realistic estimate of through the following considerations. Morphologically the Local Group exhibits a bimodal spatial structure in the optical, consisting of the M31 and Milky Way subgroups. As these two subsystems account for the large majority of Local Group mass (Zaritsky 1994, 1999; Mateo 1998; Courteau & van den Bergh 1999), the Local Group Barycenter (LGBC hereafter) should be situated close to the line connecting M31 and the Milky Way, i.e. in galactic direction (, with a possible, however small, offset towards M33 at (. Here we will identify the center of the Local Group halo with the LGBC, taken to be in the direction of M31 (see Figure 1 for a schematic view of the assumed Local Group geometry). The distance to M31 appears to be rather well-determined to 0.76–0.78 Mpc Karachentsev & Makarov (1996); Stanek & Garnavich (1998); van den Bergh (2000). Thus, choosing kpc implies that the Milky Way subgroup should be more massive than that of M31. However, Zaritsky (1999) applies the simple timing argument of Kahn & Woltjer (1959) to infer a mass ratio of 1.5 for the M31–Milky Way pair. Van den Bergh (2000) uses this ratio together with a distance to M31 of 0.76 Mpc to suggest a value of kpc for the distance to the LGBC. This value is adopted here for , which is 100 kpc larger than typically assumed in previous LGH models. The inclusion of M33 in this estimate only serves to widen the gap between this and previous models.
The model halo is cut off at the zero-velocity surface separating the gravitational contraction of the LG from the Hubble expansion. This is estimated by Courteau & van den Bergh (1999) to Mpc, based on which we here take kpc, which is also the radius to which reliable dynamical mass estimates of the LG are obtainable Zaritsky (1994).
2.5 X-ray Emission and Absorption
For the model plasma, intensity calculations are done by means of the meka emissivity code (Mewe, Gronenschild, & van den Oord 1985; Mewe, Lemen, & van den Oord 1986) in a revised version last updated 1991 by J.S. Kaastra. To compare model results with X-ray background (XRB hereafter) measurements, the ROSAT or ASCA energy resolution should be used in the code. The ROSAT PSPC energy resolution approximates (FWHM) over the entire detector area, i.e. keV at keV, while the corresponding ASCA GIS resolution is , i.e. keV. In the calculations the better ASCA resolution is used, but note that ASCA 1 keV model intensities are % higher than those of ROSAT at keV (for a plasma with ), and in the range keV there is even a factor of 2 difference, with ROSAT model intensities being the largest.
Regarding the effects of absorption, the neutral hydrogen column density in the direction of M31 is cm-2 Stark et al. (1992). However, conservatively selecting a field of interest of centered on M31 (this will be justified in § 3), we expect maximal absorption within this field to occur closest to the Galactic plane, where cm-2. Using this value along with the absorption cross section of Morrison & McCammon (1983), we find a maximal absorption in the selected field of % at keV. This is comparable to computational (as shown above) and observational (see § 3) uncertainties on the 1 keV XRB intensity, even using this conservative absorption estimate. Since we will further apply a conservative upper limit on the XRB normalization in § 3, we will for these reasons neglect absorption in the following.
2.6 Model Summary
To provide a starting point, a set of “reference values” is chosen as initial input parameters for the halo gas. Based on the above discussion, we take the initial plasma parameters to be cm-3, kpc, , , and keV, with kpc and kpc. We stress that these parameters are selected based on all available X-ray observations of other groups of galaxies as well as corresponding cluster observations and optical observations of Local Group galaxies.
3 OBSERVATIONAL CONSTRAINTS
Recent observations of the XRB have been performed both in the form of pointed observations, mainly in directions with low Galactic absorbing column density, and in the form of the ROSAT All-Sky Survey. After correction for Galactic absorption, the spectral shape of the extragalactic XRB in the keV energy range is well fitted by a power-law, , with a spectral normalization at keV of keV cm-2 s-1 sr-1 keV-1 inferred from pointed observations (e.g., Garmire et al. 1992; Chen, Fabian, & Gendreau 1997; Miyaji et al. 1998; Vecchi et al. 1999).
For our LGH model we expect the largest intensities in the direction of the adopted LGH center, towards M31 at . M31 itself has an angular extent of , and most previous X-ray studies in directions towards M31 have aimed at detecting and classifying discrete sources or regions within the galaxy and have therefore been limited to comparatively small fields. We note, however, that for an isothermal bremsstrahlung model LGH with our model values, the halo intensity has fallen to 25% of peak value already at from the direction to the halo center. Since the disk (West, Barber, & Folgheraiter 1997) and bulge (Primini, Forman, & Jones 1993) of M31 are themselves sources of diffuse soft X-ray emission (although the fraction of bulge emission attributable to hot gas is still debated, see, e.g., Irwin & Bregman 1999; Borozdin & Priedhorsky 2000; Primini et al. 2000; Shirey et al. 2000), emission from a LGH centered directly in front of M31 would thus be hard to disentangle from the combined emission of M31 and the extragalactic XRB. Since any search for non-galactic diffuse X-ray emission associated with the LGH at positions close to M31 will necessarily be hampered by emission from M31, and since the LGH center may be slightly offset from the direction of M31 with some unknown amount, this suggests that searching for any direct evidence of LGH emission should be done in a field of several tens of square degrees.
The ROSAT all-sky maps of Snowden et al. (1997) in the R6 ( keV) band do not show clear signs of degree–scale excess extragalactic diffuse emission in a field of centered on M31, however. These all-sky maps have been removed of point sources to a uniform flux level for which the original survey source catalog (RASS-I) was complete over 90% of the sky. To obtain a qualitative picture of the amount of any excess 1 keV emission towards M31, we resampled the original “point source–removed” by image centered at () into pixels of at each side, smoothed it with a box of pixels, and added the photon count rates at each longitude in the resulting image within a latitude bin centered at . Again, the result shows no evidence of excess diffuse emission within a field centered on M31 as compared to other fields at similar latitude. Centering the strip at instead, to include the latitude of M33 and the region covered by Osone et al. (2000) (see below), does not change this conclusion.
A recent, much more detailed investigation by Osone et al. (2000), to our knowledge the first one to be carried out with the distinct purpose of constraining LGH parameters from direct observations of associated X-ray emission, concentrated on 4 neighboring ASCA GIS pointings centered approximately south of M31 (i.e. a few degrees off the line connecting M31 and M33 as seen from the Sun). For reference purposes spectral data for a region close to the North Galactic Pole was used. From fits to the observed spectra the authors find no evidence of any soft (0.6-2 keV) excess flux in these directions relative to the general XRB as represented in their reference direction. They place an upper limit on this excess flux of erg cm-2 s-1 sr-1 between 0.6 and 2 keV, from which they conclude that cm kpc by modelling the LGH plasma with a -model of and its emission with a Raymond-Smith plasma code of and keV. An important point about the result of Osone et al. is that although their pointing direction ensures reasonably low Galactic absorption and minimization of M31 contamination, the sky coverage is limited to deg2. Thus, they may very well have missed the true LGH center by a few degrees, implying a possible underestimation of the upper limit on the quantity . From the result of Osone et al., and from our own quick-look analysis mentioned above, we infer typical unabsorbed intensities in the LGBC direction not to be in significant excess of 12 keV cm-2 s-1 sr-1 keV-1. Neglecting absorption, this value will thus be invoked initially as a maximally allowed model normalization to constrain possible LGH parameter combinations. Note that we hence allow the halo to be solely responsible for the observed intensities in the relevant direction. This should yield conservative limits on halo parameters.
In order to further constrain parameters, the central cooling time scale of the LGH plasma will also be considered. For the LGH to exist and be reasonably stable towards cooling, we take the condition with Gyr. If this cooling stability criterion is not fulfilled, the LGH would have cooled substantially during its lifetime, in which case there would hardly be any present-day hot halo of the LG. This scenario is entirely plausible, but since we want to pinpoint the present upper limits on central density and temperature of the halo, we should require the model halo not to have cooled away, i.e. be moderately stable towards cooling. Alternatively, the cooling gas would need to be replenished as also noted by Bland-Hawthorn (1999). As there are no galaxies within the central kpc of the LGBC and since Local Group dynamics Peebles (1990); Zaritsky (1994) indicate that the M31–Galaxy pair is approaching each other for the first time, standard mechanisms like galactic winds or ram pressure stripping would seem incapable of providing the required additional X-ray gas to a cooling central halo region.
4 MODEL RESULTS
Figure 2 presents results for X-ray intensities as calculated by means of the meka code, with two parameters fixed at their reference values (given in § 2) and two parameters allowed to vary. Parameters inferred from optical observations ( and ) remain fixed. Following Osone et al. (2000), temperatures up to 1.2 keV are considered. We restrict ourselves to considering a photon energy of keV, as most XRB normalizations are given at this energy.
The cooling time scale can be calculated given some cooling function . Following Mushotzky (1993), we here invoke the relativistically corrected Raymond-Smith cooling curve of Gehrels & Williams (1993). Noting that this has a minimum of ergs cm3 s-1 in the soft X-ray regime ( K), corresponding to a maximum in cooling time, we find
| (2) |
as an upper limit on the actual cooling time. In Figure 3, is plotted against and over the range within which equation (2) is valid.
Assuming our model LGH to be in hydrostatic equilibrium, we can also calculate its total gravitating mass residing within some radius . If the LGH gas is supported against gravity solely through a thermal pressure given by the perfect gas law, one finds
| (3) |
for a gas distribution with mass density (eq. [1]), mean molecular weight , and with being the proton mass (Fabricant, Lecar, & Gorenstein 1980). In Figure 4, within the adopted cut-off radius of kpc is plotted against and , assuming (primordial abundances). Notice that only and remain free parameters because is independent of for a -model gas distribution, and the results obtained from Figure 4 are insensitive to the choice of , as we will see in the next section.
5 DISCUSSION
Applying the conservative assumption that the modelled intensities should not exceed the limit set by observations of the XRB, halo parameter combinations can be constrained from Figure 2. Figure 2a shows that for , cm-3 is required. Alternatively, implies keV. Figures 2c–2e show that for a realistic upper limit on of , either keV, kpc, or cm-3 is required. Figures 2b and 2f show that choosing kpc implies either keV or cm-3. We thus see that realistic choices of and strongly hint at either , , or both being too large. Although model intensities are thus incompatible with XRB observations, no firm constraints can be put on halo parameters without further assumptions.
More restrictive is the information that can be extracted from Figures 3 and 4. Our cooling stability requirement () restricts to above 0.1 keV for all cm-3 (Fig. 3). At we require keV, while fixing at implies cm-3. Both possibilities were ruled out above, but a stronger constraint on , however, is provided by taking into account the estimated LG gravitating mass (Fig. 4). Even assuming a conservative upper limit of , Figure 4 shows that cannot exceed 0.5 keV for reasonable values of , i.e. (0.6 keV for ). As this result is independent of , we subsequently conclude from Figure 3 that cm-3. This conclusion is unaffected by any choice of kpc, a core radius typical for clusters of galaxies. Given our assumptions, and is thus required for all . Notice moreover the very important fact that we are actually being conservative in two senses, since we take the LG mass to be and at the same time allow to be as small as . Strictly requiring as representative of observed poor groups actually implies keV from Figure 4, which by means of Figure 3 translates into cm-3. This result applies within kpc. For comparison with previous models we also note that implies keV with the same density constraint.
We note for completeness that although little evidence for radial plasma temperature declines in intragroup media is present Mulchaey et al. 1996b ; Pildis & McGaugh (1996); Pedersen et al. (1997), the impact hereof in our model would be to lower the above mass estimate and thereby loosen the constraints on and the central temperature . Assuming, e.g., , we require at for to be , corresponding to a factor in temperature decrease from halo center to cut-off radius. We also note that numerical simulations of clusters of galaxies show that mass estimates by means of the general equation (3) are reasonably robust towards deviations from hydrostatic equilibrium and spherical symmetry Schindler (1996). Other cluster simulations (Evrard, Metzler, & Navarro 1996) further show that if using an isothermal -profile with equation (3), the resulting mass estimator — applied here — is nearly unbiased, showing a standard deviation % for the region within which the estimated overdensity of the halo is . For a present–day halo of the initial model parameters, this range corresponds to Mpc, assuming km s-1. Thus, while the result of Evrard et al. (1996) may not directly support our conclusion, it at least suggests that our very conservative choice of Local Group mass and of allowed range of –values ensures that our limit on is both reasonable and firm.
6 A REVISED MODEL
Investigating model properties with the down-scaled values of cm-3 and keV as determined in § 5, this section considers the resulting model intensities, the prospects for detecting UV absorption lines from the halo gas, and the effect of the halo on the CMB.
6.1 X-ray Intensities
To examine whether halo parameters can be constrained any further, we again plot model intensities towards M31, now using the derived upper limit on and as input values while maintaining the value of remaining parameters. We emphasize once more that at this temperature, ASCA model intensities are only % those of ROSAT, the exact fraction depending on the choice of . We now also apply a more realistic but less conservative value for the allowed model intensities, based on the fact that at least % of the 0.5–2 keV cosmic XRB in the direction of the Lockman Hole has been resolved into discrete sources Hasinger et al. (1998) (the term cosmic here referring to the emission originating outside the Local Group). Hence, allowing for model intensities of 12 keV cm-2 s-1 sr-1 keV-1 is perhaps a too conservative approach, since most of this 1 keV intensity would surely originate outside the Local Group. We henceforth adopt a model normalization of 50% of the initial value, i.e., 6 keV cm-2 s-1 sr-1 keV-1. Even in the presence of small variations in the cosmic XRB over the sky, this should still be a conservative estimate.
Model results are shown in Figure 5, including the initial (12 keV cm-2 s-1 sr-1 keV-1 — dashed line) and revised (6 keV cm-2 s-1 sr-1 keV-1 — dotted line) XRB limits on model intensities. Given the adopted values of and , Figure 5a shows that for our revised model intensity normalization either or has to be scaled down at least a further % to be compatible with observations. Figures 5b and 5f show that kpc requires keV or cm-3, while fixing and at their upper limits implies kpc. Figures 5c–5e show that for a low-end value of (inferred for some groups), either keV, cm-3, or kpc follows. Finally, Figure 5d shows that all realistic values of require kpc. Thus, we cannot “save” the model by invoking a steeper halo density distribution without at least also decreasing the model core radius. As kpc is already a rather small value compared to that derived for many other groups, this suggests that our upper limits on or should be further decreased. Conclusively, the model is now marginally consistent with the 1 keV normalization of the XRB but inconsistent with our revised intensity requirement, the reason probably being that both temperature and central density still exceed the actual values. Further narrowing in on the model halo parameters is, however, not feasible in terms of resulting X-ray intensities. From better estimates of the XRB intensity (in particular the fraction of which is of non-cosmic origin) towards the LGBC, more precise —and perhaps stronger— constraints could be easily put forward.
6.2 Prospects for UV Detection
As is apparent from the previous discussion, the direct detection of X-ray emitting gas associated with a Local Group halo is exceedingly difficult. Since many galaxy groups dominated by spiral galaxies, such as the Local Group, could possess gas so cool and tenuous that it has yet escaped X-ray detection, it is natural to investigate whether such gas would be detectable at longer wavelengths, e.g. below the ROSAT frequency limit of keV (i.e. Å). Specifically, at the relevant temperatures for Local Group gas ( keV), some line emission as well as absorption of externally originating radiation is expected to occur in the far- and extreme-UV bands, some of which, at least in principle, would be detectable with the Far Ultraviolet Spectroscopic Explorer (FUSE, covering the range Å), and the Space Telescope Imaging Spectrograph (STIS, covering a far-UV range of Å) aboard the Hubble Space Telescope. In addition to our model results so far, detecting such lines from LGH plasma could also provide potentially useful constraints on the LGH, the prospects of which will be briefly considered in the following.
At the relevant plasma temperatures, and apart from lines of neutral hydrogen, FUSE has the ability to observe the O vi resonance doublet at rest-frame wavelength , while the HST STIS can observe the doublets of N v and C iv at and , respectively. Considering absorption, the O vi doublet is the most interesting for our purposes, as it is expected to be the strongest metal line. In addition, in the wavelength range covered by FUSE and HST/STIS, O vi is the ion species least likely to be produced by photoionization, making it a prime indicator of collisionally ionized plasma. The possibility of detecting —in the far-UV spectra of distant active galactic nuclei and quasars— these and other higher-ionization absorption lines induced by gas in other spiral-dominated groups has been discussed by Mulchaey et al. (1996a). In addition, AGN/QSO far-UV absorption lines have also been used extensively to study the amount and spatial distribution of O vi and other ions and atoms in the Galactic halo from FUSE Oegerle et al. (2000); Savage et al. 2000a and HST Savage et al. 2000b observations. Even extragalactic features such as the Magellanic Stream and certain high-velocity clouds (HVC’s) have been investigated in this manner Sembach et al. (2000), indicating the potential of the method for LGH studies.
Although largely attributed to the Galactic interstellar medium and halo, some component of the observed O vi absorption profiles and derived column densities could principally contain a contribution from LGH gas, despite the fact that this line is most prominent in relatively cool gas ( keV). To investigate this, we plot in Figure 6 the model halo value of O vi column density O vi) for a few combinations of , , and as a function of distance from the adopted LGH center. Model predictions are calculated using a Raymond-Smith (1977; this version last updated 1991 by J.C. Raymond) plasma code, and also plotted are observationally deduced column densities. These include the (presumably mainly Galactic) values derived by Savage et al. (2000a) by considering the low–velocity portion of absorption line profiles found along 11 lines of sight, and the values of Sembach et al. (2000) who correspondingly considered the high–velocity part of these profiles (velocities km s-1, if present) and were able to relate this high-velocity gas to H i HVC’s in six of the seven high-velocity cases (meaning that their derived column densities in these cases are extreme upper limits to the presence of high-velocity gas in the Local Group in these directions).
Firstly, we note that although the modelled column densities vary by a factor of across the sky, the data points in Figure 6 do not show any systematic variation with separation from the adopted LGH center, suggesting that they do indeed reflect mainly Galactic values. Further, the revised model halo ( keV, , cm-3) has not been included in the plot, as it lies some 4 orders of magnitude below the low-value data points determined from observations. Although this is not surprising in light of the previous conclusion, we initially invoke the extremely conservative requirement that O vi) of the LGH should not exceed observed values. Obviously, for all keV (given that is a likely extreme upper limit on halo metallicity), no further constraints can then be readily imposed on the model. Only for temperatures below this value it is possible to rule out certain combinations of and for fixed and . For instance, at the naively estimated virial temperature of the halo of keV (§ 2) it would be possible to constrain by a factor of a few. At keV, the O vi abundance peaks, but a “hot” LGH at this temperature would need a very low central density in order to fulfill our cooling stability requirement, in particular for large values of . The fact that even a single data point is close to this hypothetical upper O vi limit in Figure 6 lends further support to the assertion that the O vi absorption is primarily Galactic.
We are thus immediately led to conclude that any attempt to use the observed O vi column densities as a further constraint on LGH parameters would require the halo temperature to be within the low and rather narrow range of keV. Realistically, of course, the assumption that the observed (O vi) is entirely attributable to an LGH should be relaxed. However, given that a redshift of zero is determined for the absorbing gas, a large fraction of the observed absorption must at first be unambiguously assigned to the Galaxy in order to subsequently isolate and quantify the extragalactic contribution. The crucial problem in this context is the difficulty of obtaining an independent distance estimate for the gas in order to discriminate between the contributions from various absorbing layers along the line of sight (e.g., the Galactic interstellar medium and halo, the LGH, HVC’s). As noted by Mulchaey et al. (1996a), the thermal broadening of the lines (as reflected in the width of the Gaussian portion of the line profile) is probably insufficient as a discriminator, since gas in the Galactic halo could display temperatures similar to those discussed here for the LGH. Disentangling the contributions of multiple absorbers to the line width would also —at least— require the lines to be fully spectrally resolved, which is probably at the limit of FUSE capability. Yet another possibility in the context of O vi would be to map the entire sky at far-UV wavelengths to determine the distribution of O vi emission from gas in the Galactic halo. Since any O vi emission from the LGH would be almost entirely absorbed in the Galaxy, such a survey would primarily probe the O vi content of the Galactic disk and halo, allowing an estimate of the purely Galactic column densities. Subtracting this from observed O vi absorbing column densities, to which the LGH expectedly contributes, could provide an upper limit in any given direction on the contribution to the O vi column density exterior to the Galaxy. At present, only a few firm results on O vi emission are available from individual pointings, including those of Dixon et al. (2001) and Shelton et al. (2001). However, a far-UV all-sky survey using spectral imaging with arcminute spatial resolution is exactly among the goals of the proposed SPEAR mission (Spectroscopy of Plasma Evolution from Astrophysical Radiation; Edelstein, Korpela, & Dixon 2000).
We note that the strong H i lines expected from a relatively cool collisionally ionized plasma in the FUSE–HST/STIS wavelength regions also provide a potentially powerful tool for estimating LGH column densities. Savage et al. (2000b) present measurements of the H i Ly absorbing column density in the Galactic disk and halo toward 14 QSOs at various Galactic latitude . They find an average value of (H i, Ly) cm-2, in reasonable agreement with H i cm emission estimates. This easily supersedes the values expected from our model LGH, which even at temperatures as low as 0.01 keV only displays a H i column density of cm-2 towards the LGBC, making it virtually impossible to place further constraints on, e.g., using this approach.
At higher and perhaps more relevant temperatures, other species producing strong line doublets, such as Ne viii, Mg x, or Si xii, could be considered instead. Our revised model predicts central column densities for these ions of , , and cm-2, respectively (increasing nearly two orders of magnitude for Ne viii and Mg x and a factor of for Si xii, if the temperature is lowered to 0.1 keV at the same ), but their lines all fall in the rest–frame wavelength range of Å (see, e.g., Verner, Tytler, & Barthel 1994), making them unobservable with FUSE or HST/STIS. The Extreme Ultraviolet Explorer (EUVE) covered this wavelength region (with a spectral resolution Å for Å) as did the BEFS spectrometer aboard the ORFEUS/SPAS space shuttle missions (resolution Å between 400 and 900 Å; Hurwitz & Bowyer 1996). To our knowledge, however, estimates from these missions on the absorption line widths or column densities of the three ions species of interest are not available and would for our purpose in any case suffer from the same potential systematics as in the O vi case, although perhaps to a lesser extent. In summary, it does not appear to be feasible to impose further constraints on a Local Group X-ray halo by applying available UV absorption line data. A more detailed account of the amount, distribution, and chemical composition of Galactic gas in various directions is required for this approach to be fruitful.
6.3 Distortion of the CMB?
The presence of a Local Group halo is expected to affect the CMB through the Sunyaev-Zel’dovich effect. The topic has previously been discussed by Suto et al. (1996), Banday & Gorsky (1996), Pildis & McGaugh (1996), and Osone et al. (2000), specifically in terms of the induced quadrupole anisotropy.
We may quantify the effect either in terms of the temperature decrements seen in given directions relative to the CMB temperature , or by the all-sky multipole anisotropies imprinted on the CMB by the halo. Beginning with the former approach we have
| (4) |
where
| (5) |
is the Compton -parameter. Here is the electron temperature, is the length of line of sight through halo gas, is the Thomson electron scattering cross section (with the classical electron radius), and (with the frequency of radiation). From this, the largest temperature decrement as seen towards the adopted LGBC is only K at GHz. This effect is too small to be observable, let alone clearly identifiable, in any of the CMB maps of Bennett et al. (1996) based on COBE DMR data.
It was suggested by Suto et al. (1996) that the LGH could induce a quadrupole anisotropy in the CMB comparable to that seen be COBE, 4 K K (95% confidence; Kogut et al. 1996). Following the approach of Suto et al. we expand the CMB temperature variations in spherical harmonics to derive the LGH–induced monopole (), dipole (), and quadrupole () anisotropies, imprinted on the CMB by a density distribution of the form of equation (1). For our spherically symmetric halo, this expansion becomes
| (6) |
Here measures the angular distance from the halo center, while are ordinary Legendre polynomials. The are computed in the Rayleigh-Jeans regime using Suto’s equation (5),
| (7) |
by means of the electron column density , which for a -profile is
| (8) |
with all parameters defined above. The latter integral can only be evaluated numerically, except in the case , ( …). The multipoles are subsequently found from the identity
| (9) |
which is Suto’s equation (6). Results for the anisotropies induced by the initial and revised models are presented along with the corresponding COBE values in Table 1.
It is obvious from Table 1 that model-induced anisotropies are far smaller than those measured by COBE. In particular, varying anywhere in the interval 20–450 kpc at most increases by a factor of 10 which is still three orders of magnitude below the COBE value. It thus appears exceedingly unlikely that a LGH should contribute measurably to the CMB quadrupole seen by COBE. This conclusion is in quantitative agreement with that of Osone et al. (2000) and consistent with the results of Pildis & McGaugh (1996) and Banday & Gorski (1996).
7 CONCLUSION
We can briefly summarize the conclusions as follows:
1) The modelled Local Group halo emission is very localized in
the sky, suggesting that
a LGH centered in the direction of M31 would be hard to distinguish
observationally from the combined emission of M31 and the extragalactic
X-ray background.
2) Applying typical values of morphological and physical parameters of
hot gas observed in other groups, the modelled intensities exceed those
allowed by observations of the X-ray background.
3) Estimates of Local Group mass strongly suggest a temperature
keV for an
isothermal halo in hydrostatic equilibrium. Within this temperature range,
the stability of the halo against significant
cooling requires a central density cm-3. These
values apply regardless of the values of -profile parameters
and , but resulting X-ray intensities then require kpc.
A typical poor X-ray group value of
requires keV and cm-3.
For kpc, this density constraint is more restrictive than the
(possibly underestimated) keV constraint on of Osone
et al. (2000),
even though a shallower halo density profile is assumed here.
4) Using the derived conservative upper limits on and
of cm-3 and 0.5 keV, respectively,
resulting X-ray intensities are marginally consistent with the 1 keV
normalization of the X-ray background. Taking into account the fact that
the majority of the 1 keV background is comprised of individual sources at
cosmic distances, model results suggest that the upper limit on or
should be decreased at least by %. An observational estimate
of the non-cosmic background seen towards the Local Group barycenter could
sharpen the constraints on halo parameters even further.
5) The possibility of deriving further constraints on halo parameters from
the ability of the halo to produce absorption lines in the far-UV spectra of
quasars is severely restricted to the case of halo temperatures keV,
given currently available data on UV absorption lines and the absence of a
general method for estimating the distance to the absorbing gas.
6) The effect of the model halo on the Cosmic Microwave Background is entirely
negligible, both in terms of induced absolute CMB temperature variations and
in terms of multipole anisotropies.
Of course, a true Local Group halo may be neither spherical, isothermal, or in hydrostatic equilibrium. But (1): We use a conservative upper Local Group mass estimate, more than twice the largest value derived from recent observations; (2): The Local Group galaxy distribution is indicative of significant mass subclustering, with little luminous mass associated with the central kpc. That is, may be even lower than our estimates suggest, and we therefore believe that our limit on is rather firm. Further, the inference of a relatively low halo temperature is in accordance with estimates of the Local Group virial temperature as derived from the galaxy velocity dispersion. Conclusively, it therefore appears unlikely that the Local Group should possess any significant X-ray halo. We note in passing that the integrated 0.1-2.0 keV luminosity of the model halo is erg s-1 ( erg s-1 for 0.5-2.0 keV), which is lower than typical X-ray luminosities inferred for X-ray groups of galaxies and also lower than typical upper limits inferred for groups not detected in X-rays with ROSAT or ASCA Mulchaey et al. 1996b . Thus, we would not expect groups like the Local Group to have been detected by these satellites. This is consistent with the current observational status on small groups of galaxies Zabludoff & Mulchaey (1998); Zabludoff (1999).
References
- Banday & Gorski (1996) Banday, A. J., & Gorski, K. M. 1996, MNRAS, 283, L21
- Bennett et al. (1996) Bennett, C. L., et al. 1996, ApJ, 464, L1
- Bland-Hawthorn (1999) Bland-Hawthorn, J. 1999, in Looking Deep in the Southern Sky, Proceedings of ESO/Australia Workshop, ed. R. Morganti, & W. Couch (Berlin: Springer-Verlag), 91
- Borozdin & Priedhorsky (2000) Borozdin, K. N., & Priedhorsky, W. C. 2000, ApJ, 542, L13
- Byrd et al. (1994) Byrd, G., Valtonen, M., McCall, M., & Innanen, K. 1994, AJ, 107, 2055
- Cavaliere & Fusco-Femiano (1976) Cavaliere, A., & Fusco-Femiano, R. 1976, A&A, 49, 137
- Chen et al. (1997) Chen, L.-W., Fabian, A. C., & Gendreau, K. C. 1997, MNRAS, 285, 449
- Courteau & van den Bergh (1999) Courteau, S., & van den Bergh, S. 1999, AJ, 118, 337
- Dahlem & Thiering (2000) Dahlem, M., & Thiering, I. 2000, PASP, 112, 148
- David et al. (1995) David, L. P., Jones, C., & Forman, W. 1995, ApJ, 445, 578
- Davis et al. (1995) Davis, D. S., Mushotzky, R. F., Mulchaey, J. S., Worrall, D. M., Birkinshaw, M., & Burstein, D. 1995, ApJ, 444, 582
- Davis et al. (1999) Davis, D. S., Mulchaey, J. S., & Mushotzky, R. F. 1999, ApJ, 511, 34
- Dixon et al. (2001) Dixon, W. V., Sallmen, S., Hurwitz, M., & Lieu, R. 2001, ApJ, 552, L69
- Edelstein et al. (2000) Edelstein, J., Korpela, E., & Dixon, W. V. 2000, BAAS, 32, 1427
- Evrard et al. (1996) Evrard, A. E., Metzler, C. A., & Navarro, J. F. 1996, ApJ, 469, 494
- Fabricant et al. (1980) Fabricant, D., Lecar, M., & Gorenstein, P. 1980, ApJ, 241, 552
- Fixsen et al. (1996) Fixsen, D. J., Cheng, E. S., Gales, J. M., Mather, J. C., Shafer, R. A., & Wright, E. L., 1996, ApJ, 473, 576
- Garmire et al. (1992) Garmire, G. P., Nousek, J. A., Apparao, K. M. V., Burrows, D. N., Fink, R. L., & Kraft, R. P. 1992, ApJ, 399, 694
- Gehrels & Williams (1993) Gehrels, N., & Williams, E. D. 1993, ApJ, 418, L25
- Hasinger et al. (1998) Hasinger, G., Burg, R., Giacconi, R., Schmidt, M., Trümper, J., & Zamorani, G. 1998, A&A, 329, 482
- Helsdon & Ponman (2000) Helsdon, S. F., & Ponman, T. J. 2000, MNRAS, 315, 356
- Hunt & Sciama (1972) Hunt, R., & Sciama, D. W. 1972, MNRAS, 157, 335
- Hurwitz & Bowyer (1996) Hurwitz, M., & Bowyer, S. 1996, in Astrophysics in the Extreme Ultraviolet, ed. S. Bowyer, & R. F. Malina (Dordrecht: Kluwer Academic Publishers), 601
- Hurwitz et al. (1998) Hurwitz. M., et al. 1998, ApJ, 500, L61
- Hwang et al. (1999) Hwang, U., Mushotzky, R. F., Burns, J. O., Fukazawa, Y., & White, R. A. 1999, ApJ, 516, 604
- Irwin & Bregman (1999) Irwin, J. A., & Bregman, J. N. 1999, ApJ, 527, 125
- Jones & Forman (1984) Jones, C., & Forman, W. 1984, ApJ, 276, 38
- Kahn & Woltjer (1959) Kahn, F. D., & Woltjer, L. 1959, ApJ, 130, 705
- Karachentsev & Makarov (1996) Karachentsev, I. D., & Makarov, D. A. 1996, AJ, 111, 794
- Kogut et al. (1996) Kogut, A., Banday, A. J., Bennett, C. L., Górski, K. M., Hinshaw, G., Smoot, G. F., & Wright, E. L. 1996, ApJ, 464, L5
- Mahdavi et al. (2000) Mahdavi, A., Böhringer, H., Geller, M. J., & Ramella, M. 2000, ApJ, 534, 114
- Maloney & Bland-Hawthorn (1999) Maloney, P. R., & Bland-Hawthorn, J. 1999, ApJ, 522, L81
- Mateo (1998) Mateo, M. L. 1998, ARA&A, 36, 435
- Mewe et al. (1985) Mewe, R., Gronenschild, E. H. B. M., & van den Oord, G. H. J. 1985, A&AS, 62, 197
- Mewe et al. (1986) Mewe, R., Lemen, J. R., & van den Oord, G. H. J., 1986, A&AS, 65, 511
- Miyaji et al. (1998) Miyaji, T., Ishisaki, Y., Ogasaka Y., Ueda, Y., Freyberg, M. J., Hasinger, G., & Tanaka, Y. 1998, A&A, 334, L13
- Morrison & McCammon (1983) Morrison, R., & McCammon, D. 1983, ApJ, 270, 119
- (38) Mulchaey, J. S., Mushotzky, R. F., Burstein, D., & Davis, D. S. 1996, ApJ, 456, L5
- (39) Mulchaey, J. S., Davis, D. S., Mushotzky, R. F., & Burstein, D. 1996, ApJ, 456, 80
- Mushotzky (1993) Mushotzky, R. 1993, in The Environment and Evolution of Galaxies, ed. J. M. Shull, & H. A. Thronson, Jr. (Dordrecht: Kluwer Academic Publishers), 383
- Oegerle et al. (2000) Oegerle, W. R., et al. 2000, ApJ, 538, L23
- Oort (1970) Oort, J. H. 1970, A&A, 7, 381
- Osone et al. (2000) Osone, S., Makishima, K., Matsuzaki, K., Ishisaki, Y., & Fukazawa, Y. 2000, AdSpR, 25, 3-4, 589
- Pedersen et al. (1997) Pedersen, K., Yoshii, Y., & Sommer-Larsen, J. 1997, ApJ, 485, L17
- Peebles (1990) Peebles, P. J. E. 1990, ApJ, 362, 1
- Pildis & McGaugh (1996) Pildis, R. A., & McGaugh, S. S. 1996, ApJ, 470, L77
- Primini et al. (1993) Primini, F. A., Forman, W., & Jones, C. 1993, ApJ, 410, 615
- Primini et al. (2000) Primini, F., Garcia, M., Murray, S., Forman, W., Jones, C., & McClintock, J. 2000, in The Interstellar Medium In M31 And M33, Proceedings 232, WE-Heraeus Seminar, ed. E. M. Berkhuijsen, R. Beck, & R. A. M. Walterbos (Aachen: Shaker Verlag), 145, in press (astro-ph/0012164)
- Raymond & Smith (1977) Raymond, J. C., & Smith, B. W. 1977, ApJS, 35, 419
- Renzini (1997) Renzini, A. 1997, ApJ, 488, 35
- (51) Savage, B. D., et al. 2000, ApJ, 538, L27
- (52) Savage, B. D., et al. 2000, ApJS, 129, 563
- Schindler (1996) Schindler, S. 1996, A&A, 305, 756
- Sembach et al. (2000) Sembach, K. R., et al. 2000, ApJ, 538, L31
- Shelton et al. (2001) Shelton, R. L., et al. 2001, ApJ, in press (astro-ph/0105278)
- Shirey et al. (2000) Shirey, R., et al. 2000, A&A, 365, L195
- Sidher et al. (1999) Sidher, S. D., Sumner, T. J., & Quenby, J. J. 1999, A&A, 344, 333
- Snowden et al. (1997) Snowden, S. L., et al. 1997, ApJ, 485, 125
- Stanek & Garnavich (1998) Stanek, K. Z., & Garnavich, P. M. 1998, ApJ, 503, L131
- Stark et al. (1992) Stark, A. A., Gammie, C. F., Wilson, R. W., Bally, J., Linke, R. A., Heiles, C., & Hurwitz, M. 1992, ApJS, 79, 77
- Suto et al. (1996) Suto, Y., Makishima, K., Ishisaki, Y., & Ogasaka, Y. 1996, ApJ, 461, L33
- Tawara et al. (1998) Tawara, Y., Sato, S., Furuzawa, A., Yamashita, K., Isobe, K., & Kumai, Y. 1998, in IAU Symp. 188, The Hot Universe, ed. K. Koyama, S. Kitamoto, & M. Itoh (Dordrecht: Kluwer Academic Publishers), 327
- van den Bergh (2000) van den Bergh, S. 2000, ARA&A, in press (astro-ph/9908050)
- Vecchi et al. (1999) Vecchi, A., Molendi, S., Guainazzi, M., Fiore, F., & Parmar, A. N. 1999, A&A, 349, L73
- Verner et al. (1994) Verner, D. A., Tytler, D., & Barthel, P. D. 1994, ApJ, 430, 186
- West et al. (1997) West, R. G., Barber, C. R., & Folgheraiter, E. L. 1997, MNRAS, 287, 10
- Zabludoff & Mulchaey (1998) Zabludoff, A. I., & Mulchaey, J. S. 1998, ApJ, 496, 39
- Zabludoff (1999) Zabludoff, A. I. 1999, in IAU Symp. 192, The Stellar Content of Local Group Galaxies, ed. P. Whitelock, & R. Cannon (Dordrecht: Kluwer Academic Publishers), 433
- Zaritsky (1994) Zaritsky, D. 1994, in The Local Group: Comparative and Global Properties, ed. A. Layden, R. C. Smith, & J. Storm, ESO Conference and Workshop Proceedings No. 51, 187
- Zaritsky (1999) Zaritsky, D. 1999, in ASP Conf. Ser. 165, The Third Stromlo Symposium: The Galactic Halo, ed. B. K. Gibson, T. S. Axelrod, & M. E. Putman (San Fransisco: ASP), 34


| Multipole | Initial Model | Revised Model | COBE |
|---|---|---|---|
| 9.8 nK | 1.5 nK | KaaData from Fixsen et al. 1996 | |
| 4.2 nK | 0.6 nK | mKaaData from Fixsen et al. 1996 | |
| 2.5 nK | 0.4 nK | 4 K Kbb95% confidence interval (Kogut et al. 1996) |