email: ddon@cea.fr , marnaud@discovery.saclay.cea.fr
Self-similarity of clusters of galaxies and the relation
In this paper based on ROSAT/PSPC data we investigate the emission measure profiles of a sample of hot clusters of galaxies ( keV) in order to explain the differences between observed and theoretically predicted – relation. Looking at the form of the emission measure profiles as well as their normalizations we find clear indication that indeed the profiles have similar shapes once scaled to the virial radius, however, the normalization of the profiles shows a strong temperature dependence. We introduce a – relation with the dependence . This relationship explains the observed – relation and reduces the scatter in the scaled profiles by a factor of 2 when compared to the classical scaling. We interpret this finding as strong indication that the – relation in clusters deviates from classical scaling.
Key Words.:
Galaxies: clusters: general – Cosmology: observations, dark matter – X-rays: general1 Introduction
The simplest, purely gravitational, models of structure formation predict that galaxy clusters are self-similar in shape and that scaling laws relate each physical property to the cluster total mass and redshift (Kaiser kaiser1 (1986); Navarro et al. navarro (1997); Teyssier et al. teyssier (1997); Eke et al.eke (1998); Bryan & Norman bryan (1998)). Self similarity applies to both the dark matter component and the hot intra-cluster medium (ICM). The virial theorem then yields the well known scaling relations:
| (1) | |||||
| (2) |
where is the total mass in the sphere of radius corresponding to the overall over density and is the cluster temperature. Assuming a constant gas mass fraction, the total gas mass then scales as and the X–ray luminosity as .
The comparison between observed clusters and theoretical predictions gives us insight into the physics that governs their formation and evolution. Vikhlinin et al. vikhlinin (1999) recently found , which is close to the predicted scaling law. Both the gas density and temperature profiles of hot clusters (keV) do show regularity (Markevitch et al. markevitch1 (1998); Neumann & Arnaud neumann (1999), hereafter paper I; Vikhlinin et al. vikhlinin (1999)). The shapes of various clusters, once the radius is scaled to the virial radius, look remarkably similar outside the cooling flow region, supporting the existence of an universal underlying dark matter profile.
However, clusters also deviate from the predicted scaling laws. The most remarkable deviation is the observed – relation. Different authors, studying different cluster samples, found (Arnaud & Evrard arnaud (1999); Markevitch markevitch2 (1998); Allen & Fabian allen (1998)) with a low dispersion, ruling out the theoretical relation . This difference between the slopes of the observed and theoretical relations can be explained if i) the cluster shape depends on the ICM temperature and/or ii) the gas mass temperature relation deviates from predictions (Arnaud & Evrard arnaud (1999); Ponman et al. ponman (1999)). Non gravitational effects, like pre-heating by early galactic winds, could affect the gas distribution shape (e.g Loewenstein loewenstein (2000); Tozzi & Norman tozzi (2001)) and have been proposed to explain the steepening of the – relation (Kaiser kaiser2 (1991); Evrard & Henry evrard1 (1991)). However the observed structural similarity of hot clusters suggest that pre-heating plays an important role only for cool () clusters (see also Ponman et al. ponman (1999), Lloyd-Davis et al. lloyd (2000)).
In order to investigate further the observed – relation, we examine in this paper the emission measure profiles of a sample of nearby hot clusters, for which the effect of pre-heating is a priori minimal. The shape and normalization of the emission measure profiles are sensitive to both the cluster internal structure and the total gas mass. Comparing the profiles of clusters at different temperatures can provide more detailed information about the cause of the discrepancy between the predicted and observed – relations. In this paper we adopt and .
2 The data
The emission measure profiles are from our previous work (Paper I), where the cluster sample and imagery data processing are described in detail. The cluster sample comprises Abell clusters (Abell, Corwin & Olowin abell (1989)) in the redshift range , which were observed in pointing mode with the ROSAT PSPC and provide good statistics. Here we only consider the clusters in the subsample for which accurate temperature measurements exist from the literature (with ). The emission measure profiles are deduced from the observed surface brightness profiles via Eq.3 in paper I.
3 Combining self-similarity and the observed -relation
3.1 Dependence of X-ray luminosity and emission measure profile on gas mass and ICM structure
Let us consider a cluster of extent and temperature . Its X-ray luminosity depends on its total gas mass (within radius ) and its internal structure as:
| (4) |
(see also Arnaud & Evrard arnaud (1999)) where is the cooling function, which we will assume to be . is a form factor which only depends on the shape of the gas density distribution (). is equal to , where the brackets denote the average over the whole cluster (see also Arnaud & Evrard arnaud (1999)). If clusters are self-similar in shape, should be constant.
The emission measure along the line-of-sight at radius is defined as:
| (5) |
is again a dimensionless form function, which should be independent of temperature if clusters are self-similar. According to the theoretical scaling laws, EM should scale as .
3.2 Does the ICM shape depend on temperature?
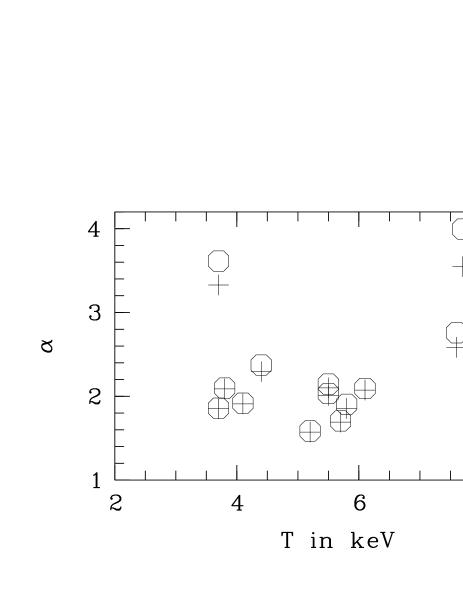
In Paper I, we already quantified the structural variation in the cluster sample. We derived the logarithmic ICM density gradient by fitting a –model to the data,
| (6) |
and showed that the dispersion of is less than at any scaled radius. The values, for two different scaled radii, are plotted versus cluster temperature in Fig.1. There is no apparent correlation between and , i.e no systematic variation of shape with temperature.
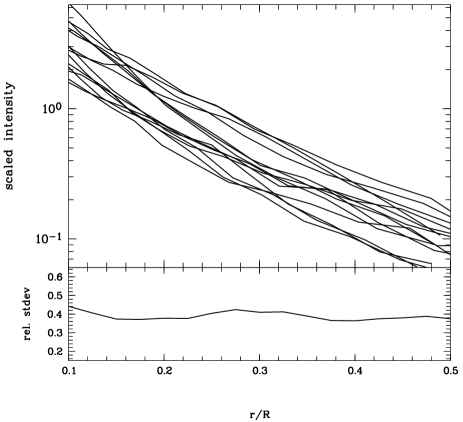
Fig.2 shows the scaled emission measure profiles of the clusters, (upper panel), and their corresponding relative dispersion (lower panel). The scaling radius was fixed to with the normalization from Evrard et al. (evrard2 (1996)). Due to detection limits we only consider radii , our sample becoming incomplete at larger radii. The dispersion of the profiles is significant ( standard deviation) but stays constant with radius. This again indicates that the profiles are essentially parallel (self similarity of form) but points towards a possible problem with the normalization scaling factor. These features are also evident to the eye in the upper panel.
We will thus assume in the following a common shape for all the clusters in the sample (i.e. and are constant) and study possible deviation from the theoretical – and – relations.
3.3 Temperature dependence of the gas mass
We now consider:
| (7) |
From Eq. 3, Eq. 4 and Eq. 7, the x and y slopes must be related by to account for the observed slope of the relation.
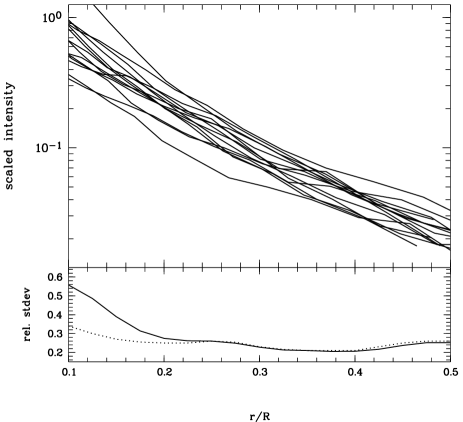
If we assume that , corresponding to the classical – relation111Another formal solution is , which implies . This is in contradiction with the relation found by Vikhlinin et al. (vikhlinin (1999)). Therefore we discard this possibility in the following., we derive or . From Eq. 5, the emission measure scales in this case as , instead of . The scaled emission measure profiles, using this new scaling, are shown in Fig.3. Note that these rescaled profiles are simply the scaled profiles, , displayed Fig.2, divided by . Remarkably, this re-normalization does reduce the dispersion of the profiles, by a factor of 2, when compared to the classical scaling.
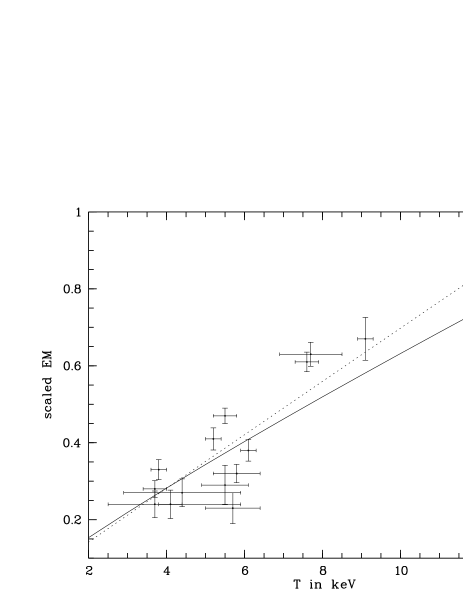
To study more directly the deviation from the theoretical temperature scaling, we display , estimated at , versus T in Fig.4. To extend the upper limit of the sample temperature range, we also considered A2163 (), one of the hottest clusters observed so far (Elbaz et al. elbaz (1995)). A clear correlation between and T is observed. The relationship required to explain the observed relation (, full line) matches the data points. The dashed line in Fig. 4 represents a crude best fit to the data (Press et al. press (1993)) ignoring error bars. This fit gives , reasonably close to the required relationship. The error bars on and are highly correlated in a non trivial way and we did not try to estimate error bars on the correlation. At fixed scaled radius, is derived from the value, measured at a physical radius which depends on via the – relation. This can be an important source of error, not included here, since varies rapidly with radius. The relatively large dispersion at low temperatures (Fig.4) is possibly due to the larger number of clusters in this domain and our underestimate of the true errors.
4 Discussion
Recently Mohr et al. (mohr2 (1999)) estimated the gas mass within for a sample of 45 galaxy clusters. Their derived – relation, , is steeper than the theoretical expectation and in excellent agreement with our results. Our results are also consistent with the relation, , derived by Vikhlinin et al. (vikhlinin (1999)) after fitting a power law to the X-ray emission of the outer parts of clusters. Although this general agreement was not unexpected, since all these studies are based on ROSAT surface brightness data, it is not entirely trivial. Our evidence of a steeper than predicted – relation relies on structural and scaling properties of the emission measure profiles, guided by the independently measured – relation, while the analysis in previous works is more global, based on the integrated density profiles.
Mohr & Evrard (mohr1 (1997)) found a tight correlation between the X-ray isophotal radius and the temperature with . This relation is steeper than the theoretical expectation, , for self similar clusters with (Mohr et al. mohr2 (1999)). They interpret their finding as evidence for structural variation with temperature. However, our study indicates that this steepening (for clusters with keV) originates from systematic deviation of the profile normalization from the theoretical scaling with T. For a –model , the X-ray surface brightness profiles at large radii varies as , where is the core radius and the central emission measure. For self similar clusters and scales as (for ). If scales as , instead of , as derived here, we expect that scales as , as found by Mohr & Evrard (mohr1 (1997)).
The steepening of the – relation has to be explained physically. It can arise from i) a variation of the gas mass fraction with temperature and/or ii) a deviation of the total mass versus T relation from the theoretical scaling law.
If the modeling of dark matter clustering is correct and the ICM is in hydrostatic equilibrium, the latter possibility would imply that the X-ray mean temperature is a biased indicator of the virial temperature. For instance relativistic particles creating radio halos could contribute to the ICM pressure. If the strengths or quantity of these particles is a function of temperature as indicated by Colafrancesco (colafrancesco (1999)) it might explain the deviation from the relation. Departure from isothermality could also bias the temperature measured from single temperature fits from global cluster X–ray spectra. Numerical simulations (Mathiesen & Evrard mathiesen (2001); Bialek et al. bialek (2001)) suggest a slight steepening of the relation with . New X-ray observatories such as XMM or Chandra will be able to investigate this possibility in detail.
The effect of pre-heating on the – relation was studied recently by Bialek et al. (bialek (2001)). Numerical simulations with initial entropy level consistent with the observations of Lloyd-Davis et al. (lloyd (2000)), predict a steepening of the – relation, typically , which is coherent with our results. The M-T relation obtained from simulations with and without pre-heating is similar. However, in pre-heating models, the – relation becomes steeper than the relation, due to systematic variations of with T. However in the work by Bialek et al. (bialek (2001)) only 7 clusters have temperatures above 3.5 keV, with a large scatter in the –T relation (figure 13, their work). Larger samples of simulated hot clusters and more detailed studies of their internal shape are necessary to see if pre-heating can contribute to the bias in the – relation via variation, without introducing structural variations, which is inconsistent with the observations.
5 Conclusion
Studying the emission measure profiles of a sample of clusters () we found a strong indication that the – relation of hot clusters deviates from theoretical expectations. Our results suggest . This relationship together with the fact that clusters show self-similar profiles can explain the observed – relation, which also differs from theoretical expectations.
This result is in agreement with previous work such as Mohr et al. (mohr2 (1999)) or Vikhlinin et al. (vikhlinin (1999)), based on the direct measurement of in clusters. However, our study is more sensitive to deviations from the predicted – relation since the emission measure is, with , strongly coupled to the gas mass content. Observations from XMM-Newton or Chandra of the temperature structure are required to assess whether the total mass also diverges from the predicted scalings.
Acknowledgements.
We would like to thank the referee, Brad Holden, for his very useful comments to improve the paper.References
- (1) Abell, G.O., Corwin, H.G. Jr., Olowin, R.P. 1989, ApJS, 70, 1
- (2) Allen, S.W., Fabian, A.C. 1998, MNRAS, 297, L57
- (3) Arnaud, M., Evrard, A.E. 1999, MNRAS, 305, 631
- (4) Bialek, J.J., Evrard, A.E., Mohr, J.J. 2001, ApJ submitted, astro-ph/0010584
- (5) Bryan, G.L., Norman, M.L. 1998, ApJ, 495, 80
- (6) Colafrancesco, S. 1999, in Diffuse Thermal and Relativistic Plasma in Galaxy Clusters, eds. H. Böhringer, L. Feretti, Schücker P. MPE Report 271
- (7) Eke, V.R., Navarro, J.F., Frenk, C.S. 1998, ApJ, 503, 569
- (8) Elbaz, D., Arnaud, M., Böhringer, H. 1995, A&A, 293, 337
- (9) Ettori, S., Bardelli, S., De Grandi, S., Molendi, S., Zamorani, G., Zucca, E. 2000, MNRAS, 318, 239.
- (10) Evrard, A.E., Henry, J.P 1991, ApJ, 383, 95
- (11) Evrard, A.E., Metzler, C.A., Navarro, J.F. 1996, ApJ, 469, 494
- (12) Kaiser, N. 1986, MNRAS, 222, 323
- (13) Kaiser, N. 1991, ApJ, 383, 104
- (14) Lloyd-Davies, E.J., Ponman, T.J., Cannon, D.B. 2000, MNRAS, 315, 689
- (15) Loewenstein, M. 2000, ApJ, 532, 17
- (16) Markevitch, M., Forman, W.R., Sarazin, C.L., Vikhlinin, A. 1998, ApJ 503, 77
- (17) Markevitch, M. 1998, ApJ 504, 27
- (18) Mathiesen, B.F., Evrard, A.E. 2001, ApJ, 546, 100
- (19) Mohr, J.J., Evrard, A.E. 1997, ApJ, 491, 38
- (20) Mohr, J.J., Mathiesen, B., Evrard, A.E. 1999, 517, 627
- (21) Mohr, J.J., Reese, E.D., Ellingson, E., Lewis, A.D., Evrard, A.E. 2000, ApJ, 544, 109
- (22) Navarro, J.F., Frenk, C.S., White, S.D.M. 1997, ApJ, 490, 493
- (23) Neumann, D.M., Arnaud, M. 1999, A&A, 348, 711 (paper I)
- (24) Ponman, T.J., Cannon, D.B., Navarro, J.F. 1999, Nature 397, 135
- (25) Press, W.H., Teukolsky, S.A., Vetterling, W.T., Flannery, B.P. 1993, Numerical Recipes in C : The Art of Scientific Computing, Cambridge University Press
- (26) Teyssier, R., Chièze, J.P., Alimi, J.M. 1997, ApJ, 480, 36
- (27) Tozzi, P., Norman, C. 2001, ApJ, 546, 63
- (28) Vikhlinin, A., Forman, W., Jones, C. 1999, ApJ, 525, 47