Spatially Resolved Near-Infrared Spectroscopy of Seyfert 2 Galaxies Mk 1066, NGC 2110, NGC 4388, and Mk 311affiliation: Accepted to appear in The Astronomical Journal
Abstract
We present near-infrared spectra with resolutions of in the emission lines Pa, [Fe II] (=1.2567m), Br, and H2 =1–0S(1) of the nuclei and circumnuclear regions of the four Seyfert 2 galaxies Mk 1066, NGC 2110, NGC 4388, and Mk 3. All of these galaxies show strong near-infrared line emission that is detected at radii several times the spatial resolution, corresponding to projected physical scales of 0.07 to 0.7 kpc. Velocity gradients are detected in these nuclei, as are spatial variations in line profiles and flux ratios. We compare the spatial and velocity distribution of the line emission to previously observed optical line and radio emission. The evidence indicates that the [Fe II] emission is associated with the Seyfert activity in the galaxies. Our data are consistent with X-ray heating being responsible for most of the [Fe II] emission, although differences in [Fe II] and Pa line profiles associated with radio emission suggests that the [Fe II] emission is enhanced by fast shocks associated with radio outflows. The H2 emission is not as strongly associated with outflows or ionization cones as is the emission in other lines, but rather appears to be primarily associated with the disk of the galaxy.
1 Introduction
The near-infrared wavelength range offers valuable probes of the dynamics, composition, and excitation mechanisms present in the circumnuclear gas of active galactic nuclei (AGN). Among the near-infrared emission lines which have been observed to be strongest in Seyfert galaxies are the recombination lines of hydrogen, Pa (=1.2818m) and Br (=2.1655m), collisionally excited lines of singly ionized iron, e.g., [Fe II](=1.2567m), and rotational-vibrational lines of molecular hydrogen, e.g., H2 =1–0S(1) (=2.1212m). Additionally, there are very high excitation coronal lines, e.g., [S IX] (=1.2525m), which have been seen in a number of Seyfert galaxies (e.g., Moorwood & Oliva, 1994; Knop et al., 1996). To date, most published infrared spectra of Seyfert 2 galaxies use single large beams centered on the nucleus (e.g., Goodrich et al., 1994). Thus, very little spatial information on the strong near-infrared lines is available. However, some studies have shown that near-infrared line emission is extended over a spatial scale easily probed with ground-based spectroscopy. For example, near-infrared [Fe II] and H2 emission has been seen extended over several arcseconds (1 kpc) in the nucleus of the Seyfert 2 galaxy NGC 1068 (Blietz et al., 1994), the Seyfert 1.5 galaxy NGC 7469 (Genzel et al., 1995), and the Seyfert 1.5 galaxy NGC 4151 (Knop et al., 1996). In each case, there were overall spatial and kinematic similarities between the infrared and optical line emission, but differences were also apparent on spatial and velocity scales within the NLR. Clearly, there is important diagnostic information about the circumnuclear regions of Seyfert 2 galaxies to be gained from spatially resolved near-infrared spectroscopy.
This paper presents longslit near-infrared spectra of the Seyfert 2 galaxies Mk 1066, NGC 2110, NGC 4388, and Mk 3, in wavelength ranges which include the lines Pa, Br, [Fe II] (=1.2567m), H2 =1–0 S(1), and [S IX](=1.2525m). These four objects were chosen from a larger project to search for spatially extended infrared line emission in 20 Seyfert 1 and Seyfert 2 galaxies. Because desirable targets in this larger project were those likely to show extended emission, Seyfert galaxies visible from Palomar Observatory () were selected with redshift cz5400 km s-1, corresponding to a spatial scale of 350 pc/′′. (Throughout this paper, for the determination of distances and hence projected scales, we assume km s-1 Mpc-1.) Galaxies with known extended optical ionized gas were preferentially observed, followed in priority by galaxies with spatially extended radio emission on scales of . The final sample of galaxies observed includes 11 Seyfert 1.x (1, 1.5, and 1.9) galaxies and 12 Seyfert 2 galaxies. This paper reports the results from this program for the four Seyfert 2 galaxies that show the best well-detected extended circumnuclear emission line regions in the near-infrared.
Throughout this paper, for the determination of distances and hence projected scales, we assume km s-1 Mpc-1.
2 Observations and Data Reduction
The near-infrared spectra discussed in this paper were obtained at the Hale 200′′ telescope with the Palomar Near-Infrared Spectrometer (Larkin et al., 1996). Observations at resolution were made in two spectral ranges for each galaxy. One spectral range in the J-band atmospheric window covers 0.07m and includes the [S IX], [Fe II], and Pa lines in the rest frame of each galaxy. The other spectral range in the K-band atmospheric window covers 0.13m and includes the H2 =1–0 S(1) and Br lines. Table 1 is a log of the observations, including the resolution (in km s-1), on-source integration time, and position angle of the slit for each observation. Since we are interested in exploring the near infrared emission line flux ratios and dynamics as a function of distance from the Seyfert nucleus, we chose slit position angles to coincide with the position angle of known ionization cones or other anisotropy previously mapped through narrow band optical emission line imaging. In the case of two of the galaxies (Mk 1066 and NGC 4388), there are additional observations along a secondary slit through the nucleus, perpendicular to the primary position angle.
The spectrometer is a reimaging system which disperses the light from the telescope and feeds the spectra to an externally mounted infrared camera. The spatial scale of the 256256 NICMOS HgCdTe array in the camera is 0.165′′ pixel-1. The width of the adjustable slit was approximately 0.6′′, yielding the resolutions listed in Table 1. In order to accurately center the nucleus in the slit, a fold mirror inside the spectrometer, but in front of the grating, allows infrared imaging with a field of view. Between subsequent observations of each galaxy, the nucleus was moved back and forth along the slit by 20′′, to allow for background subtraction while maximizing the amount of on-source integration time. Each individual exposure was 600s for the J-band (1.2m) wavelength range, and 300s for the K-band (2.2m) wavelength range. Along with the observation of each galaxy, we observed a G-dwarf star at a similar airmass (within 0.1 of that of the galaxy), and where possible in the same area of the sky, in order to correct for atmospheric transmission. A chopping secondary mirror on the telescope uniformly spread the light of this star along the length of the slit. In this way, the spectrum of the atmospheric calibrator is also used as a flat-field.
| Galaxy | Wavelength | On-Source | Slit | Res. | psf | Date of |
|---|---|---|---|---|---|---|
| Integration | PA | km s-1 | FWHM | Observation | ||
| Mk 1066 | 1.25m-1.31m | 2400s | 135∘ | 24215 | 1995/09/09 | |
| Mk 1066 | 2400s | 45∘ | 22815 | 1996/09/10 | ||
| Mk 1066 | 2.10m-2.23m | 2400s | 135∘ | 28919 | 1995/09/08 | |
| Mk 1066 | 2400s | 45∘ | 28919 | 1995/09/10 | ||
| NGC 2110 | 1.25m-1.31m | 2400s | 160∘ | 22916 | 1996/01/05 | |
| NGC 2110 | 2.09m-2.22m | 1800s | 160∘ | 28519 | 1996/01/05 | |
| NGC 4388 | 1.25m-1.31m | 2400s | 30∘ | 22915 | 1996/01/03 | |
| NGC 4388 | 2400s | 120∘ | 24415 | 1996/04/08 | ||
| NGC 4388 | 2.10m-2.23m | 2400s | 30∘ | 26119 | 1996/01/03 | |
| NGC 4388 | 1800s | 120∘ | 30319 | 1996/04/08 | ||
| Mk 3 | 1.26m-1.32m | 3000s | 113∘ | 24315 | 1995/11/06 | |
| Mk 3 | 2.14m-2.27m | 1800s | 113∘ | 29219 | 1995/11/07 |
The data were reduced following the procedure described in Knop (1997). Bad pixels were removed by linear interpolation, and the spatial and spectral curvature of the field of view was measured and removed using a point source spectrum and the spectrally unresolved OH night sky lines. Spectral data frames were divided by the appropriate G-star spectrum, in order to remove atmospheric absorption lines and to correct for efficiency variations across the field of view. In order to correct for the blackbody slope of the G-star continuum, and to remove absorption features intrinsic to the star, each G-star spectrum was first divided by a solar spectrum following the procedure of Maiolino, Rieke, & Rieke (1996).
3 Results and Discussion: Individual Objects
3.1 Mk 1066
Mk 1066 is an inclined SB0+ galaxy with a systemic velocity of 3625 km s-1 (Bower et al., 1995). This corresponds to a calculated distance of 48 Mpc, which yields a spatial scale of 234 pc arcsec-1. Hubble Space Telescope (HST) imaging of the nuclear regions shows a narrow “jetlike” feature in a narrow band image which includes [OIII] and H. This jet is oriented at 315∘ and extends northwest of the nucleus. In H and [NII], the jet is observed on both sides of the nucleus (Bower et al., 1995). The nuclear radio source is linear, and extended over 2.6′′. The 5 GHz radio emission is oriented at the same position angle as the optical line emission (Ulvestad & Wilson, 1989).
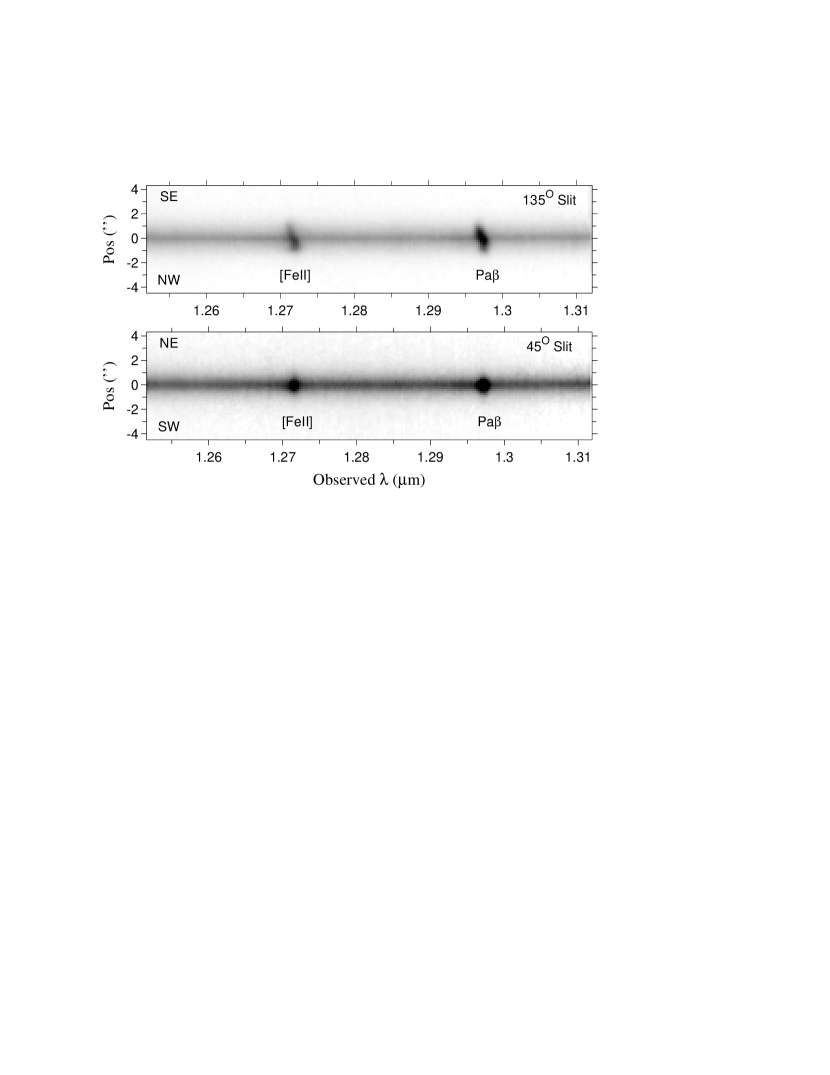
We obtained infrared spectra of Mk 1066 along two position angles, 135/315∘ and 45/225∘. The 135∘ angle of the slit was chosen to align with the position angle of the optical ionization cones (Bower et al., 1995). These spectra show strong line emission, concentrated on the nucleus. Four emission lines are visible in Figures 1, 2, and 3: Pa and [Fe II] in the J-band spectra, and Br and H2 =1–0 S(1) in the K-band spectra. No [S IX] (=1.2525m) is visible on the nucleus (to an upper limit on the equivalent width of m). In addition, there is data along a 45∘ slit chosen to be perpendicular to the primary slit. The infrared lines are visible over a spatial extent of (1.2 kpc) along the 135∘ slit, in comparison to the FWHM of the nuclear continuum which was at 1.25m and at 2.15m in our spectra (both of which are greater than the 0.5–0.7′′ FWHM of the atmospheric seeing). In contrast, the lines are less spatially extended along the 45∘ slit, and are visible only over an extent of . The Br line is strongest on the nucleus, but the Pa, [Fe II], and H2 lines peak about northwest of the nucleus (see Figure 5).
Figure 1 shows two greyscale plots of the reduced 1.25–1.31m spectra along both position angles. The horizontal axis is observed wavelength, and the vertical axis is position along the slit in arcseconds from the nucleus. The Pa and [Fe II] lines are spatially resolved along both position angles in Figure 1. The tilt in the lines indicates that there is a spatial velocity gradient in the [Fe II] and Pa lines along the 135∘ slit; this will be discussed in section 3.1.2. Along the 45∘ slit, no velocity gradient is immediately apparent.
Figures 2 and 3 are one-dimensional projections in various spatial bins extracted from the two-dimensional data. Figure 2 shows the spectra along the 135∘ slit, and Figure 3 along the 45∘ slit. The size of each spatial bin used in the extractions is 4 pixels, or 0.67′′. This matches the point spread function (psf) at the time of the observations (0.5′′–0.7′′).
The Pa profile near the nucleus shows enhanced emission blueward of the line center. These blueward features on Pa are visible not only in Mk 1066, but also in several other Seyfert galaxies (Knop et al., 2000). Were this Pa emission, it would be at a velocity of km s-1 relative to the centroid of the Pa emission, which is higher than the velocities observed in other lines in Mk 1066. These blue features on Pa are probably primarily due to a blend of two He I lines at 1.2785m and 1.2791m, which have been resolved from Pa in high resolution spectroscopy of the planetary nebula BD (Goodrich et al., 1994). There may also be a small contribution from [Fe II] (m). For T K and n cm-3, the strength of the [Fe II] (m) line is expected to be of the strength of the [Fe II] (=1.2567m) line (Goodrich et al., 1994). In Mk 1066, [Fe II] (m) could account for at most half of the emission on the blue side of Pa.


3.1.1 Integrated Line Flux Ratios
Table 2 in Appendix A lists the equivalent widths and flux ratios of the lines observed in Mk 1066. Because [Fe II] and Pa were observed simultaneously and are close in wavelength, we may obtain accurate [Fe II]/Pa flux ratios which are relatively insensitive to uncertainties in flux calibration or differential reddening. Similarly, we may obtain reliable H2/Br flux ratios from our K-band spectra. Figure 4 shows these ratios as a function of position along the slit, using the total integrated fluxes for each species in each spatial bin to derive the line flux ratios.

A striking feature of Figures 3 and 4 is the rapid rise of the H2/Br flux ratio with distance from the nucleus along the 45∘ slit, perpendicular to the position angle of the optical ionization cones. The H2 line is detected 2′′ away from the nucleus in both directions, while the Br line is detected only within 0.67′′ of the nucleus. The H2/Br flux ratio 1.33′′ from the nucleus is 3, in contrast to the nuclear value of . By comparison, along the 135∘ slit, the H2/Br flux ratio always remains between about 0.4 and 0.9, with an indication of a gradient across the nucleus. The [Fe II]/Pa flux ratio varies with position along the 45∘ slit, although not as rapidly as does the H2/Br flux ratio. There is a clear local minmum in the [Fe II]/Pa ratio at the nucleus along both slits.
3.1.2 Velocity structure
Figure 5 is a set of position versus velocity plots along the 135∘ slit for each of the four lines identified in Figures 2 and 3. In each case, a smoothed continuum has been subtracted from the spectrum. Velocity is plotted relative to 3625 km s-1, the systemic velocity of Mk 1066 (Bower et al., 1995), and position is distance in arcseconds on the sky from the continuum peak. A velocity gradient is visible in each of the lines, in the sense that the lines are blueshifted southeast of the nucleus and redshifted northwest of the nucleus. The slope of the velocity gradient does not appear to be the same for all of the lines. Specifically, the H2 line appears to have a steeper gradient (300 km s-1 arcsec-1, or 1300 km s-1 kpc-1) in comparison to the other three lines (whose gradients are 200 km s-1 arcsec-1, or 900 km s-1 kpc-1). In addition, Br appears to have a slightly steeper gradient (by 50 km s-1 arcsec-1) than Pa southeast of the nucleus. The gradients of the [Fe II] and Pa lines are similar.
Another feature apparent in Figure 5 is that all of the lines, except for Br, peak northwest of the nucleus. This is discussed in section 3.1.4.

Table 6 in Appendix A lists the velocity centroids and full widths at half maxima of the complete line profiles for the lines observed in Mk 1066 along both slits in each spatial bin. Many of the lines show a complicated asymmetric profile. These lines were decomposed into the smallest number of Gaussian components necessary to statistically describe the line profile. Figure 6 shows plots of the velocity of the strongest narrow Gaussian component of each line as a function of position along the slit. Usually, this is equivalent to a plot of the mode (peak) of the line profile as a function of position, because most of the line profiles in Mk 1066 are dominated by a strong, central narrow component. For reference, a line connecting the Br velocity peaks is drawn on each plot, and the H velocity curve (Bower et al., 1995) is shown on the Pa plot.

The same relative velocity gradients between the different species mentioned for Figure 5 are visible in Figure 6. It is apparent the difference between the H2 and Br velocity slopes is greater than the difference between the H2 and Pa velocity slopes. Two arcseconds southeast of the nucleus, all of the velocity profiles except for that of Br (which is undetected) show a local velocity reversal of 50–75 km s-1.
In addition to the primary narrow emission line components whose centroid velocities are plotted in Figure 6, there are weaker components which are displaced in velocity relative to the center of the lines. Southeast of the nucleus, where the peaks of the line profiles are blueshifted relative to the systemic velocity, all of the lines show a noticeable enhanced red wing (although it is very weak in H2). On the nucleus and to the northwest where the peaks of the line profiles are redshifted, the Pa and [Fe II] lines show an enhanced blue wing. While this blue wing is almost certainly a feature of the [Fe II] line profile itself, the blue wing of the Pa line suffers contamination from other species as discussed above.

For illustration, Figure 7 shows the profiles of the [Fe II], Pa, and Br lines on the nucleus and 1.33′′ southeast and northwest of the nucleus. Southeast of the nucleus, the red wing is stronger relative to the rest of the line in [Fe II] and Br than it is in Pa. Similarly, northwest of the nucleus, the blue wing is most prominent in [Fe II]. It is not visible in the Br line, and in Pa it may be contaminated by the aforementioned He I and [Fe II] lines.
3.1.3 Comparison with Optical Spectroscopy
Bower et al. (1995) present longslit optical spectroscopy of Mk 1066 along a 134∘ slit. The H, H, [NII], [SII], and [OI] lines all have a velocity gradient extending from +100 km s-1 2-3′′ northwest of the nucleus to -90 km s-1 2-3′′ southeast of the nucleus. This is similar to the velocity structure seen in the infrared lines (see Figure 6), although the peaks of the Pa and particularly the Br lines are slightly blueshifted relative to the optical lines to the southeast of the nucleus.
In addition to the primary kinematic component seen in optical emission lines, Bower et al. (1995) identify a second kinematical component, most clearly seen in [OIII]. The [OIII] emission is slightly blueshifted relative to the other lines northwest of the nucleus and redshifted by as much as 200 km s-1 relative to the other lines southeast of the nucleus. This structure is qualitatively similar to the enhanced wings seen in the infrared lines discussed in section 3.1.2. Specifically, the infrared lines show an enhancement blueward of the peak on the nucleus and to the northwest, and they show an enhancement redward of the peak to the southeast. It is likely that some of the wings seen on the infrared emission lines are associated with the kinematic component Bower et al. (1995) identify in [OIII].
3.1.4 Extinction
Since Pa and Br are both hydrogen recombination lines (n=5–3 and n=7–4 respectively), they should arise in the same physical locations. Their intrinsic Case B flux ratio is well known (assuming radiative transfer effects are negligible). Because of reddening, in dusty regions the observed Pa line will be suppressed relative to the observed Br line. If the dust is intermixed with the line emitting clouds, and there are strong velocity gradients, the two lines can appear to have different velocity structures. In Mk 1066, both the infrared and optical data indicate that extinction effects are stronger to the southeast than they are to the northwest.
A difference in both the spatial and velocity distributions of Pa and Br is visible in Figure 5. The Br line is peaked close to the continuum peak, and is stronger relative to Pa toward the southeast than it is toward the northwest. The simplest explanation of this difference is a larger extinction in the southeast. Spatially variable extinction may also be responsible for the slightly different Pa and Br velocity gradients seen in Figure 5. To the southeast, where dust extinction appears greater, the discrepancy between the velocity gradients for the Pa and Br lines is larger. Extinction could also explain the difference between the velocities of the infrared lines and the optical H line southeast of the nucleus (Bower et al., 1995). The H-infrared slope discrepancy is in the same sense as the Pa–Br slope discrepancy, i.e., lines at shorter wavelengths have shallower gradients; see Figure 6.
This same extinction effect is seen in the red wings of the Pa and Br lines southeast of the nucleus as discussed in section 3.1.2; the wing is relatively more prominent in Br than in Pa suggesting that the extinction to the region where the wings originate is greater than the extinction to the region where the bulk of the line emission originates. If the wings represent outflowing gas, then the redshifted receding gas, which may be partially obscured by dust in the disk of the galaxy, would show higher extinction. There is also evidence from optical wavelengths that the outflowing gas in the southeast is heavily extinguished. The optical line emission is seen emerging from the nucleus in ionization cones at position angles of 135∘/315∘. The [OIII]+H narrowband image (Bower et al., 1995) is much stronger to the northwest, suggesting suppressed emission to the southeast. The 5 GHz radio emission (Ulvestad & Wilson, 1989) indicates that the strength of the outflow is slightly asymmetric, but the difference in the strength of the radio emission northwest and southeast of the nucleus is not as great as the difference in the strength of the [OIII] emission which Bower et al. (1995) associate with the outflow.
Extinction cannot explain the discrepancies between the H2 and Br lines, since the differential extinction between the two is negligible. The H2 line shows a different velocity gradient than Br (Figure 5), and the peak of the H2 emission is shifted to the northwest relative to the peak of the Br emission. The differences in the structure of these lines may indicate that the emission seen from each species originates from different clouds along the same line of sight. Additionally, there may be a systematic variation in the physical conditions along the cone axis of the galaxy.
3.1.5 A Picture of the Circumnuclear Regions of Mk 1066
The infrared data in combination with the data in Bower et al. (1995) indicate that there are two dominant kinematic components in near the nucleus of Mk 1066. One component shows up in infrared H2, in the peaks of the infrared lines, and in optical H, [N II], and other species. This component shows a clear velocity gradient along the 135∘ slit, is blueshifted to the southeast, and is redshifted to the northwest. The second, higher-excitation component shows up in the wings on the infrared lines and in optical [O III], and has the opposite velocity trend from the first component.
Bower et al. (1995) identify the first, low-excitation component with a rotating disk. The velocity gradient seen in the infrared line emission for this component along the 135∘ slit is consistent with a rotation. The much smaller (though non-zero) velocity gradient along the 45∘ slit indicates that the major axis of the rotating disk must be closer to 135∘ than 45∘; a fit of a uniformly rotating disk to the peaks of the infrared line emission along both slits suggests that the major axis of the disk is at . Following Bower et al. (1995), we identify the second component with high-excitation outflowing gas. This second component is not seen off of the nucleus in the infrared spectra along the 45∘ slit, and the optical [O III] emission is clearly extended along an angle of . Consequently, the data indicate that the outflow is not perpendicular to the rotating disk; rather, the two physical systems are at low relative inclination when projected on to the plane the sky.
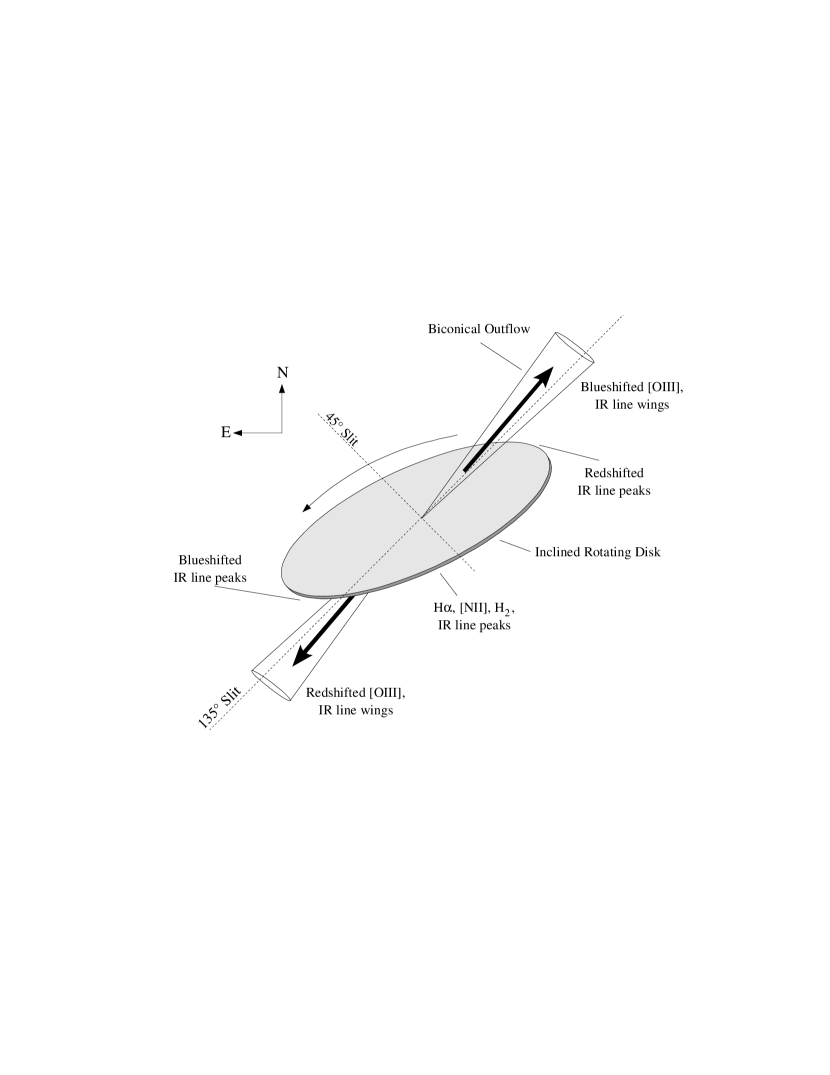
Figure 8 is a cartoon drawing of the system based on the optical and infrared data. In this picture, there is an inclined disk with a major axis of 120∘ projected on the sky. This orientation explains both the greater spatial extent and the larger velocity gradient in the infrared lines along the 135∘ slit. The disk is dusty, explaining the extinction effects discussed in section 3.1.4. There is a biconical outflow associated with the higher-excitation gas, as drawn. To the northwest, this outflow is relatively unobscured, as it is in front of the plane of the galaxy. The blue wings seen on the infrared lines to the northwest are associated with this outflow. To the southeast, the outflow is obscured by the plane of the galaxy, suppressing the [OIII] emission observed in that direction. Extinction resulting from this obscuration enhances the Br/Pa ratio on the red side of the line profile southeast of the nucleus (see Figure 7).
3.1.6 [Fe II] and H2 Emission Processes
The fact that various features of the [Fe II] emission line profiles correspond to those identified with the active nucleus in other species, such as the wings seen in [OIII] (Bower et al., 1995), suggests that the [Fe II] emission is dominated by processes directly associated with the Seyfert nucleus. The radio emission of Mk 1066 (Bower et al., 1995) appears to represent two oppositely directed radio jets aligned with the outflow seen in [OIII]. In the wings on the infrared line profiles we associate with this outflow, [Fe II] emission is enhanced relative to Pa (see Figure 7). Shocks resulting from the interaction of outflowing radio plasma with the ambient gas are a natural mechanism for the production of [Fe II] emission. Fast shocks can both destroy dust grains, increasing the gas phase abundance of iron, and create large partially ionized regions, two conditions which enhance [Fe II] emission.
The most striking feature of the H2 emission is that its strength does not drop off as quickly with distance as the other infrared lines from the nucleus perpendicular to the outflow axis. While Br is only detected out to 150pc from the nucleus at a position angle of 45∘, H2 is detected to 300pc. The presence of H2 emisison along both slits shows that warm molecular gas is ubiquitous in the near-nuclear disk of Mk 1066. Since the H2 is not confined to the cone axis, it is evidently not directly dependent on ionization from the active nucleus or the radio jets for its excitation. There is probably little H2 emission associated with the high excitation outflow, since the wings seen in the [Fe II] and Pa lines associated with this outflow were not detected in the H2 line profiles.
Heating by X-rays from the Seyfert nucleus likely cannot explain the extent of the H2 emission perpendicular to the ionization cone axis. Slow (v km s-1) shocks originating in the nucleus may heat molecular clouds in the disk of the galaxy immediately surounding the nucleus, but the relatively flatter distribution of H2 relative to the other species along the 45∘ slit argues for an extended source of heating for the molecular gas in the regions within pc of the nucleus of Mk 1066.
3.1.7 Summary
-
1.
The infrared Pa, Br, and [Fe II] lines are extended over 5′′ (1.2 kpc projected on the plane of the sky) along a 135∘ position angle coincident with the direction of the optically identified ionization cones. Along a perpendicular angle, their intensity drops off faster with distance from the nucleus; 1.3′′ (0.3 kpc projected) away from the nucleus at 45∘, the intensity of the lines relative to the nucleus is 20% of their value along a position angle of 135∘.
-
2.
The infrared lines have strongly peaked narrow components. The peaks of the lines have a velocity gradient similar to the optical H, H, [NII], [SII], and [OI] lines along a position angle of 135∘, which Bower et al. (1995) identify as part of a rotating, LINER-like disk.
-
3.
There are secondary components in the form of enhanced wings in the infrared lines whose kinematics differ from the strong, narrow components in a manner similar to the difference between the kinematics of [OIII] emission and the other optical lines. The [OIII] emission line and the near infrared line wings are likely associated with a nuclear outflow which produces blueshifted emission to the northwest of the nucleus.
-
4.
The relative spatial distributions of Br and Pa indicate that there is greater extinction to the southeast of the nucleus than there is to the northwest. This may explain differences seen in the velocity centers of hydrogen recombination lines to the southeast, which is most likely due to obscuration of the gas by an inclined disk in Mk 1066.
-
5.
The H2 line is more extended than the other lines along an angle perpendicular to the ionization cone. Along the axis of the cone, it shows a steeper velocity gradient than Pa, Br or [Fe II].
-
6.
We propose that there is a measurable contribution to the [Fe II] emission from shocks associated with the nuclear outflow. It may have a direct link to the radio jets seen at 3.6cm. The H2 emission, on the other hand, arises primarily from the inner (500pc) disk of Mk 1066, most of which is presumably shielded from direct illumination of the nucleus. This warm molecular gas may be heated by extended local sources such as star formation.
3.2 NGC 2110
NGC 2110 is an S0 galaxy with a systemic velocity of 2342 km s-1 (de Vaucouleurs et al., 1991), corresponding to a calculated distance of 31 Mpc, implying a spatial scale of 150 pc arcsec-1. HST narrowband imaging in optical H+[NII] and [OIII] emission shows a narrow jetlike feature near the nucleus extending to the north at a position angle of 340∘, and a weaker opposing feature extending to the south at 160∘ (Mulchaey et al., 1994). The feature curves into an “S” shape 4′′ away from the nucleus in each direction. At 1.49 GHz, NGC 2110 shows a triple radio source extended over 4′′ with a position angle of 0∘ (Ulvestad & Wilson, 1984), slightly different from the position angle of the optical line emission. The curvature of the “S” of the optical line emission is towards the direction of the radio emission. In X-rays, NGC 2110 has a 2-10 keV luminosity of 1.4 erg s-1 with a comparatively high absorbing column density of cm22 (Reichert et al., 1985). This X-ray luminosity is closer to that typical for a moderate luminosity Seyfert 1 galaxy than for a Seyfert 2 galaxy ( erg s-1) (Kriss et al., 1980). ROSAT High Resolution Imager (HRI) data show a spatially extended X-ray source, with secondary X-ray emission 4′′ north of the nucleus which may be associated with the soft X-ray excess seen by Weaver et al. (1995).
Our longslit spectra of NGC 2110 along the ionization cones at a position angle of 160∘ (Figure 9) show strong emission lines in [Fe II], Pa, H2 =1–0 S(1), and Br. No [S IX] (=1.2525m) is detected on the nucleus (with an upper limit on the equivalent width of m). Figure 9 shows the summed spectra in spatially adjacent 1′′ bins along the slit. These lines are visible on the nucleus, and are seen to be extended by (900 pc). In comparison, the FWHM of the continuum is 2.4′′ at 1.2m and 1.5′′ at 2.2m, while the seeing at the time of the observations was . The most striking feature of the NGC 2110 J-band spectrum is the strength of the [Fe II] line. On the nucleus, the [Fe II]/Pa flux ratio is 8.10.8, which is greater than that observed in any other Seyfert galaxy in this survey (Knop et al., 2000).

3.2.1 Integrated Line Flux Ratios
Table 3 in Appendix A lists the equivalent widths and flux ratios of the lines observed in NGC 2110. The [Fe II]/Pa and H2/Br line ratios are very large on and near the nucleus. These flux ratios are plotted as a function of position along the slit in Figure 10. Near the nucleus, the H2/Br flux ratio is close to 3, locally rising at a position north of the nucleus, and dropping off in the furthest spatial bins. The [Fe II]/Pa flux ratio peaks on the nucleus, falling rapidly with radius away from the nucleus.

For most Seyfert galaxies, values of [Fe II]/Pa typically range between 0.5 and 2.0 (e.g., Goodrich et al., 1994; Simpson et al., 1996b), while the H2 =1–0 S(1)/Br flux ratio typically lies between 0.5 and 1.5 (e.g., Moorwood & Oliva, 1988). The flux ratios observed in NGC 2110 are significantly higher than these, with the [Fe II] line in particular being unusually strong in comparison to the Pa line. Indeed, the value of 8.1 for the [Fe II]/Pa flux ratio on the nucleus is higher than that observed in any published Seyfert galaxy spectrum (e.g., Goodrich et al., 1994; Forbes and Ward, 1993; Mouri et al., 1993). This high [Fe II]/Pa ratio is due to both a strong [Fe II] line and a weak Pa line in comparison to other Seyfert galaxies. The equivalent width of the [Fe II] line on the nucleus, 25m, is larger by a factor of 2-4 than that typically seen in Seyfert galaxies, although it is not the largest known equivalent width of [Fe II] in a Seyfert 2 galaxy (e.g., NGC 449; Knop et al., 2000).
3.2.2 Velocity structure
In Figure 11, we show a set of position versus velocity plots for each of the four near-infrared lines seen in NGC 2110. A smoothed continuum has been subtracted from the data in each case. Velocity is plotted relative to the systemic velocity of NGC 2110.

All of the lines in Figure 11 show a gradient with velocity increasing from north to south. Unlike Mk 1066, the velocity gradients appear to be quite similar for the four infrared lines seen in NGC 2110. Figure 12 is a plot of the velocity centroid of each line profile as a function of position for each of the four lines. The centroids for Pa have excluded the flux due to the contamination from He I and [Fe II] on the blue side of Pa (as discussed in section 3.1). Table 7 in Appendix A lists these velocity centroids, as well a the full widths at half maximum of each of the line profiles. The velocity structure in Figure 12 is dominated by the gradient from north to south. [Fe II] appears different from the other species in Figure 11 because it is much wider on the nucleus than it is off of the nucleus. The shape of the contours convolves the spatial variation of the line width and the gradient in the line’s velocity. The slope of the gradient in all species is steeper to the south than to the north (Figure 12), reaching velocities of about 100 to 150 km s-1 at 3′′. South of the nucleus and 250 to 300 km s-1 at 3′′ South of the Nucleus.

A second feature apparent in Figure 12 is that the [Fe II] line is systematically at a lower velocity than the other lines. This effect is strongest south of the nucleus, although here the strong blue wings in [Fe II] pull the centroids to lower velocities. In each spatial bin the velocity peak of the [Fe II] line is shifted to the blue with respect to the other lines by about 50–100 km s-1, which is several times the uncertainty in the wavelength calibration.
In many cases, the lines are asymmetric, although the asymmetries are mostly small enough that the velocity centroids are very close to the velocities of the peaks of the lines. On the nucleus and 1′′ south of the nucleus, Pa, [Fe II], and H2 show a blue wing in places, while north of the nucleus, Br, [Fe II], and H2 show red wings.
The [Fe II] line is significantly broader than the other lines, particularly close to the nucleus (see Figure 11). On the nucleus, the FWHM of the [Fe II] line is 500 km s-1, as compared to 340 km s-1 for the Pa line. In addition, the [Fe II] line has wings with FWHM km s-1 which are not visible in the Pa line. The [Fe II] line is narrower at larger radii, having a FWHM of km s-1, 3′′ away from the nucleus. At 3′′ south of the nucleus, the [Fe II] line remains km s-1 broader than the Pa line, while north of the nucleus the line widths are comparable.
3.2.3 Comparison with Previous IR Spectroscopy
Storchi-Bergmann et al. (1999) (hereafter cited as S99) performed spatially extended infrared spectroscopy of NGC 2110 with resolutions of and . They have data along two slit angles: one at 170∘, similar to our slit angle of 160∘, and one at a perpendicular angle of 80∘. The features of their spectra along the 170∘ slit are also seen in this work, including the notable increase in the [Fe II]/Pa ratio on the nucleus. Any quantitative differences between the results of the two studies are easily explained by differences in slit widths and seeings. One exception is the slope of the continuum in the 2.15m spectra, where the slope seen in this work is opposite that seen in S99. This is probably also a result of differences in the sampled spatial region, but may be partially a result of differences in data reduction, indicating the difficulty in absolute calibration of the continuum in infrared spectra. Since this work is primarily concerned with the spatial and velocity distribution of emission line radiation, it is important to consider how these differences affect calculated line flux ratios. For the differences seen between the two nuclear continuum spectra, the H2/Br flux ratio should not be misestimated by more than 15%, comparable to our quoted error on the nuclear flux ratio. S99 saw a nuclear H2/Br flux ratio of 3.02.0, consistent with our value of 3.20.6; this indicates that the flux ratios observed in each case are in fact robust.
Along the perpendicular 80∘ slit, S99 have data in a wavelength range including Br and H2 (=2.1212m). H2 is well detected to a greater radius along this 80∘ slit, which is perpendicular to the ionization cones. Although S99 have weak or no detection of Br off of the nucleus in either direction, the S/N of the off-nuclear H2 detection is better along the 80∘ slit than it is along the 170∘ slit. This, coupled with our observations of the H2/Br ratio along our 160∘ slit, suggests that also as with Mk 3, the H2/Br ratio off of the nucleus is larger in the slit perpendicular to the ionization cone than it is along the cone axis.
3.2.4 Comparison With Optical Spectra and Radio Morphology
S99 report the detection of a broad Pa line in NGC 2110. This line has a width of 1200 km s-1, and is highly asymmetric to the blue. Although the same spectral feature is present in the data here (see the nuclear spectrum in Figure 9), we interpret the enhanced blue wing as contamination from He I and [Fe II] (see section 3.1), rather than as evidence for high velocity blueshifted Pa emission. The [Fe II] (m) line which contributes to this contamination is generally only the strength of the [Fe II] (=1.2567m) line (Goodrich et al., 1994). However, given that [Fe II] (=1.2567m) is times as strong as Pa on the nucleus of NGC 2110, it is likely that the [Fe II] (m) line contributes more significantly to the emission blueward of Pa than is the case in most Seyfert 2 galaxies.
The velocity structure seen in H, H, and [OIII] (Wilson et al., 1985) is quite similar to the velocity structure seen in the infrared lines plotted in Figures 11 and 12. Wilson et al. (1985) and Wilson & Baldwin (1985) describe this velocity field as a rotating disk with a projected major axis of 161∘. (This paper only presents infrared data for NGC 2110 along one slit position angle. Although the rotation identified by Wilson & Baldwin (1985) is evident in this data, the lack of data along two spatial dimensions precludes any independent conclusions about the major axis of the rotation.)
Near the nucleus, the [OIII] line has a higher root mean square (RMS) width (equivalent to 1 for a Gaussian line profile) than the H line by 100-200 km s-1 (Wilson et al., 1985), although the higher [OIII] signal-to-noise allows weak wings to be visible in the former which are not visible in the latter. South of the nucleus, [OIII] shows a tendency toward enhanced blue wings, similar to what is observed in [Fe II], and to a lesser extent in H2. These enhanced wings show some spatial similarities with the 2 cm emission (Ulvestad & Wilson, 1984), which shows three peaks aligned along a roughly north-south axis. The strongest peak is on the nucleus. The blue wings are strongest in [Fe II], H2, and [OIII] 2′′ south of the nucleus, which is the approximate position of one of the secondary radio peaks. The other off-nuclear radio peak is 2′′ north of the nucleus, where we see a red shoulder in [Fe II] and H2. This suggests that, as with Mk 1066, there may be two kinematical components: a rotating disk, and a second velocity field, possibly an outflow associated with the radio jets (see below). Note that even though the projected position angle of these outflowing jets appears similar to the major axis of the rotation identified by Wilson & Baldwin (1985), the two physical systems need not be aligned in space.
3.2.5 [Fe II] and H2 Emission Processes
The fact that the [Fe II]/Pa ratio is very large on the nucleus and rapidly drops with radius suggests that the [Fe II] emission is associated with the Seyfert nucleus itself. There is indirect evidence that the physical process responsible for the [Fe II] emission in NGC 2110 is X-ray heating and ionization. NGC 2110 has a 2–10 keV X-ray luminosity which is an order of magnitude greater than that typical for a Seyfert 2 galaxy. On the nucleus, the [Fe II]/Pa ratio is also nearly an order of magnitude greater than the typical value for Seyfert 2 galaxies. Out to radii 3–4′′ north of the nucleus, the [Fe II]/Pa ratio remains atypically large. About north of the nucleus, at the position of the secondary 0.1–2.4 keV X-ray emission peak identified by Weaver et al. (1995), there is a lower limit on the [Fe II]/Pa flux ratio of (due to an undetected Pa line). South of the nucleus, opposite the direction of the extended X-ray emission, the [Fe II]/Pa ratio drops to unity.
Although the [Fe II] excitation may be dominated by X-ray ionization, there is likely to be an additional contribution due to fast shocks resulting from the interaction of outflowing radio plasma with surrounding gas. This would explain the enhanced red and blue wings respectively north and south of the nucleus which are spatially coincident with the radio peaks seen by Ulvestad & Wilson (1984) at 1.49 GHz.
Nuclear X-ray heating of molecular clouds may also be the primary mechanism responsible for the H2 emission, although the enhanced H2 emission is not as dramatic as is the case with [Fe II] in this galaxy. The H2/Br ratio in NGC 2110 is large for Seyfert galaxies, though the ratio is not strongly peaked on the nucleus as is the case for the [Fe II]/Pa ratio. The H2/Br flux ratio is nearly constant over the 6′′ (900pc) where the lines are detected. In contrast to Mk 1066, the presence of the wings in the H2 line profiles indicates that there may be warm molecular gas in the outflowing clouds.
3.2.6 Summary
-
1.
In NGC 2110, the [Fe II]/Pa flux ratio is unusually large, reaching a maximum value of 8.1 on the nucleus and dropping off rapidly with radius. The H2/Br ratio is also large, being within 2′′ of the nucleus.
-
2.
In general, the infrared lines show a smooth velocity gradient similar to the velocity gradient seen in optical emission by Wilson et al. (1985).
-
3.
The centroid of the infrared [Fe II] line is systematically shifted with respect to the other lines by about 50-100 km s-1 to the blue. Additionally, the [Fe II] line is km s-1 broader than the other infrared lines near the nucleus.
-
4.
There are enhanced wings on the infrared lines. To the south, where line centroids are redshifted with respect to the systemic velocity, there are enhanced blue wings. To the north, where line centroids are blueshifted with respect to the systemic velocity, there are enhanced red wings. These wings are strongest in [Fe II] and H2 at positions coincient with the secondary radio peaks of Ulvestad & Wilson (1984).
We suggest that the [Fe II] excitation is dominated by nuclear X-ray photoionization. However, the enhanced off-nuclear wings which are spatially coincident with the nonthermal 2cm radio peaks indicate that there is some emission associated with outflowing gas. Fast shocks may contribute to the [Fe II] emission at these locations.
While the H2 emission is likely to be enhanced by the strong X-ray flux in NGC 2110, the distribution of the warm molecular gas is not as centrally peaked as is the [Fe II] emission. This may indicate a large molecular reservoir surrounding the nucleus. In addition, the wings seen in the H2 line profile suggest that at least some of the H2 emitting gas takes part in the outflow driven by radio jets.
3.3 NGC 4388
NGC 4388 is a highly inclined spiral galaxy at a systemic velocity of 2525 km s-1 (Petitjean & Durret, 1993). Although its Hubble type is uncertain (de Vaucouleurs et al., 1991), Corbin, Baldwin, & Wilson (1988) classify it as SB(s)b pec. It is generally considered to be a member of the Virgo cluster (Helou et al., 1980), implying that the distance to the galaxy is probably 14 Mpc (Pierce & Tully, 1988). This yields a spatial scale of 68 pc arcsec-1. Optical narrowband imaging (Corbin, Baldwin, & Wilson, 1988) shows an H+[NII] extent of east and west of the nucleus, aligned with the major axis of the galaxy at position angle . This emission originates in the spiral arms of the galaxy, and is probably due to HII region complexes. Close to the nucleus on a spatial scale of , the [OIII] emission is extended about the nucleus in a halo-like distribution that has a major axis at a position angle of . High resolution radio maps at 4.86 GHz show emission which is elongated southwest of the nucleus at a similar position angle of 200∘ (Hummel & Saikia, 1991). At 4.86 GHz, NGC 4388 is double peaked, with a primary peak on the nucleus and a secondary peak 2.5′′ southwest of the nucleus. There is a weak tertiary peak about 1′′ northeast of the nucleus. NGC 4388 has also been detected in X-rays, with a 2-10 keV luminosity of erg s-1 (Hanson et al., 1990). The soft (0.1-2.4 keV) X-ray emission of NGC 4388 is extended over (Matt et al., 1994).
Because H emission is extended over along a position angle of 120∘ (Corbin, Baldwin, & Wilson, 1988), we obtained a “sky” frame distant (200′′ east) from the center of the galaxy. Subtracting this sky frame from spectra of the galaxy verified that no infrared emission lines were detected at a radius greater than in this direction to a 3 flux limit of erg cms-1 in a spatial beam.
Figures 13 and 14 are one-dimensional projections in various spatial bins of the data along the slits oriented at position angles of 30∘ and 120∘ respectively. The size of each spatial bin used in the extractions is 6 pixels (1′′), slightly larger than the psf at the time of the observations, which was 0.7–0.8′′ for the spectra at both position angles. The nuclear spectra for the two slit position angles show qualitative differences, which are likely attributed to vagaries of spatial sampling with the rectangular synthetic aperture. The 30∘ slit was chosen to align with the major axis of the distribution of [OIII] emission near the nucleus (Corbin, Baldwin, & Wilson, 1988). The 120∘ slit was chosen to be perpendicular to the [OIII] axis.
In NGC 4388, the [Fe II], Pa, Br, and H2 lines are detected with a spatial extent up to 8′′ (540 pc) along the 30∘ slit. Along the perpendicular 120∘ slit, the lines diminish quickly with distance from the nucleus, but are still visible out to a radius of 2–3′′. In addition to these lines, there is a narrow line seen on the nucleus blueward of [Fe II], which we identify as the fine structure line [S IX] at a rest wavelength of 1.25249m (Kuhn, Penn, & Mann, 1996). Oliva et al. (1994) identify this line as [S IX] in the Circinus galaxy. However, Simpson et al. (1996b) and Thompson (1995) identify this line as He I (m), with possibly some contamination from [S IX] in NGC 1068 and NGC 4151 respectively.
The arguments in favor of this line being primarily [S IX] are threefold. First, the He I line is not strong enough to account for the observed flux in the objects where this line is seen. Recombination cascade calculations (Robbins, 1968) indicate that the strength of He I (m) should be % of the strength of the He I (m) line. The latter line, blended with He I (m) and [Fe II] (m), comprises emission which is frequently seen as a weak blue wing on the Pa line profile. However, when seen (see also Knop et al. (2000)), the line blueward of [Fe II] is of comparable strength or stronger than the blend blueward of Pa, arguing against its identification as He I.
Secondly, the observed wavelength centroid is more consistent with [S IX] than with He I. If the line is identified as [S IX], it is blueshifted by km s-1 relative to Pa. If the line is He I, its blueshift would be 174 km s-1. Since the ionization potential of He is only 24.5 eV, we would expect He to show a similar spatial and velocity structure to the H+ lines. S7+, on the other hand, has a much larger ionization potential of 328 eV (West et al., 1985), and may arise from very different physical regions than does most of the Pa and Br emission.
Finally, the line we identify as [S IX] is only seen in a small number of galaxies for which infrared spectra are available (Knop et al., 2000). A He I line would be expected to be seen with a similar strength relative to Pa in most Seyfert galaxies, as the two lines should arise from similar physical regions. The strength of a high ionization coronal line may vary greatly between objects, however, due to variations in the ionization conditions, as well as differences in extinction to the regions responsible for the H+ emission and the coronal emission. We therefore conclude that the line observed at a rest wavelength of 1.252m is [S IX].
The [S IX] line is very strong on the nucleus. Its equivalent width of 4.5m is nearly half that of [Fe II]. It is not as spatially extended as the other infrared lines along the position angle of either slit. It is marginally resolved spatially along the 30∘ slit, showing a stronger flux (0.390.08 of the nuclear [S IX] flux) in the spatial bins than would be expected for atmospheric seeing of 0.8′′ (0.08 of the nuclear flux). It is not resolved along the 120∘ slit.


3.3.1 Integrated Line Flux Ratios
Table 4 in Appendix A lists the equivalent widths and flux ratios of the infrared lines detected in NGC 4388 along both slits. Figure 15 shows the [Fe II]/Pa and H2/Br flux ratios along both slits. On the nucleus, the [Fe II]/Pa flux ratio is about 0.4, a relatively low value for a Seyfert 2 galaxy; however, the [Fe II]/Pa flux ratio rises off the nucleus along both slits. The [Fe II]/Pa ratio is largest where the [Fe II] velocity centers are most discrepant from the Pa velocity centers, specifically to the southwest along the 30∘ slit and to the southeast along the 120∘ slit (see section 3.3.2).

Along the 30∘ slit, which is coincident with the major axis of the optical [OIII] emission (Corbin, Baldwin, & Wilson, 1988), the H2/Br ratio is 1 on the nucleus, decreasing slowly with radius. Along the 120∘ slit, however, the flux of the H2 line does not diminish nearly as quickly as does the flux from the Br line. At a distance 2′′ southeast and northwest of the nucleus, the Br line is of its nuclear strength, while the H2 line is of its nuclear strength (see Figure 14). This behavior is qualitatively similar to that seen in Mk 1066.
3.3.2 Velocity structure
Figure 16 is set of continuum-subtracted position/velocity contour plots for the emission lines observed along the 30∘ slit for NGC 4388. There is an enhanced blue wing of Pa on the nucleus, that is probably dominated by a combination of He I (=1.2786m) and [Fe II] (=1.2788m), as discussed in section 3.1.


Table 8 in Appendix A lists the centroid and width of each line in each spatial bin along both slits. Figures 17 and 18 show the velocity centroids of the line profiles as a function of position along the 30∘ and 120∘ slits respectively. Northeast of the nucleus along the 30∘ slit, the Pa, Br, and [Fe II] lines agree in velocity centroid, and show only a small increase in velocity with distance from the nucleus. The H2 line is slightly redshifted relative to the other lines. Southwest of the nucleus, however, the lines show very different velocity structures. The Pa, Br, and [Fe II] lines turn towards increasing velocity with radius to the southwest, while the velocity gradient of H2 flattens. The [Fe II] line curves back more sharply than the Pa line, until its peak is about 100 km s-1 redward of Pa 3′′ south of the nucleus. Figure 19 shows profiles of the Pa and [Fe II] lines southwest of the nucleus, and indicates that the difference between [Fe II] and Pa is not the result of errors in velocity measurements, but that the centroid and profile of [Fe II] is genuinely redshifted relative to Pa. Br also differs from Pa southwest of the nucleus, increasing in velocity closer to the nucleus than does Pa.
Along the 120∘ slit, the infrared line fluxes drop off faster with radius than they do along the 30∘ slit. Along this slit, there is no evidence for significant velocity changes in the Pa line. Where it was detected, the velocity peak of the Br line is marginally consistent with that of the Pa line, as is the [Fe II] line everywhere except for 1′′ southeast of the nucleus, where [Fe II] is blueshifted by km s-1 relative to Pa. The H2 line is always blueshifted relative to the Br line by 50–100 km s-1.

In addition to different variations in velocity centroid with position, the lines have differing profiles. Along the 30∘ slit, not only is [Fe II] generally wider than Pa, and at a different velocity centroid southwest of the nucleus, but the asymmetries in the lines are different. For instance, 2–3′′ southwest of the nucleus the [Fe II]/Pa ratio is preferentially enhanced at redshifted velocities (Figure 19). These asymmetries suggest that systems of clouds with different flux ratios at different velocities are superimposed along the line of sight. Along the 120∘ slit, the [Fe II] line has an enhanced red shoulder to the northwest of the nucleus. Again, the Pa line is redshifted relative to the [Fe II] line, so this red shoulder may correspond to a component which is associated with the Pa peak.

3.3.3 Comparison with other observations
In their nuclear spectrum which was marginally resolved spatially along a 13∘ slit, Winge et al. (2000) observed Pa and [Fe II] with similar profiles. This is in contrast to our data, where [Fe II] is clearly wider than Pa near the nucleus along a 30∘ slit. Narrowband optical imaging and spectroscopy (e.g. Corbin, Baldwin, & Wilson, 1988; Petitjean & Durret, 1993), radio imaging (Hummel & Saikia, 1991), as well as this study and that of Winge et al. indicate that NGC 4388 is a complicated system with much spatial structure at all wavelengths. Consequently, the differences in observed line profiles almost certainly arise from differences in the spatial region sampled due to slit sizes and angles as well as seeing conditions. Similarly, Winge et al. observed a [Fe II]/Pa flux ratio of 0.7, in comparison to our nuclear ratio of 0.400.03. Since we observe a rapidly changing flux ratio with position, the difference between the two measurements of the nuclear ratio may also be easily ascribed to the different spatial region sampled.
Filippenko & Sargent (1985) report a faint broad (Full Width at “Zero Intensity” of 6000 km s-1) H line on the nucleus, while Shields & Filippenko (1988; 1996) report the detection of a broad line in scattered H flux within 5′′ of the nucleus. Figures 13 and 14 show no convincing evidence of a broad Pa or Br line. The upper limit on the flux of a broad (FWHMkm s-1) Pa line on the nucleus is erg cm-2 s-1, corresponding to an upper limit in its equivalent width of m.
Petitjean & Durret (1993) report on optical spectroscopy in slits oriented at a number of position angles, including two angles, 0∘ and 60∘, which bracket our 30∘ slit. To the north and east, within 5′′ of the nucleus, the optical lines show a shallow gradient to the red with all line velocities within 100 km s-1 of the systemic velocity, consistent with the infrared emission lines. Optically, this gradient continues to the south and west, with lines more distant from the nucleus at lower velocity, in contrast to the increasing velocity seen in infrared Br and [Fe II] emission.
Based on the offset between the centroid of the IR continuum image of NGC 4388 obtained with the spectrometer in imaging mode and a star from the Hubble Guide Star Catalog 3′ away, the peak of the infrared continuum emission corresponds to the brighter, northeastern radio peak of two peaks separated by in the 4.86 GHz map of Hummel & Saikia (1991). As with Mk 1066 (section 3.1), there is a spatial correspondence in NGC 4388 between enhanced [Fe II] emission and extended radio emission. To the southwest close to the second peak of radio emission (Hummel & Saikia, 1991), the [Fe II]/Pa ratio increases to values (see Figure 15), whereas within 1′′ of the nucleus the [Fe II]/Pa ratio is . To the northeast, the [Fe II]/Pa ratio is also higher than it is on the nucleus, but is still not as large as the values to the southwest. Additionally, to the southwest the [Fe II] line profiles are most disparate from the Pa lines profiles, where the peak of the [Fe II] emission is redshifted relative to the peak of the Pa emission.
3.3.4 [Fe II] and H2 emission mechanisms
The velocity field of NGC 4388 is known to be complicated. There is a rotating disk with major axis at position angle and inclination (Petitjean & Durret, 1993). However, in addition to this, there is blueshifted gas out of the plane of the galaxy to the north and south, as well as other localized sites within 20′′ where the velocities of the gas are discrepant from pure rotation (Corbin, Baldwin, & Wilson, 1988).
In the infrared spectra, we are probably observing at least two kinematic components within 4′′ of the nucleus of NGC 4388. One kinematic component is the rotating disk, which is responsible for the velocities of the lines northeast of the nucleus, and for the velocity of the H2 line southwest of the nucleus (Figure 17). These velocities match most closely the velocities of the optical lines which Petitjean & Durret (1993) identify with the rotation curve of the galaxy. In addition to this rotating component, there may be a receding outflow to the southwest, associated with the radio emission (Hummel & Saikia, 1991). The shoulders associated with this outflow pull the Pa, Br, and [Fe II] line centroids to higher velocities than would be the case from pure rotation. The velocity difference is greater for [Fe II] than it is for Pa because of the higher [Fe II]/Pa ratio in the outflow than in the disk. This receding outflow has a higher [Fe II]/Pa ratio than the gas in the disk of the galaxy. Colina et al. (1987) observed red components in the [OIII] line profiles along a 23∘ slit; to the southwest, the mean [OIII] velocities are redshifted from the peak [OIII] velocities by 50–80 km s-1. The Br line southwest of the nucleus probably includes contributions from both the disk and outflow components. The velocities of Br here are redshifted relative to Pa, and relative to optical emission lines that correspond to the rotation of the disk. Additionally, the Br/Pa ratio is higher to the southwest than it is to the northeast (although it is highest on the nucleus). This suggests that the emission associated with the outflow is viewed through substantial extinction in the disk of the galaxy.
The [Fe II] emission also increases off the nucleus along the 120∘ slit which is perpendicular to the putative outflow axis. This increased emission does not correspond to notable differences in emission at other wavelengths. It is likely that this strong [Fe II] emission is associated with the disk of the galaxy, as it shares a similar (although not identical) velocity gradient with the other lines (Figure 18).
The H2 emission appears to be originating primarily in the disk of the galaxy, as its velocity as plotted in Figures 17 and 18 follows closely the Pa and optical line velocities identified with the rotating disk (Petitjean & Durret, 1993). The H2/Br ratio diminishes away from the nucleus along the direction of the radio emission, suggesting that the H2 emission is not associated with the radio jets or the outflow. Similar to Mk 1066, the H2/Br ratio shows a striking increase along the slit perpendicular to the outflow axis. Along this direction, the H2 emission appears to share a similar spatial structure to the [Fe II] emission. The ratios of both lines to hydrogen recombination lines (Figure 15) and the velocity curve of both lines (Figure 18) along a position angle of 120∘ share the same shape (although the H2 emission increases faster relative to Br than the [Fe II] emission does relative to Pa). The mechanism of excitation of the [Fe II] and H2 lines in the disk of NGC 4388 at radii of 150pc are probably related.
3.3.5 Summary
-
1.
Strong Pa, Br, [Fe II], and H2 emission is seen from NGC 4388. These lines are observed to be extended by along the direction of greatest extent of optical [OIII] line emission. Infrared line emission is seen extended by perpendicular to this direction.
-
2.
We identify a line at the rest wavelength of 1.252m with the infrared coronal line [S IX]. This line is only marginally spatially resolved at a position angle of 30∘. On the nucleus, its flux is 1/6 the flux of Pa.
-
3.
The [Fe II]/Pa flux ratio is lowest on the nucleus with a value of 0.4. It rises to values southwest of the nucleus where the velocity centers of the Pa and [Fe II] lines are most different, spatially coincident with a secondary peak of radio emission. The H2/Br flux ratio is highest (2-3) away from the nucleus along the 120∘ slit, perpendicular to the axis of the extended [OIII] emission. Along this direction, the H2/Br and [Fe II]/Pa ratios both increase away from the nucleus. Along the 30∘ slit, the two line ratios show opposing trends, with the H2/Br ratio increasing and the [Fe II]/Pa ratio decreasing with distance from the nucleus.
-
4.
Northeast of the nucleus, the infrared lines in NGC 4388 show structure which is similar to the optical line measured by Petitjean & Durret (1993). Southwest of the nucleus, the Br and [Fe II] lines are redshifted relative to Pa by 50–150 km s-1.
-
5.
In some cases where different lines have different velocity centroids, there is substructure suggestive that the same velocity components may be present in every line with different strengths. Specifically, southwest of the nucleus where the [Fe II] emission is redshifted relative to the Pa emission, there are enhanced blue wings in [Fe II] and enhanced red wings in Pa.
-
6.
A possible explanation for the velocity structures seen in the infrared lines is that there are at least two kinematical components. Most velocities are governed primarily by a rotating disk. There may additionally be an obscured redshifted outflow southwest of the nucleus. The coincidence of strong, redshifted [Fe II] emission to the southwest may be evidence of shock-excited [Fe II] emitting gas associated with this outflow.
3.4 Mk 3
Mk 3 is an S0 galaxy at a systemic velocity of 4046 km s-1 (Whittle et al., 1988). This gives a calculated distance of 54 Mpc, which in turn yields a spatial scale of 262 pc arcsec-1. Narrowband optical imaging with the HST in several lines include [OIII] and H shows that the NLR of the galaxy is S-shaped (Capetti et al., 1995). On small spatial scales of , the NLR is at a position angle of 86∘. On larger spatial scales of a few arcseconds, the apparent position angle of the NLR is 113∘ (Pogge & de Robertis, 1993). Radio observations at 14.9 GHz show a linear structure oriented at a position angle of 86∘ (Kukula et al., 1993). There are two radio peaks, the stronger one 1.1′′ west of the nucleus, the weaker one 0.4′′ east of the nucleus. Higher resolution maps of the source at 5 GHz resolve the linear structure into a number of components. In particular, the eastern lobe is resolved into three components aligned along the axis of the source, together with a third component coincident with the core of the galaxy. Mk 3 is also quite bright in X-rays, with an X-ray luminosity of erg s-1 (with H km s-1 Mpc-1), and a very high absorbing column of cm-2 (Awaki et al., 1990). The 0.1–2 keV X-ray source is unresolved with the ROSAT HRI on a scale of (Morse et al., 1995).
The reduced 1.29m and 2.21m spectra of Mk 3 along a 113∘ slit are plotted in Figure 20, in spatial bins along the slit separated by 1′′. The position angle of the 113∘ slit was chosen to align with the major axis of the [OIII] distribution on scales of (Mulchaey et al., 1996). The [Fe II] and Pa emission lines are visible in the 1.2m spectra, and the H2 and Br emission lines are visible in the 2.2m spectra. Note that for these observations, the Br line was centered in the K-band spectrum so that the H2 line is near the blue edge of the spectrum. This may lead to inaccuracies in placing the continuum on the blue side of the H2, resulting in underestimates of the flux of the H2 line and any blue wings in the profile of the H2 line.

The [Fe II], Pa, H2, and Br lines are extended along the slit by (1.8 kpc). The equivalent widths of the lines on the nucleus, given in Table 5 in Appendix A, are larger by a factor of than those seen in most Seyfert 2 nuclei (Knop et al., 2000).
Most of the extended line emission is characteristically narrow (FWHM km s-1), yet on the nucleus the infrared lines are quite broad (see Figure 21). The FWHM of the nuclear lines are Br 700 km s-1, Pa 1000 km s-1, and [Fe II] 1150 km s-1. These lines are also markedly asymmetric, with strong blue wings. The peak of the Pa line on the nucleus is at a velocity km s-1 greater than the centroid of the full line provile. Although [S IX] is not obvious, it could easily be hidden within the broad blue wings of the [Fe II] line profile

While the observed width of the Pa line on the nucleus is comparable to the FWHM of broad Pa lines seen in some Seyfert 1 galaxies (e.g., Knop et al., 2000), the observed line profiles in Mk 3 probably do not indicate the detection of a canonical broad line region, since [Fe II] and Pa lines are both broad and have similar profiles. Because the critical density of [Fe II] is only n, the broad [Fe II] emission cannot be produced in a high density () broad line region. Some or all of the high velocity Pa line flux is therefore probably coming from the NLR.
3.4.1 Flux Ratios
Table 5 in Appendix A lists the equivalent widths and flux ratios of the lines observed in Mk 3. Figure 22 shows the flux ratios of [Fe II]/Pa and H2/Br as a function of position along the slit. The [Fe II]/Pa ratio changes by a factor of nearly 4 along the slit. This change is a monotonic increase from east to west, although it is poorly determined 3′′ west of the nucleus due to the low signal to noise ratio in the Pa line. The H2/Br flux ratio, close to in all but one spatial bin, is relatively low for Seyfert galaxies. The H2/Br flux ratio is anomalously large 2′′ west of the nucleus. The strong, double-peaked H2 emission responsible for this enhanced flux ratio is visible in Figure 20. The higher velocity peak is unresolved, and is at a velocity of 450 km s-1 relative to the systemic velocity of Mk 3. This peak is not well detected in every individual image that goes into the summed spectrum of Mk 3, and so we suspect that this peak is an artifact associated with poor background subtraction. Because H2 at the redshift of Mk 3 falls right at the wavelength of an atmospheric OH line, the spatial bins in which the detection of H2 is of low significance may be containmated by poor subtraction of this line. If this is the case, then the H2/Br ratio would be , which is still higher than in the other spatial bins, although the caveat about background subtraction applies to the full H2 profile in this spatial bin.

3.4.2 Velocity Structure
Figure 23 shows position versus velocity plots for each of the four emission lines seen in Mk 3. A smoothed continuum has been subtracted from the data in each case. Table 9 in Appendix A lists the velocity centroids and total full widths at half maximum of the lines in each of the 1′′ spatial bins for which spectra are plotted in Figure 20.

To the east, the Pa line is narrow and stronger than any narrow Pa emission to the west. A very shallow velocity gradient at the limit of our resolution is marginally visible in this narrow component. The Pa line is redshifted by km s-1 east of the nucleus. The Br line is not as well detected as the Pa line, but appears to share a similar velocity structure, although the shallow velocity gradient is not apparent in Br. The Br line is slightly blueshifted relative to the Pa line east of the nucleus. The Pa and Br line peaks appear to share a shallow velocity decrease from east to west. The total blueshift of the lines is km s-1 west of the nucleus.
The velocity structure of the [Fe II] line to the east is different from that of the hydrogen recombination lines. To the east of the nucleus and on the nucleus, the peak of the [Fe II] line is blueshifted by 100–200 km s-1 relative to the Pa and Br lines. West of the nucleus, the velocity of the [Fe II] line is closer to that of the hydrogen recombination lines. The H2 line is not confidently detected east of the nucleus. West of nucleus by 2′′, the H2 line shows the aforementioned peculiar double-peaked shape (see Figure 20).
On the nucleus, the [Fe II], Pa, and Br lines all have qualitatively similar profiles. All three lines show strong enhanced emission to the blue of the peak. However, as is visible in Figure 21, the profiles differ in detail. In Br, the blue wing is not as strong relative to the peak as it is for Pa and [Fe II]. The peak of the [Fe II] line profile is shifted to the blue of the Pa line profile by 80 km s-1, and the FWHM of [Fe II] is about 100 km s-1 larger than the FWHM of Pa, apperently due to enhanced emission on the blue wing of [Fe II] (see Figure 21).
While the profiles to the east of the nucleus are narrow, Figure 23 clearly shows that 1–2′′ west of the nucleus the lines are broader, with the FWHM of Pa line equal to 500–600 km s-1. Figure 24 shows the profiles of the Br, Pa, and [Fe II] lines 1′′ west of the nucleus. Two features are apparent from this plot. First, the red wing of the Br line is stronger relative to the line peak than the red wing of Pa. This may indicate that there is receeding gas obscured behind dust, as the longer wavelength Br is less affected by extinction than Pa. Second, the [Fe II]/Pa ratio is largest with a value of at a redshifted velocity near km s-1. The blue hump on the Pa and [Fe II] line profiles has an [Fe II]/Pa ratio of about 1, close to the nuclear flux ratio (see section 3.4.1).

3.4.3 Comparison with Other Observations
The velocity gradient seen in the off-nuclear narrow Pa line is generally consistent with the rotation curve seen in optical H and [OIII] emission by Whittle et al. (1988). However, the optical slit position angle is 86∘, while the infrared data presented here was obtained through a slit at a position angle of 113∘. East of the nucleus, the [OIII] line peaks at 120 km s-1, while west of the nucleus it peaks at -120 km s-1, similar to the limiting off-nuclear velocities of km s-1 in the infrared lines. Whittle et al. (1988) also saw an increase in the FWHM of the optical H and [OIII] lines near the nucleus, similar to that seen in the Pa, Br, and [Fe II] lines. This broader emission is blueshifted relative to the peak of the lines, again consistent with that seen in the infrared lines. In addition, a red wing in the [OIII] and H profiles is similar to the enhanced red emission seen in the Br and [Fe II] lines in Figure 24, which was also strongest 1′′ west of the nucleus. A Gaussian decomposition of the optical lines placed the relative velocity of the redshifted component at km s-1; our Gaussian decomposition of the infrared lines places the velocity of the reddened component of the infrared lines at somewhat higher velocity, closer to km s-1, although this is uncertain given the complex blended line profiles (see Figure 24).
The spatial location of this red wing is coincident with the stronger of two radio peaks seen at 2cm (Kukula et al., 1993). The relatively high extinction seen for this reddened component in the infrared Br and Pa lines is consistent with the picture of this radio peak as a lobe coincidental with a receding outflow of ionized gas which is obscured behind the plane of the galaxy. The weaker radio lobe is 0.4′′ east of the nucleus along the same position angle. Whittle et al. (1988) do not identify any component in the optical spectra with the eastern radio lobe. However, the enhanced blue wings seen on the nucleus in both the infrared and [OIII] emission lines may be part of an approaching outflow associated with the eastern radio lobe.
3.4.4 [Fe II] and H2 Emission Processes
As with Mk 1066 and NGC 4388, and to a lesser extent NGC 2110, the [Fe II] emission in Mk 3 shows spatial correlations with the radio emission which suggests that processes involving the radio jet’s interaction with circumnuclear gas are significantly enhancing the [Fe II] emission. West of the nucleus at the position of the western radio peak, the [Fe II] line shows enhanced redshifted emission, which is also seen in the Pa and Br lines as well as in the optical lines (Whittle et al., 1988). At the position of this radio peak west of the nucleus, the [Fe II]/Pa ratio is higher than it is to the east of the nucleus where the radio emission is much weaker. This enhanced redshifted emission 1′′ west of the nucleus also has a larger Br/Pa flux ratio, suggesting higher extinction to the region which is the source of the enhanced [Fe II] emission. This is consistent with the picture of the region as a receding outflow which is partially obscured by the galactic disk.
The eastern radio peak is too close (0.4′′) to the nucleus to distinguish infrared line emission spatially coincident with it from emission directly from the nucleus. However, if the two knots of radio emission represent the radio lobes associated with a biconical outflow, the enhanced blue wings in the infrared and optical lines on the nucleus may in fact be correlated with the second radio lobe. Higher resolution 5 GHz maps of Mk 3 (Kukula et al., 1993) resolve the eastern lobe into a number of individual linearly spaced components. The infrared lines near the nucleus show a complicated, evidently multi-component structure in velocity (see Figure 20). The multi-component spatial nature of the radio emission and the multiple velocity components in the infrared line emission suggest the identification of the broad blue wings on the infrared lines near the nucleus with the eastern radio lobe. The [Fe II] emission on the nucleus is blueshifted relative to the Pa emission, suggesting that the [Fe II]/Pa flux ratio may be enhanced at the position of the eastern radio peaks. Given this spatial correspondence, it is likely that the [Fe II] emission is enhanced by fast shocks resulting from the interaction of the radio jet and the circumnuclear gas.
Except for the anomalously high value 2′′ west of the nucleus, the H2/Br ratio is lower in Mk 3 than it is in most Seyfert galaxies. West of the nucleus, the narrow Pa and perhaps Br emission may be associated with the rotation of a galactic disk, based on similarities with optical lines (Whittle et al., 1988). At these positions, the H2 emission is suppressed relative to the Br emission, indicating that Mk 3 continues relatively little warm molecular gas.
3.4.5 Summary
-
1.
At a position angle of 113∘, the infrared line emission is observed to be extended by .
-
2.
There is a FWHM1000 km s-1 blue wing visible on the nucleus of Mk 3, most most prominent in [Fe II] and Pa but also seen in Br. There is a red wing on the line profiles, arising from a region of relatively high extinction, west of the nucleus. This red wing corresponds to a redshifted component seen in optical emission (Whittle et al., 1988). Both wings are spatially consistent with the position of two radio peaks (Kukula et al., 1993).
-
3.
The Pa and Br narrow line peaks may follow a barely resolved smooth velocity gradient which lies at km s-1 east of the nucleus and km s-1 west of the nucleus. East of the nucleus, the Br line is marginally blueshifted relative to Pa. The [Fe II] emission is blueshifted relative to the Pa emission both east of the nucleus, and significantly so on the nucleus.
-
4.
The [Fe II]/Pa flux ratio monotonically increases from to over 5′′ from east to west across the nucleus. The H2/Br flux ratio is close to everywhere except where it is anamalously high, possibly as a result of an artifact, 2′′ west of the nucleus.
We suggest that emission associated with an outflow of ionized gas contributes significantly to the infrared line emission in Mk 3. The [Fe II]/Pa ratio is enhanced in components identified with this outflow and coincident with the 2cm radio lobes, suggesting a possible shock contribution to the [Fe II] emission. The low H2/Br ratio indicates that in contrast to other Sefyert galaxies, the circumnuclear disk is relatively depleted in warm molecular gas.
4 General Discussion
4.1 [Fe II] Emission Processes
One obvious conclusion from the data presented here is that the [Fe II]/Pa ratio in Seyfert galaxies varies significantly with position on scales of . Of the four galaxies observed, each showed a different dependence of [Fe II]/Pa on position, whether it is monotonically increasing across the nucleus (Mk 3), highest at the nucleus (NGC 2110), lowest at the nucleus (NGC 4388), or close to constant with point-to-point variations (Mk 1066). These data show that flux ratios integrated over large nuclear beams may be of limited value for drawing conclusions about the excitation processes of the infrared lines. The flux ratios are observed to vary significantly on scales of pc, and to show significant velocity structure.
Circumnuclear starbursts and processes associated with the central AGN directly have both been implicated in the generation of [Fe II] emission lines seen in Seyfert galaxies (e.g., Moorwood & Oliva, 1988; Mouri et al., 1993). Our data in general support the active nucleus as the power source of [Fe II] in the Seyfert galaxies. Despite the differences in the details of the velocity structure of the infrared lines, the velocity gradients of [Fe II] tend to match those of Pa and Br. The [Fe II] line can generally be kinematically associated with other spectral features linked with the nuclear activity (e.g., [OIII]), or sites of enhanced radio emission. The one exception is the extended [Fe II] emission along position angle 120∘ in NGC 4388.
There are two primary proposed mechanisms for [Fe II] emission associated with the AGN itself. Because the ionization potential of Fe+ is only 16.2 eV, the [Fe II] line will be strong in partially ionized regions. If clouds illuminated by the Seyfert nucleus have a high enough column density, only the side of the cloud facing the nuclear ionizing source will be fully ionized. Because the ionization cross section for high-energy X-rays is relatively small, X-rays can penetrate deeply into these dense clouds, creating large warm partially ionized regions suitable for [Fe II] emission (Graham et al., 1990). Fast shocks can also produce partially ionized regions heated to 6000 K (Shull & Draine, 1987). Models indicate that these shocks may also destroy dust grains (Seab & Shull, 1983). Because much of the iron in the local interstellar medium is locked up in dust grains, the destruction of those grains would enhance the gas phase Fe abundance, thereby increasing the infrared [Fe II] emission.
Simpson et al. (1996b) report a slightly stronger correlation between infrared [Fe II] and 6cm radio emission than between Pa and 6cm emission. Based on the difference in the correlations, Simpson et al. conclude that % of the [Fe II] emission in Seyfert galaxies is due to the action of fast shocks, and that the bulk of it is due to X-ray photoionization.
The data presented here for Mk 1066, NGC 2110, NGC 4388, and Mk 3, combined with the calculations of Simpson et al., provide spatial and kinematic evidence that indicate that X-ray photoionization is responsible for most of the [Fe II] emission, but that the [Fe II] emission is probably enhanced in some places by a contribution from shocks. In most cases the [Fe II] emission tends to be spatially associated with the Pa emission, and the primary component of [Fe II] often shares the same velocity structure as the Pa line. Thus, most of the [Fe II] emission probably comes from gas physically and kinematically associated with the NLR, as traced by the Pa emission. Except for the nucleus of NGC 2110, the flux ratios observed at various positions in the galaxies are within the range of those seen in the spectra of Simpson et al..
While the bulk of the [Fe II] appears to be photoionized, there are clear signatures of local enhancements of the [Fe II] emission from shocks associated with the expanding radio plasma. In all four of the galaxies, spectral features were identified in the [Fe II] emission line profile which occured at or near the position of peaks in the non-thermal radio emission. In many cases, these features showed relatively high [Fe II]/Pa ratios. In Mk 3 and NGC 4388, the [Fe II] emission was enhanced relative to the Pa emission, or showed the largest kinematical differences from the Pa emission, at positions spatially coincident with radio peaks. This suggests that processes associated with radio jets are contributing measurably to the [Fe II] emission. The most probable explanation of this is fast shocks resulting from the interaction of outflowing radio plasma with the circumnuclear gas.
4.2 H2 Emission Processes
Molecular hydrogen emission can result from ultraviolet fluorescence of hydrogen molecules in photodissociation regions illuminated by photons from OB stars or by a nuclear UV continuum source. Alternatively, the H2 emission may be excited thermally, through either slow (v km s-1) shocks (Shull & Draine, 1987), or through X-ray heating of dense molecular clouds (Draine & Woods, 1990). Observations of the flux ratio between H2 (=1–0 S(1)) (=2.1212m) and H2 (=2–1 S(1)) (2.2471m) rule out ultraviolet fluorescence as a significant mechanism in most Seyfert galaxies (Moorwood & Oliva, 1990).
In all four of the galaxies discussed here, we have identified features in [Fe II] and hydrogen recombination line profiles which we associate with outflows or other interactions with radio lobes and jets. Except for NGC 2110, these features are weaker or invisible in the H2 line profile; the kinematics of the H2 are usually better explained by galactic rotation. In addition, in those two galaxies where we have data perpendicular to the outflow axis (Mk 1066 and NGC 4388), and possibly as well in NGC 2110 (S99), the H2 is significantly more extended than the atomic hydrogen recombination lines, with the H2/Br flux ratio increasing by a factor of 4 or more at 200–300 pc away from the nucleus.
Although X-ray heating of molecular clouds that cross into the ionization cones can give rise to the extended H2 emission along the cone axes, it is unlikely that the nucleus is responsible for the enhanced H2 emission along the axis perpendicular to the cones. According to the standard model of Seyfert galaxies, the radiation from the central source is obscured except along the axis of the ionization cones; thus, nuclear X-rays cannot penetrate significantly into the gas perpendicular to the cone axis to produce the extended H2 emission. While these X-rays would heat the inner face of the obscuring molecular torus, the size of that torus is believed to be on the order of a few parsecs, so this cannot explain the extended H2 emission that we observe. Also, if molecular hydrogen emission does emerge from photodissociation regions heated by X-rays from a central source, we would expect strong Br emission illuminated by ultraviolet radiation from the same central source.
Shocks driven directly or indirectly by the nucleus are another possible explanation for the excitation of the H2 emission. Slow shocks moving through high density molecular clouds in the disk of the galaxy could excite molecular hydrogen emission. Where the shocks encounter lower density clouds, they should be faster, and produce substantial [Fe II] emission. The [Fe II]/Pa ratio does rise with distance from the nucleus, at least initially, perpendicular to the primary direction of extended high-excitation gas in both Mk 1066 and NGC 4388 . Alternatively, secondary shocks in molecular clouds circumscribing radio outflows might give rise to enhanced H2 emission. This process might produce the differing [Fe II] and H2 spatial morphologies observed in NGC 1068 by Blietz et al. (1994). One problem with this scenario is that, in contrast to the axis of ioniziation cones where outflowing radio plasma may drive shocks into the surrounding gas, there is no obvious mechansim to drive shocks to distances of 1 kpc perpendicular to the cone axis.
The relatively large extent of the H2 emission perpendicular to the ionization cones in Mk 1066 and NGC 4388 suggest that there are local source of heating which is giving rise to much of the H2 emission. In both galaxies, there may be contribution to the H2 emission from young stars heating molecular clouds. While this may contribute to the H2 emission, it is unlikely to be the only source, as the H2/Br ratios observed in the extended H2 gas tend to be higher than the values typically observed in starburst galaxies (Moorwood & Oliva, 1988, 1990; Kawara et al., 1988). NGC 4388 has a bar oriented at position angle (Corbin, Baldwin, & Wilson, 1988). Dynamical processes associated with this bar may be creating shocks which give rise to the observed H2 emission. In Mk 1066, it is also possible that the bulk motions of clouds which do not move completely with the rotation of the disk are colliding with other clouds, creating slow shocks which excite the cold molecular gas. In Mk 3, the lower H2/Br ratio combined with the narrower H2 line profile suggest that local star formation activity may be able to explain most of the H2 emission, with no need for a contribution from outflowing gas associated with the nucleus. By contrast, in NGC 2110, where wings associated with the outflow are seen in H2, nuclear X-ray heating may be a more significant contributor.
5 Summary and Conclusions
-
1.
We have observed strong infrared Pa, Br, [Fe II], and H2 line emission which is spatially extended on scales of a few hundred parsecs in Mk 1066, NGC 2110, NGC 4388, and Mk 3.
-
2.
We have detected the near infrared coronal line [S IX] (=1.2525m) in the nucleus of NGC 4388. In contrast to the other infrared lines, this line is only marginally spatially extended. There is no apparent [S IX] emission from Mk 1066, NGC 2110, or Mk 3. This is similar to what is seen optically, that high ionization species are visible in some but not all Seyfert galaxies.
-
3.
While often showing similar velocity trends over the central few arcseconds, the [Fe II], H2, and H lines have profiles which differ in detail from each other over the full spatial range probed by these observations. The peaks of lines are shifted relative to each other at some spatial positions in some galaxies, and some species show enhanced blue and red wings relative to other species. These differences are usually due to the effects of extinction, an enhancement to the [Fe II] emission associated with other indicators of the action of an outflow, or a possible local source of heating of H2.
-
4.
The [Fe II]/Pa and H2/Br flux ratios can vary dramatically on scales of 102 pc near the nuclei of Seyfert 2 galaxies. The details of the spatial structure of the [Fe II]/Pa ratio frequently support the notion that partially ionized regions created by X-ray photoionization from the nucleus, or shocks from the interaction of outflowing gas with ambient gas, or both, are enhancing the circumnuclear [Fe II] emission. The spatial variation of the H2/Br ratio is again frequently ascribable to local heating of H2.
-
5.
The [Fe II] emission appears to be associated with the nuclear activity, not requiring the invocation of a circumnuclear starburst in any of these four galaxies. The [Fe II] can be kinematically and spatially linked to processes dominated by the active nucleus. In all of these galaxies, there are correlations between features in the [Fe II] emission and both radio jets and optically identified outflows, suggesting that some [Fe II] emission is produced by fast shocks resulting from interactions between radio jets and circumnuclear gas.
-
6.
The H2 emission, although peaked on the nucleus, is relatively strong compared to hydrogen recombination and [Fe II] emission perpendicular to the axis of ionization cones or the major axis of high-excitation gas in Mk 1066 and NGC 4388. The spatial distribution and line profile of H2 generally differs from that of [Fe II]. A local source such as bar-driven shocks or circumnuclear star formation may be partially responsible for the H2 emission in these galaxies.
Appendix A Measurements of Equivalent Widths, Fluxes, and Line Ratios
In this appendix are tables with data from the infrared spectra of Mk 1066, NGC 2110, NGC 4388, and Mk 3. Tables 2 through 5 list the equivalent widths for the integrated line profile for each species observed in each spatial bin. They additionally list relevant flux ratios. Tables 6 through 9 give the centroids and line widths (FWHM) for each species in each spatial bin.
Equivalent Width (10m) Flux Ratios Posa (′′) [Fe II] Pa H2 Br [Fe II]/Pa H2/Br Mk 1066, 135∘ slit 2.67 6.74.5 17.112.4 … … 0.430.14 … 2 4.71.7 5.81.9 4.01.9 4.3 0.790.21 0.87 1.33 18.43.2 15.32.6 9.42.0 10.32.7 1.170.08 0.860.09 0.67 23.02.6 29.02.6 12.61.7 18.72.8 0.750.03 0.630.05 0 20.81.9 27.42.1 13.01.2 14.01.5 0.750.04 0.890.06 -0.67 39.03.8 33.04.6 17.82.6 20.63.8 1.200.04 0.850.06 -1.33 21.63.4 23.24.6 9.02.7 16.76.3 0.990.05 0.560.09 -2 5.32.2 6.72.5 4.4 11.56.1 0.850.17 0.40 Mk 1066, 45∘ slit 1.33 5.01.3 4.21.1 13.05.3 2.7 1.300.32 4.41 0.67 11.21.6 10.31.3 12.62.7 6.71.1 1.060.09 1.740.21 0 17.21.4 29.12.7 11.51.5 13.71.4 0.570.03 0.760.06 -0.67 15.92.6 17.92.7 12.62.3 10.02.0 0.870.07 1.210.10 -1.33 5.21.4 8.92.6 9.04.0 4.7 0.640.16 1.83 -2 … … 5.63.7 5.3 … 0.91
Positive positions are towards the position angle of the slit as quoted.
Equivalent Width (10m) Flux Ratios Posa (′′) [Fe II] Pa H2 Br [Fe II]/Pa H2/Br 3 3.51.0 3.30.8 3.81.3 2.10.9 1.090.25 1.890.78 2 6.21.3 2.90.7 7.21.4 1.90.6 2.190.42 4.081.08 1 15.41.4 3.10.5 6.20.8 2.00.4 5.020.48 3.230.53 0 24.71.6 3.10.4 4.80.4 1.60.3 8.110.78 3.170.63 -1 22.52.3 3.20.5 6.60.7 2.00.4 7.360.74 3.590.69 -2 11.72.3 2.80.6 8.41.7 1.40.4 4.430.53 6.501.50 -3 8.72.0 3.10.9 5.51.2 2.81.0 2.930.54 2.140.51 -4 5.82.8 2.7 3.61.5 9.7 2.24 0.39
Positive positions are toward the southeast at a position angle of 160∘.
Equivalent Width (10m) Flux Ratios Posa (′′) [Fe II] Pa H2 Br [S IX] [Fe II]/Pa H2/Br [S IX]/Pa NGC 4388, 30∘ slit 4 22.819.1 19.014.9 7.4 13.012.8 … 0.990.25 0.67 … 3 15.59.5 18.29.1 7.0 13.39.9 … 0.710.17 0.57 … 2 13.46.0 26.17.0 6.53.1 12.76.7 … 0.470.08 0.560.13 … 1 7.71.9 25.75.5 13.64.1 12.73.2 3.61.0 0.280.03 1.050.15 0.130.02 0 11.21.7 26.34.2 9.51.2 10.61.5 4.50.8 0.400.03 0.880.08 0.160.02 -1 18.84.6 32.26.8 8.41.6 17.13.9 2.40.8 0.570.04 0.510.06 0.070.01 -2 31.09.4 26.87.4 6.32.7 14.76.5 … 1.130.11 0.460.09 … -3 29.711.8 17.87.1 6.13.6 13.610.5 … 1.640.22 0.490.14 … -4 12.56.6 4.82.7 6.9 11.7 … 2.520.84 … … NGC 4388, 120∘ slit 2 9.02.5 4.01.3 12.45.3 4.9 … 2.180.53 2.29 … 1 12.72.1 16.83.1 14.12.9 9.42.0 … 0.720.07 1.390.18 … 0 11.51.4 24.12.7 8.41.1 11.61.8 4.40.6 0.460.03 0.670.07 0.170.01 -1 10.12.0 19.93.5 19.64.6 8.01.7 … 0.500.05 2.340.25 … -2 8.93.0 7.22.2 18.05.9 3.21.5 … 1.260.24 5.231.60 …
Positive positions are towards the position angle of the slit as quoted.
Equivalent Width (10m) Flux Ratios Posa (′′) [Fe II] Pa H2 Br [Fe II]/Pa H2/Br 3 11.64.3 24.58.6 5.84.2 12.08.4 0.470.10 0.490.24 2 13.03.5 17.74.7 … 4.01.4 0.740.12 … 1 37.64.2 31.33.5 3.41.2 11.52.6 1.170.07 0.290.11 0 52.25.1 39.33.2 5.30.7 16.72.1 1.240.04 0.310.04 -1 46.36.2 26.43.0 4.60.8 12.82.2 1.720.08 0.350.05 -2 17.95.7 9.52.9 13.14.5 4.41.6 1.880.43 2.940.54 -3 17.67.7 4.31.7 … … 3.751.15 …
Positive positions are east towards the 113∘ position angle of the slit.
[Fe II] Pa H2 Br Posa Centroidb FWHMc Centroid FWHM Centroid FWHM Centroid FWHM ′′ km s-1 km s-1 km s-1 km s-1 km s-1 km s-1 km s-1 km s-1 Mk 1066, 135∘ slit 2.67 -11824 -23341 677194 … … … … 2 -6825 267109 -5820 22183 -7235 … … 1.33 -5914 29453 -7719 -4515 32846 -9019 38334 0.67 -3814 24032 -6714 -4515 32150 -7318 23746 0 -12516 29641 -2015 20550 313 35329 -1918 32927 -0.67 -5414 28954 5114 8913 22337 5119 26932 -1.33 -815 34162 3216 16774 14320 36078 7020 30844 -2 10918 21875 7018 20265 … … 13346 715196 Mk 1066, 45∘ slit 1.33 -3417 22273 -5019 17993 -615 49159 … … 0.67 -5214 17952 -2010 -1211 39235 -4317 42962 0 -7412 17938 -4113 -1412 19261 -8317 25044 -0.67 -5415 21946 -2411 -2110 27733 -4914 31351 -1.33 -1019 24783 6449 3918 32982 … … -2 … … … … 10723 … …
| Positive position is towards the position angle of the slit as quoted. | |
| Centroids are relative to 3625 km s-1, the systemic velocity of Mk 1066. | |
| The resolution has been subtracted in quadrature. |
[Fe II] Pa H2 Br Posa Centroidb FWHMc Centroid FWHM Centroid FWHM Centroid FWHM ′′ km s-1 km s-1 km s-1 km s-1 km s-1 km s-1 km s-1 km s-1 3 21218 21988 29911 29229 223132 37545 2 11715 33444 22613 21321 20336 213169 1 -49 37336 1168 21341 15218 27535 16027 25992 0 -8610 49634 -410 33843 3218 35936 6233 391116 -1 -688 38325 -499 18651 -5217 27334 4831 304111 -2 -11411 17154 -849 17653 -1420 23852 -9531 -3 -15610 19731 -12615 20382 -11219 20561 -6935 313136 -4 -20720 34787 … … -542 546226 … …
| Positive position is southeast along the 160∘ slit. | |
| Centroids are relative to 2342 km s-1, the systemic velocity of NGC 2110. | |
| The resolution has been subtracted in quadrature. |
[Fe II] Pa H2 Br [S IX] Posa Centroidb FWHMc Centroid FWHM Centroid FWHM Centroid FWHM Centroid FWHM ′′ km s-1 km s-1 km s-1 km s-1 km s-1 km s-1 km s-1 km s-1 km s-1 km s-1 NGC 4388, 30∘ slit 4 1820 35360 6020 19275 … … 10953 454237 … … 3 3537 4516 33464 … … 3533 424139 … … 2 3823 44394 210 20630 8021 197114 118 28471 … … 1 -213 24942 411 16840 4814 33853 714 28652 -7017 0 -4217 47967 -1212 24943 810 30634 615 -528 -1 -5112 60634 -2111 36648 -6011 31640 2335 40384 -11022 20495 -2 5212 62431 1228 32162 -6319 27286 -3815 39253 … … -3 7617 19564 1618 38370 -5027 278173 15829 52498 … … -4 13822 35791 2427 … … … … … … NGC 4388, 120∘ slit 2 3423 601103 4919 21881 316 25380 … … … … 1 1021 62475 9120 29154 210 22134 5617 40441 … … 0 2813 38060 545 26756 -411 21140 5416 28662 -2911 20136 -1 1417 332100 476 33320 -379 28430 7115 33158 … … -2 1321 252140 113 24067 -4212 249442 6734 … …
| Positive position is towards the position angle of the slit as quoted. | |
| Centroids are relative to 2525 km s-1, the systemic velocity of NGC 4388. | |
| The resolution has been subtracted in quadrature. |
[Fe II] Pa H2 Br Posa Centroidb FWHMc Centroid FWHM Centroid FWHM Centroid FWHM ′′ km s-1 km s-1 km s-1 km s-1 km s-1 km s-1 km s-1 km s-1 3 1926 382105 7312 20065 7260 2428 265145 2 -4416 36751 -5836 255125 … … 7423 1 -36319 1165102 -30614 1201122 -2279 710335 -15346 899210 0 -19013 113741 -10911 99146 -249 63999 -1521 564169 -1 5413 50156 -413 69553 8134 12719 44685 -2 16216 39483 -8461 532220 16532 745430 318 -3 -7745 1117248 -7521 … … … …
| Positive position is east towards the 113∘ position angle of the slit. | |
| Centroids are relative to 4046 km s-1, the systemic velocity of Mk 3. | |
| The resolution has been subtracted in quadrature. |
References
- Awaki et al. (1990) Awaki, H., Koyama, K., Kunieda, A., and Tawara, Y., 1990, Nature, 346, 544
- Blietz et al. (1994) Blietz, M., Cameron, M., Drapatz, S., Genzel, R., Krabbe, A., van der Werf, P., Sterberg, A., and Ward, M., 1994, ApJ, 421, 92
- Bower et al. (1995) Bower, G., Wilson, A., Morse, J.A., Gelderman, R., Whittle, M., and Mulchaey, J., 1995, ApJ, 454, 106
- Capetti et al. (1995) Capetti, A., Macchetto, F., Axon, D.J., Sparks, W.B., and Boksenberg, A., 1995, ApJ, 448, 600
- Colina et al. (1987) Colina, L., Fricke, K.J., Kollatschny, W., and Perryman, M.A.C., 1987, A&A, 186, 39
- Corbin, Baldwin, & Wilson (1988) Corben, M.R., Baldwin, J.A., and Wilson, A.S., 1988, ApJ, 334, 584
- de Vaucouleurs et al. (1991) de Vaucoulers, G., de Vaucouleurs, A., Corwin Jr., H.G., Buta, R.J., Paturel, G., and Fouque, P., 1991, “Third Reference Catalogue of Bright Galaxies, Version 3.9,” Springer-Verlag
- Draine & Woods (1990) Draine, B.T., and Woods, D.T., 1990, ApJ, 363, 464
- Filippenko & Sargent (1985) Filippenko, A.V., and Sargent, W.L.W., 1985, ApJS, 57, 503
- Forbes and Ward (1993) Forbes, D.A., and Ward, M.J., 1993, ApJ, 416, 150
- Genzel et al. (1995) Genzel, R., Weitzel, L., Tacconi-Garman, L.E., Blietz, M., Cameron, M., Krabbe, A., and Lutz, D., 1995 ApJ, 444, 129
- Goodrich et al. (1994) Goodrich, R.W., Veilleux, S., and Hill, G.J., 1994, ApJ, 422, 521
- Graham et al. (1990) Graham, J.R., Wright, G.S., and Longmore, A.J., 1990, ApJ, 352, 172
- Hanson et al. (1990) Hanson, C.G., Skinner, G.K., Eyles, C.J., and Willmore, A.P., 1990, MNRAS, 242, 262
- Helou et al. (1980) Helou, G., Salpeter, E.E., and Krumm, N., 1979, ApJ, 228, L1
- Hummel & Saikia (1991) Hummel, E., and Saikia, D.J., 1991, A&A, 249, 43
- Kawara et al. (1988) Kawara, K., Nishida, M., and Taniguchi, Y., 1988, ApJ, 328, L41
- Knop et al. (1996) Knop, R.A., Armus, L., Larkin, J.E., Matthews, K., Shupe, D.L., and Soifer, B.T., 1996, AJ, 112, 81
- Knop (1997) Knop, R.A., 1997, PhD Thesis, The California Institute of Technology
- Knop et al. (2000) Knop, R.A., Armus, L., Matthews, K., Murphy Jr., T.W., and Soifer, B.T., 2000, in preparation
- Kriss et al. (1980) Kriss, G.A., Canizares, C.R., and Ricker, G.R., 1980, ApJ, 242, 492
- Kuhn, Penn, & Mann (1996) Kuhn, J.R., Penn, M.J., and Mann, I., 1996, ApJ, 456, L67
- Kukula et al. (1993) Kukula, M.J., Ghosh, T., Pedlar, A., Schilizzi, R.T., Miley, G.K., de Bruyn, A.G., and Saikia, D.J., 1993, MNRAS, 264, 893
- Larkin et al. (1996) Larkin, J.E., Knop, R.A., Lin, S., Matthews, K., and Soifer, B.T., 1996, PASP, 108, 211
- Maiolino, Rieke, & Rieke (1996) Maiolino, R., Rieke, G.H., and Rieke, M.J., 1996, AJ, 111, 537
- Matt et al. (1994) Matt, G., Piro, L., Antonelli, L.A., Fink, H.H., Meurs, E.J.A., and Perola, G.C., 1994, A&A, 292, L13
- Moorwood & Oliva (1988) Moorwood, A.F.M., and Oliva, E., 1988, A&A, 203, 278
- Moorwood & Oliva (1990) Moorwood, A.F.M., and Oliva, E., 1990, A&A, 239, 78
- Moorwood & Oliva (1994) Moorwood, A.F.M., and Oliva, E., 1994, Infrared Phys. Technol, 35,349
- Morse et al. (1995) Morse, J.A., Wilson, A.S., Elvis, M., and Weaver, K.A., 1996, ApJ, 439, 121
- Mouri et al. (1993) Mouri, H., Kawara, K., and Taniguchi, Y., 1993, ApJ, 406, 52
- Mulchaey et al. (1994) Mulchaey, J.S., Wilson, A.S., Bower, G.A., Heckman, T.M., Krolik, J.H., and Miley, G.K., 1994, ApJ, 433, 625
- Mulchaey et al. (1996) Mulchaey, J.S., Wilson, A.S., and Tsvetanov, Z., 1996, ApJS, 102, 309
- Oliva et al. (1994) Oliva, E., Salvati, M., Moorwood, A.F.M., and Marconi, A., 1994, A&A, 288, 457
- Osterbrock (1988) Osterbrock, D.E., 1988, “Astrophysics of Gaseous Nebulae and Active Galactic Nuclei,” University Science Books
- Pedlar et al. (1985) Pedlar, A., Dyson, J.E., and Unger, S.W., 1985, MNRAS, 214, 463
- Petitjean & Durret (1993) Petitjean, P., and Durret, F., 1993, A&A, 277, 365
- Pierce & Tully (1988) Pierce, M.J., and Tully, R.B., 1988, ApJ, 330, 579
- Pogge & de Robertis (1993) Pogge, R.W., and de Robertis, M.M., 1993, ApJ, 404, 563
- Reichert et al. (1985) Reichert, G.A., Mushotzky, R.F., Petre, R., and Holt, S.S., 1985, ApJ, 296, 69
- Robbins (1968) Robbins, R.R., 1968, ApJ, 151, 497
- Rudy et al. (1993) Rudy, R.J., Cohen, R.D., Rossano, G.S., Erwin, P., Puetter, R.C., Greenhouse, M.A., and Woodward, C.E., 1993, ApJ, 414, 527
- Seab & Shull (1983) Seab and Shull, 1983, ApJ, 275, 652
- Shields & Filippenko (1988) Shields, J.C., and Filippenko, A.V., 1988, ApJ, 332, L55
- Sheilds & Filippenko (1996) Shields, J.C., and Filippenko, A.V., 1996, A&A, 311, 393
- Shull & Draine (1987) Shull, J.M., and Draine, B.T., in Hollenbach, D.J., and Thronson, H.A., Jr., 1987, “Interstellar Processes”, D. Reidel Publishing Company, 283
- Simpson et al. (1996b) Simpson, C., Forbes, D.A., Baker, A.C., and Ward, M.J., 1996, MNRAS, 283, 777
- Storchi-Bergmann et al. (1999) Storchi-Bergmann, T., Winge, C., Ward, M. J., and Wilson, A. S., 1999, MNRAS, 304, 35 (S99)
- Taylor, Dyson, & Axon (1992) Taylor, D., Dyson, J.E., and Axon D.J, 1992, MNRAS, 255, 351
- Thompson (1995) Thompson, R.I., 1995, ApJ, 445, 700
- Ulvestad & Wilson (1984) Ulvestad, J.S., and Wilson, A.S., 1984, ApJ, 285, 439
- Ulvestad & Wilson (1989) Ulvestad, J.S., and Wilson, A.S., 1989, ApJ, 343, 659
- Veilleux, Goodrich, & Hill (1997) Veilleux, S., Goodrich, R.W., and Hill, G.J., 1997, ApJ, 477, 631
- Weaver et al. (1995) Weaver, K.A., Mushotzky, R.F., Serlemitsos, P.J., Wilson, A.S., Elivs, M., and Briel, U., 1995, ApJ, 442, 597
- West et al. (1985) West, R.C., Astle, M.J., and Beyer, W.H., eds., 1985, “CRC Handbook of Chemistry and Physics,” 66th ed., CRC Press, Inc., Boca Raton, FL
- Whittle et al. (1988) Whittle, M., Pedlar, A., Meurs, E.J.A., Unger, S.W., Axon, D.J., and Ward, M.J., 1988, ApJ, 326, 125
- Wilson & Baldwin (1985) Wilson, A.S., and Baldwin, J.A., 1985, ApJ, 289, 124
- Wilson et al. (1985) Wilson, A.S., Baldwin, J.A., and Ulvestad, J.S., 1985, ApJ, 291, 627
- Wilson & Tsvetanov (1994) Wilson, A.S., and Tsvetanov, Z.I., 1994, AJ, 107, 1227
- Winge et al. (2000) Winge, C., Storchi-Bergmann, T., Ward, M. J., and Wilson, A. S., 2000, MNRAS, in press