Is Cold Dark Matter Still a Strong Buy? The Lesson from Galaxy Clusters
Abstract
For the last few years the Cold Dark Matter model (ticker: CDM), has been the dominant theory of structure formation. We briefly review the recent advancements and predictions of the model in the field of galaxy clusters. A new set of very high resolution simulations of galaxy clusters show that they have (1) density profiles with central slopes very close to and (2) abundance of subhalos similar to the ones observed in real clusters. These results show a remarkably small cluster to cluster variation and a weak dependence from the particular CDM cosmology chosen (LCDM having less substructure than SCDM). While still a speculative theory with a high prediction/evidence ratio, subject to strong challenges from observational data and competition from other hierarchical theories, we give CDM a rating of “market outperform” and of “long term BUY”.
Osservatorio Astronomico di Brera, Milan, Italy (fabio@merate.mi.astro.it)
Astronomy Department, University of Washington, Seattle, WA, USA
Physics Department, University of Durham, Durham, UK
1. Introduction
Introduced in the early ’80s (Peebles 1984; Davis et al. 1985), Cold Dark Matter has rapidly become the dominant model within the hierarchical clustering framework. Repeat the mantra with us: “in this theory primordial density fluctuations collapse and merge continuously under the effect of gravitational instability to form more and more massive structures”.
One of the most appealing features of CDM is its ability to give a solid framework to provide predictions on the astrophysical properties of cosmological objects, as the number density as a function of mass and redshift and their clustering properties. All on a range of more than 10 orders of magnitude in mass and from redshift to the present.
Not bad.
Being the most massive self bound objects in the Universe, galaxy clusters have received lots of attention, both on the theoretical and the observational side. Statistical properties of the cluster population can be obtained using numerical simulations and/or semi-analytical methods (Governato et al. 1999; Jenkins et al. 2001; Sheth, Mo, & Tormen 2001; but it all started with Press & Schechter 1974). Cool stuff; however this short review focuses on recent results obtained using -body simulations on the internal structures of clusters within the CDM framework.
2. Is CDM the dominant theory for cosmic structure formation?
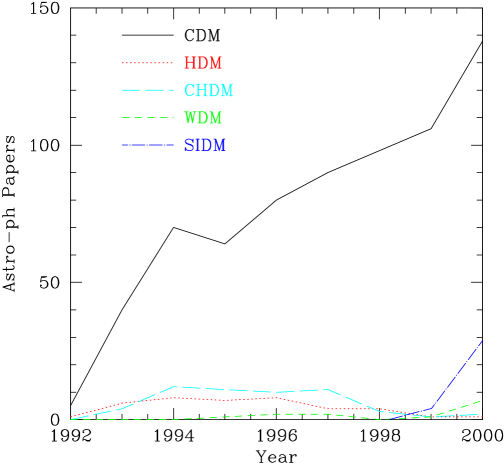
As with business companies, there are many, often fuzzy, ways to evaluate the “dominant position” of a theory like influential papers, citations, number of people involved. For CDM a readily available estimate is the number of papers submitted to the arXiv.org e-print archive (Greenspan, ehm Ginsparg 1996) in the “astro-ph” section. Simple, but fair compared to pro forma earnings, registered users or web page hits often used to evaluate some of Nasdaq’s (ex) darlings’ performance. Clearly these data show that CDM is the most widely used cosmological theory for structure formation (see Figure 1) at least compared to other dark matter models.
The number of papers with the word CDM in the abstract has grown at a compound rate of about 15% per year, comparable or higher than the stock market! (the well known Dow Jones and S&P 500 indexes have long term returns of about 10–15% per year). CDM has been able to reinvent itself through the years easily incorporating new experimental evidence that quickly changed our view of cosmology in the last decade. CDM faced its biggest crisis in 1994, due to mounting criticism against its simplest but very successful product SCDM, i.e., a critical Universe, 95% dominated by dark matter. Problems for the model came from lack of power at large scales (Efstathiou et al. 1990), predicted evolution of galaxy cluster numbers stronger than observed (Henry et al. 1992) and the baryon fraction in galaxy clusters too low to be reconciled with observations (White et al. 1993). SCDM had to be recalled from customers and the following year the number of papers containing CDM in their abstract declined almost 10%, while competing models soared, including HDM, a cosmological model already ruled out in the ’80s (White, Frenk, & Davis 1983). Indeed alternative hierarchical models enjoyed then a moment of success. CHDM introduced a small component of massive neutrinos (e.g., Ghigna et al. 1997) to increase the amount of large scale power, while other models, like CDM or Warm Dark Matter (Hogan & Dalcanton 2000) tried to decrease the amount of power at galactic and subgalactic scales. However, these days only Self Interacting Dark Matter (SIDM, see section 4.2) shows a growth rate higher than CDM, but with only a fraction of its market share.
The first robust detection of primordial perturbations in the Cosmic Microwave Background from the COBE satellite suggested that the CDM business model was on the right track, although in need of some major restructuring. After 1998 and observational evidence for an accelerating Universe (Perlmutter et al. 1999) the new “Standard” model became LCDM, a flat Universe with a cosmological constant, and normalization . Indeed just a few days ago CDM topped analysts expectations after the findings of optical redshift survey 2dF (Peacock et al. 2001) and the analysis of the full set of BOOMERANG’s data (Netterfield et al. 2001), which strongly supported a LCDM universe with baryon abundance close to nucleosynthesis predictions.
Interestingly, the fraction of papers submitted to the astro-ph archive containing the word CDM in the abstract is actually a diminishing fraction of the total number of papers submitted. It was 10% in 1994 and only 2% in the year 2000. Is cosmology going out of fashion? Are we cosmologists losing market share to planet formation, AGNs and, perish the thought, funny variable stars? We offer here the following very speculative (or provocative?) explanation: the total number of papers submitted to the preprint database is growing slower than the total number of world Internet users which doubles every year or so. This is because scientists have likely been faster to adopt the Internet than the average population (no AOL or IOL to fight with); cosmo theorists have been faster than the average astrophysicist population and their number as users of the database got rapidly close to 100%. It is likely that now virtually all of CDM related papers are submitted to astro-ph, while other fields in astrophysics are slower to adopt it as a preferred way to disseminate preprints. The number of generic astrophysics papers submitted (being low at the beginning) has a much larger room to grow compared to that of just CDM papers.
3. Simulations of Galaxy Clusters
With the advent of parallel architectures and dedicated hardware (e.g., GRAPE; Hut & Makino 1999) and cross testing of -body codes (e.g., Frenk et al. 1999) it has been possible to simulate with accuracy not only the large scale distribution of galaxy clusters, but individual objects at a much larger detail. This is intrinsically a difficult numerical problem, given the large dynamic range across the cluster and the number of dynamical times (T) at its center. Insufficient dynamical range would cause infalling halos to dissolve in the cluster potential when their central densities became comparable The effect of increasing the dynamical range in a simulation is to correctly model the evolution of the densest structures (e.g., a subhalo core region), allowing them to survive the tidal forces of the cluster (Moore, Katz, & Lake 1996).
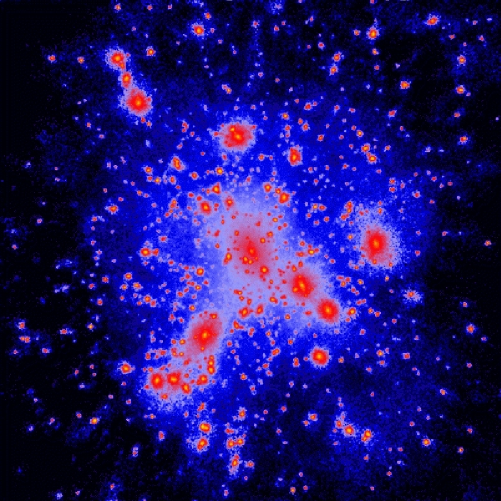
A new generation of simulations (Figure 2) has allowed us to test CDM under a new, interesting aspect: the internal properties of clusters and galaxies halos, namely the abundance of substructure and the density profile of the parent dark matter halo. A comparison of their results (Ghigna et al. 1998; Brainerd et al. 1998; Tormen, Diaferio, & Syer 1998; Klypin et al. 1999a; Ghigna et al. 2000; Fukushige & Makino 2000 among many), suggest that (1) a spatial resolution of less than a few percent of the virial radius, (2) half a million particles, (3) several tens of thousands time steps for particles with the largest acceleration, and (4) a surrounding simulated region of several Mpc are required to correctly model the tidal field, the subhalo population and a halo density profile down to a small fraction of its virial radius.
In this review we will briefly discuss previous results from different authors and show findings from a new set of very high resolution simulations (Governato et al., in preparation). These simulations explore the cosmic scatter in halo properties (1) within the same (SCDM) cosmology at a fixed mass, (2) with different power spectra (but keeping phases fixed), and (3) at different masses in the same (LCDM) cosmology. The set of simulations presented here satisfies all the requirements of the previous paragraph.
4. The Internal Structure of Galaxy Clusters
4.1. Density Profiles
A significant progress in our understanding of the internal structure of dark matter halos has been the fundamental finding that halos formed in CDM cosmogonies follow a universal profile, with a halo concentration that depends on the amplitude of density fluctuations as well on the ratio of power at small and large scales (Navarro, Frenk, & White 1996, hereafter NFW; Eke, Navarro, & Steinmetz 2000, hereafter ENS).
The proposed density profiles are, among others,
(NFW) or
(Moore et al. 1998, 1999a), where is a function of the so called “concentration parameter” , is the virial radius, and is a scale radius.
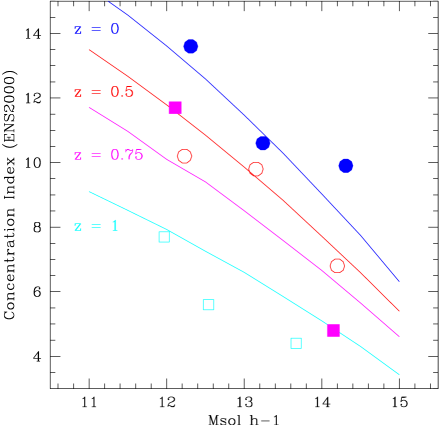
This, after some empirical tuning, allows detailed predictions of the shape of halo profiles. There is general consensus that in all CDM variants halo concentrations decrease at higher at fixed mass (i.e., at larger ) (see also Bullock et al. 2001). However, parameter space is large and previous works were able to cover a limited part of it at currently state-of-the-art resolution (you need to explore different cosmologies, a large range in redshifts and masses and keep cosmic variance into account before drawing any strong conclusions). Our new simulations are a step in that direction and confirm the ENS predictions for the concentrations of halos (Figure 3).
Note for the profile aficionado: the value of depends somewhat on the binning method used to measure the density profiles. For results in Figure 3 we used a procedure similar to that used in ENS (Eke, private communication) namely: (1) logarithmic bins between , (2) Poisson weighting, and (3) fitting between 0.01 (0.02 for ) and .

While interesting, the LCDM model predictions for the concentrations are difficult to test for cluster sized halos. Low concentrations (5–10) imply that the change in the density profile slope happens at relatively large radii of the order of 100 kpc or larger. Eke, Navarro, & Frenk (1998) and Carlberg, Yee, & Ellingson (1997) reported good agreement between a NFW profile and cluster profiles from galaxy counts, under the assumption that galaxies trace the underlying mass distribution (Carlberg et al. 1996), a somewhat reasonable assumption but difficult to test with simulations, as unwanted numerical effects will tend to underestimate the number of galaxies in the central part of clusters.
Stronger constraints can be placed at galactic scales, both measuring the shape of the rotation curves of individual dwarf and LSB galaxies (Flores & Primack 1994; Moore 1994), or, perhaps more robustly, the mass inside the optical radius (ENS) as low resolution rotation curves have likely been affected by beam smearing (van den Bosch et al. 2000). On the theory side, some claims that LCDM halos were too concentrated (Navarro & Steinmetz 2000) have been retracted (ENS) and careful re-analysis of observational data have been able to set much weaker constraints on the theory (van den Bosch & Swaters 2001).
A tad confusing, isn’t it?
In our opinion the crucial point is the central slope of the density profile in CDM dark matter halos. This is an issue far from being settled. The two proposed profiles have substantially different profile slopes in the inner part of the halo, converging to and . While current observations seem to be able to accommodate slopes as steep as within a few per cent of the virial radius, halos profiles as steep as or more, as shown by Moore et al. (1999a) and recently by Fukushige & Makino (2001) would prove rather difficult to support. Obviously firmer predictions have to be made to use high resolution rotation curves and mass profiles from weak lensing and X-ray observations (e.g., Lombardi et al. 2000) to establish whether there is a strong LCDM crisis.
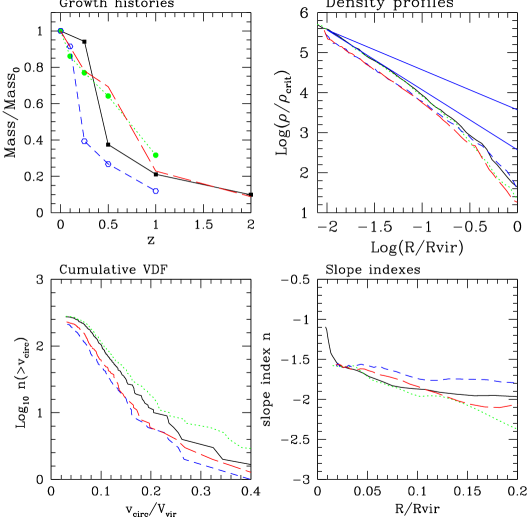
With the aim of settling the issue of the central slope of the density profile in clusters we have performed a number of high resolution runs of Virgo-sized clusters (). Three halos were taken from a SCDM cosmology to address the issue of cosmic scatter. Another Virgo-sized halo was run in four different cosmologies (LCDM, SCDM, TCDM, & OCDM), but keeping the same phases.
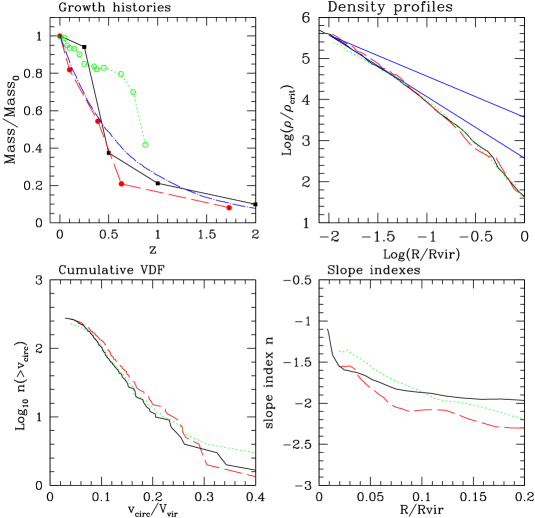
In all cases the slope of the density profile within is very close to , significantly steeper than the central slope advocated by NFW (Figures 4 and 5).
4.2. Substructure in Galaxy Clusters
Increasing the dynamical range of numerical simulations showed another major success of the model: as gravitational clustering creates (statistically) small halos first, some of them get gradually subsumed into larger halos. While early works assumed that these subhalos would have been destroyed (White & Rees 1978), high res simulations (e.g., Ghigna et al. 2000 and references therein) showed that they survive within the virialized regions of the parent halos and the abundance of dark substructures predicted by SCDM agrees well with the observed abundance of galaxies inside clusters (Figure 6). Our set of simulations reveals surprisingly little scatter between different realizations (Figure 4) (contrary to results obtained at much lower resolution) and between different variants of the CDM model (Figure 5). At a circular velocity of 200 Km/sec (=0.2) the LCDM cluster has about 40% less halos than the SCDM one.
Due to the almost power-law shape of the CDM power spectrum and the long survival times of subhalos, there is also little dependence on the parent halo mass, i.e., once rescaled to the circular velocity of the main halo, the properties of subhalos of galactic and cluster halos look pretty much the same (again Figure 6). While these results are a major success for CDM at cluster scales, galactic dark subhalos are predicted far in excess of the observed population of observed galactic satellites, by almost two orders of magnitude (Moore et al. 1999b; Klypin et al. 1999b).
Several solutions to this puzzle have been suggested within the CDM framework (e.g., the association of dark subhalos with High Velocity Clouds or the effect of an ionizing UV background and SN feedback, e.g., Moore 2001) but the question is still open. Other solutions are being explored. Self Interacting (or Collisional) Dark Matter which IPOed just last year (Spergel & Steinhardt 2000) and WDM (Bode, Ostriker, & Turok 2001) are indeed interesting alternatives (or rather modifications) to LCDM. However, numerical tests of SIDM on the cluster mass scale have given negative (Yoshida et al. 2000) or mixed results (Moore et al. 2000) or require the DM cross section to be a function of velocity, unlikely in the Newtonian regime (Firmani et al. 2000).
4.3. Orbits of Galaxies
Knowing the shape and evolution of orbits of galaxies in clusters is crucial for dynamical estimates of cluster masses (e.g., van der Marel et al. 2000). As tidal stripping is very efficient at decreasing a subhalo mass after the first pericentric passage, subsequent evolution of the subhalo population appears to be very slow, with a time scale likely larger than a Hubble time. Ghigna et al. (1998) showed clearly that orbital properties of subhalos do not differ significantly from those of the underlying DM distribution. Surviving subhalos are on almost radial orbits with a typical pericenter/apocenter ratio of 1:5. As subhalos orbit inside the dense background (comprising % of the mass of a cluster) they slowly lose orbital energy and sink to the center. However this process is not very efficient. -body simulations have been combined with semi-analytical models to give insight on the dynamical evolution of the halos identifiable with the hosts of luminous Lyman Break Galaxies (the most massive halos at ) and the progenitors of present day giant ellipticals (Governato et al. 2001). Orbital shapes of massive halos that fell into the cluster at high did not show any statistical difference from the global halo population, showing that orbital decay and evolution of surviving galaxies in clusters is negligible over a Hubble time even for those massive halos that were able to survive as separate entities in the early phases of the cluster formation.
Colpi, Mayer, & Governato (2000) have proposed a theoretical model for dynamical friction and a fitting formula which keeps orbit eccentricity and the retarding effect of tidal stripping into account:
where and are, respectively, the initial orbital angular momentum and the radius of the circular orbit with the same energy of the actual orbit and is the orbit circularity. The agreement between the semi-analytical approach and -body simulations is rather remarkable.
5. Discussion
While CDM faces considerable challenges from observational data and competing theories we believe it will still be the reference model for years to come. Recent observational results give support to its business model (but careful investors should perhaps remember the old saying “buy low & sell high”…). The CDM picture gives a coherent frame consistent with large scale structure constraints where galaxies in clusters form in the right numbers and range of masses, almost independently of cosmology. Their sizes and masses are governed by simple and reasonably understood processes like tidal stripping and dynamical friction. Mass attached to individual galaxies is of the order of 15%, a predictions that will be tested by weak lensing measurements in galaxy clusters (e.g., Natarajan et al. 1998). There is mounting evidence that the inner slope of the dark matter profile for clusters in CDM models is close to , with a small cluster to cluster scatter and weak dependence on the cosmological model.
While CDM seems well positioned, daring colleagues and students in search of market-beating returns should also invest their time and efforts in competing theories which, while riskier and (more) speculative, will offer insight on the physical processes linked to the formation and evolution of galaxy clusters. Space for improvements is getting tight, as constraints from large scale structures improve, and deviations from the currently preferred LCDM model will likely involve galactic and subgalactic scales, with hopefully interesting implications on our understanding of galaxy formation, star formation and feedback on the Intra Cluster/Galaxy Medium, especially at high redshift.
6. Disclosure and Disclaimer (Conforming to SEC Regulations)
FG, SG and BM own shares of CDM since the early ’90s and have started some rather speculative investments in WDM (FG) and Collisional DM (BM) so some conflict of interests here. Oh well, sue us. This document contains “forward looking statements”. These statements are subject to risks and uncertainties and are based on the beliefs and assumptions of the writers based on information currently available. Most important, always remember: past performance is no guarantee of future success!
References
Binggeli, B., Sandage, A., & Tammann, G. A. 1985, AJ, 90, 1681
Bode, P., Ostriker, J. P., & Turok N. 2001 (astro-ph/0010389)
Brainerd, T. G, Goldberg, D. M., & Villumsen J. V. 1998, ApJ, 502, 505
Bullock, J. S., et al. 2001, MNRAS 321, 559
Carlberg, R. G., Yee H. K. C., & Ellingson, E. 1997, ApJ, 478, 462
Carlberg, R. G. et al. 1996, ApJ, 462, 32
Colpi, M., Mayer, L., & Governato, F. 1999, ApJ, 525, 720
Davis, M., Efstathiou, G., Frenk, C. S., White, S. D. M. 1985, ApJ, 292, 371
Efstathiou, G., et al. 1990, MNRAS 247, 10p
Eke, V. R., Navarro, J. F., & Frenk, C. S. 1998, ApJ, 503, 569
Eke, V. R., Navarro, J. F., & Steinmetz, M. 2000, ApJ, submitted (astro-ph/0012337)
Firmani, C., D’Onghia, E., Avila-Reese, V., Chincarini, G., & Hernandez, X. 2000, MNRAS 315, 29
Flores, R. A., & Primack, J. R. 1994, ApJ, 427, L1
Frenk, C. S., et al. 1999, ApJ, 525, 554
Fukushige, T., & Makino, J. 2001, ApJ, in press (astro-ph/0008104)
Ghigna, S., Borgani, S., Tucci, M., Bonometto, S., Klypin, A., v & Primack, J. P 1997 ApJ, 479, 580
Ghigna, S., Moore, B., Governato, F., Lake, G., Quinn, T., & Stadel, J. 1998, MNRAS 300, 146
Ghigna, S., Moore, B., Governato, F., Lake, G., Quinn, T., & Stadel, J. 2000, MNRAS 554, 616
Ginsparg, P., invited contribution for conference held at UNESCO HQ, Paris, 19–23 Feb 1996 (http://arXiv.org/blurb/pg96unesco.html)
Governato, F., Babul, A., Quinn, T., Tozzi, P., Baugh, C. M., Katz, N., & Lake, G. 1999, MNRAS, 307, 949
Governato, F., Ghigna, S., Moore, B., Quinn, T., Stadel, J., & Lake, G. 2001 ApJ, 547, 555
Henry, J. P., Gioia, I. M., Maccacaro, T., Morris, S. L., Stocke, J. T., & Wolter, A. 1992, ApJ, 386, 408
Hogan, C. J., & Dalcanton, J. J. 2000, Phys. Rev. D, 62, 063511
Hut, P., & Makino, J. 1999, Science, 283, 501
Jenkins, A., et al. 2001, MNRAS, 321, 372
Klypin, A., Gottlöber, S., Kravtsov, A. V., & Khokhlov, A. M. 1999a, ApJ, 516, 530
Klypin, A., Kravtsov, A. V., Valenzuela, O. & Prada, F. 1999b, ApJ, 522, 82
Lombardi M. et al. 2000, A&A, 363, 401
Mateo, M. 1998, ARA&A, 36, 435
Moore, B. 1994, Nature, 370, 629
Moore, B. 2001, in 20th Texas Symposium, eds J. C. Wheeler, in press
Moore, B., Gelato, S., Jenkins, A., Pearce, F. R., & Quilis, V. 2000, ApJ, 535, 21
Moore, B., Ghigna, S., Governato, F., Quinn, T., Stadel, J., & Lake, G. 1999a, ApJ, 524, L19
Moore, B., Governato, F., Quinn, T., Stadel, J., & Lake, G. 1998, ApJ, 499, L5
Moore, B., Katz, N., & Lake G. 1996, ApJ, 457 455
Moore, B., Quinn, T., Governato, F., Stadel, J., & Lake, G., 1999b, MNRAS, 310, 1147
Natarajan, P., Kneib J.-P., Smail, I., & Ellis R. S. 1998, ApJ, 499, 600
Navarro, J. F., Frenk, C. S., & White, S. D. M. 1997, ApJ, 490, 493
Navarro, J. F., & Steinmetz, M. 2000, ApJ, 528, 607
Netterfield, C. B., et al. 2001, ApJ, submitted (astro-ph/0104460)
Peacock, J., et al. 2001, Nature, 410, 169
Peebles, P. J. E. 1984, ApJ, 277, 470
Perlmutter, S., et al. 1999, 517, 565
Press, W. H., & Schechter, P. 1974, ApJ, 187, 425
Sheth, R. K., Mo, H. J., & Tormen, G. 2001, MNRAS, 323, 1
Spergel, D. N., & Steinhardt, P. J. 2000, Phys. Rev. Lett, 84, 3760
Tormen, G., Diaferio, A., & Syer, D. 1998, MNRAS, 299, 728
van den Bosch, F. C., Roberston, B. E., Dalcanton, J. J., & De Blok, W. J. G. 2000, AJ, 119, 1579
van den Bosch, F. C., & Swaters, R. A. 2001, MNRAS, in press (astro-ph/0006048)
van der Marel, R. P., Magorria, J., Carlberg, R. G., Yee, H. K. C., & Ellingson, E. 2000, AJ, 119, 2038
White, S. D. M., Frenk, C. S., & Davis, M. 1983, ApJ, 274, L1
White, S. D. M., Navarro, J. F., Evrard, A. E., & Frenk, C. S. 1993, Nature, 336, 429
Yoshida, N., Springel, V., White, S. D. M., & Tormen, G. 2000, ApJ, 544, L87
Acknowledgments.
The authors thank their colleagues Tom Quinn and Joachim Stadel for allowing them to show results from ongoing projects. Simulations were completed at the ARSC (Fairbanks, AK) and CINECA (Bologna, Italy) supercomputing centers. FG acknowledges generous support from the organizers of this conference. Finally, Hawaii Volcanoes National Park is a way cool place. Go visit it.