OBSERVATIONAL EVIDENCE FOR STRONG DISK COMPTONIZATION IN GRO J
Abstract
Analysis was made of the multiple RXTE/PCA data on the promised black hole candidate with superluminal jet, GRO J, acquired during its 1996–1997 outburst. The X-ray spectra can be adequately described by the sum of an optically thick disk spectrum and a power-law. When the estimated 1–100 keV power-law luminosity exceeds (assuming a distance of 3.2 kpc), the inner disk radius and the maximum color temperature derived from a simple accretion disk model (a multi-color disk model) vary significantly with time. These results reconfirm the previous report by Sobczak et al. (1999). In this strong power-law state (once called “very high state”), the disk luminosity decreases with temperature, in contradiction to the prediction of the standard Shakura-Sunyaev model. In the same state, the intensity of the power-law component correlates negatively with that of the disk component, and positively with the power-law photon index, suggesting that the strong power-law is simply the missing optically thick disk emission. One possible explanation for this behavior is inverse-Compton scattering in the disk. By re-fitting the same data incorporating a disk Comptonization, the inner radius and temperature of the underlying disk are found to become more constant. These results provide one of the first observational confirmations of the scenario of disk Comptonization in the strong power-law state. This strong power-law state seems to appear when color temperature of the disk exceeds the certain threshold, 1.2 – 1.3 keV.
1 Introduction
When the mass accretion rate is high, a black hole binary (BHB) resides in the soft state, which is characterized by a very soft spectrum, accompanied by a power-law tail. The soft spectral component is believed to be thermal emission from an optically thick accretion disk around a central BH (e.g., Makishima et al. 1986), because it can be reproduced by a multi-color disk model (MCD model, Mitsuda et al. 1984) which approximates emission from a standard accretion disk (Shakura & Sunyaev 1973). The model has two parameters; the maximum color temperature of the disk, , and an apparent inner radius . Using a spectral hardening factor of –2.0 (Shimura & Takahara 1997), and a correction factor for the inner boundary condition, (Kubota et al. 1998), can be related to the true inner radius , as
| (1) |
X-ray observations indicate that remains constant at that is the last stable orbit for a non-spinning BH ( is the gravitational radius).
Although this “standard picture” remained generally successful (e.g., Ebisawa et al. 1993, Tanaka & Lewin 1995), recently two deviations from its predictions have been noticed in some soft-state BHBs. One is quite small values of , compared to , and the other is significant variations in . The former is found in the superluminal jet sources, GRO J and GRS (e.g., Zhang et al. 1997). The latter includes GRO J (Sobczak et al. 1999; hereafter S99), LMC X-1 (Wilms et al. 2001) and XTE J (Kubota 2001). Although these anomalies are often attributed, e.g., to strong disk Comptonization and/or very high value of , no convincing evidence has been available. These issues may be related to the general theoretical belief that the standard-disk picture is valid only for a rather limited range of the mass accretion rate (e.g., Esin et al. 1997).
In order to examine to what extent the standard picture is valid, we have analyzed X-ray spectra of GRO J obtained by multiple pointings with RXTE. This BHB has been reported to exhibit the two peculiarities mentioned above. Moreover, its BH mass, distance, and inclination angle are accurately estimated to be , kpc, and , respectively (e.g., Orosz & Bailyn 1997). These make GRO J ideal for our purpose.
2 Observation and data reduction
We analyzed 72 archival data sets of GRO J obtained with the RXTE/PCA, covering the 16-months outburst in 1996–1997. This is the same dataset as utilized by S99 except for the last few observations when the source exhibited a signature of the hard state. We co-added the data from the individual proportional counter units, and produced one co-added spectrum for each pointing. We select good data in the basic manner for bright sources.
We estimated the PCA background for each observation using pcabackest version 2.1e. In order to correct a possible % over/under-estimation of the background by the pcabackest, we compared the on-source spectra and the predicted model background spectra in the hardest energy band (60–100 keV), where the signal flux is usually negligible. When necessary, we adjusted the normalization factor of the background spectrum by . We make the response matrix for each observation using pcarsp version 7.10, and add 1% systematic error to each energy bin of the PCA spectrum. Over the 20–35 keV range, we increased the systematic error to 10%, to take into account the response uncertainties associated with the Xe-K edge at keV.
3 Data analysis and results
3.1 Standard modeling
According to the canonical spectral modeling, we fit the obtained 3–30 keV PCA spectra of GRO J with the MCD plus a power-law. After Yamaoka et al. (2001), we subject the MCD component to several absorption features (a line and edges). We do not discuss these absorption features any further. To the two constituent continuum components, we apply a common photoelectric absorption with the column fixed at , by referring to the ASCA/GIS data of this source on 1997 Feb.26 (Kubota 2001). Moreover, as for the data obtained before 1996 May 21 (MJD 50224), we fix the power-law photon index 2.1, because the power-law component was too weak to constrain .
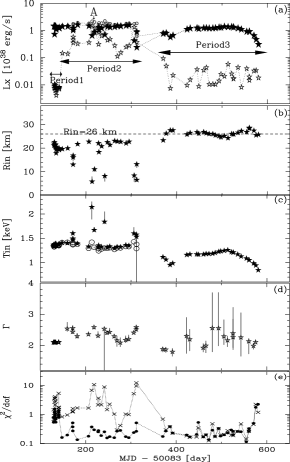
The fits have been acceptable for all the PCA spectra. In Fig.1, we show evolution of the best-fit model parameters, including the disk bolometric luminosity, ), the 1–100 keV power-law luminosity, , calculated assuming an isotropic emission, and their sum, . Thus, the entire PCA data span of this source can be divided into three characteristic periods, referring mainly to . The 1st period (Period 1; before day 141) is characterized by a very low level of , while it is very high () in Period 2, which was once called “very high state” by S99. In Period 3 (after the data gap), returns low.
In Period 3, the values of , which are obtained by utilizing eq.(1) with and , remain constant (26 km) against relatively large intensity variation, while in Period 2 they are observed to change significantly between km and km. When we fix at 26 km and instead allow to vary, the fits for the Period 1 and 2 data become significantly worse (Fig.1e), and changes violently. Thus, the variation of is real as long as we utilize the canonical two components model with constant values of and . Clearly, GRO J in Period 2 violates the standard picture.
In order to highlight the anomalies of GRO J, we plot against in Fig.2a. For comparison, we also plot the data points of a typical BHB, LMC X-3 (e.g., Kuiper et al. 1988), of which the BH mass (5–7.2 ) and the inclination angle (65∘–69∘) are both quite similar to those of GRO J. The results on LMC X-3 were obtained through the spectral fitting of the same PCA data as reported by Wilms et al. (2001). Thus, the data points for LMC X-3 follow a simple relation of with a constant as varied by a factor of 10. Moreover, assuming its distance and inclination angle as 55 kpc and respectively, the absolute value of is calculated as km, which coincide with for a BH of . In other words, the accretion disk in LMC X-3 perfectly satisfies the standard picture. In contrast, GRO J exhibits a distinct behavior on this - plane. The data points in Period 2 and Period 1 deviate from the standard relation, while those of Period 3 satisfy the relation except that the value of is much smaller than that of LMC X-3.
Although the deviation from the standard picture has been found in both Period 1 and 2, it is much more significant in Period 2 than in Period 1. In addition, the observed PCA spectra in Period 1 are relatively similar to those in Period 3 (see S99), while those in Period 2 are characterized by very strong hard emission component. Therefore in this letter, we mainly focussed on the anomalous behavior in Period 2. Hereafter, we call Period 2 anomalous regime, while call Period 3 standard regime.
3.2 Differences between anomalous and standard regimes
A prominent difference between the anomalous and standard regimes is found in behavior of the power-law component. In the anomalous regime, negatively correlates to , in such a way that is kept approximately constant at a ceiling value of (Fig.1a). To our surprise, this ceiling corresponds roughly to % of the Eddington luminosity, (assuming solar abundance) for a BH in GRO J, instead of itself. Furthermore, as shown in Fig.3, gradually increases as gets higher in the anomalous regime, while it stays constant at 2.1 in the standard regime. Therefore, the property of the hard component in the anomalous regime may be intrinsically different from that in the standard regime.
A simple interpretation of the source behavior in the anomalous regime is to presume that there emerges a third spectral component, which is harder than the MCD emission but softer than the hard component in the standard regime. Then, the strong anti-correlation between and , seen in the anomalous regime, can be explained by assuming that this third component strongly and negatively correlates with the MCD component. It is therefore natural to assume that some fraction of the photons emitted from the optically thick accretion disk are converted into the third spectral component, instead of directly reaching us. The third component is most probably produced through inverse-Compton scattering of the MCD photons by high energy electrons that may reside around the disk.
3.3 Spectral fitting incorporating a Comptonized component
We re-fit the same PCA spectra in the anomalous regime, with a three-component model, obtained by adding a Comptonized blackbody (“compbb”; Nishimura, Mitsuda, & Itoh 1986) component to the original two component model. The compbb model has four parameters; blackbody temperature , electron temperature , Compton optical depth , and radiative area of the blackbody for an isotropic emission. However, we cannot constrain all these additional parameters, since the previous two-component model has given acceptable fits. We accordingly tie to , assuming the seed photons for the inverse-Compton to be supplied by the optically thick accretion disk. We fix of the original power-law component to 2.1, an average in the standard regime (Fig.3). Furthermore, to avoid a strong coupling between and , we fix at a representative value of 10 keV, considering that strong Compton cooling by ample seed soft photons from the optically-thick disk will make significantly lower than in the hard state (30–50 keV; e.g., Grove et al. 1998).
In Fig.1c, we plot the re-estimated with open circles. By considering the compbb component, the highly deviated data points in terms of have thus settled back to a smooth long-term trend. We also re-estimate the luminosity in Fig.2b as , where is the estimated 0.1–100 keV compbb luminosity, assuming an isotropic emission. Thus, plotted against the revised approximately recovers the standard relation for optically-thick accretion disks. Consequently, the value of can also be considered to remain relatively stable, even when a significant fraction of the MCD photons is Comptonized. We conclude that some part of the power-law seen in the anomalous regime has the origin in the MCD photons, modified through the inverse-Compton process, and that the violent variations in the MCD parameters, on time scales of few days or shorter, is not real but apparent.
Figure 4a shows the typical PCA spectrum of GRO J in the anomalous regime, which corresponds to Observation A (1996 Aug. 6; day 218) presented in Fig.1a, fitted with the three-component model. We also show the result from the previous two-component fit in Fig.4b, where the best-fit model is obtained in the range of 3–30 keV. although the spectrum is shown in 3–50 keV.
4 Discussion
In §3, we have shown that the scenario of the strong disk Comptonization successfully explains the anomalous regime of GRO J, and that the underlying disk really satisfies the standard picture. A very similar phenomenon has been observed in another Galactic jet source, XTE J (Kubota 2001). Although the disk Comptonization has been discussed extensively in the literature, our results provide one of the first unambiguous observational confirmations of such a picture. Then, what causes such a strong Comptonization? As mentioned in §1, it was theoretically pointed out that the standard disk cannot be stable under high accretion rates. The anomalous regime can be hence considered to occur when the accretion rate reaches a certain upper critical level, as indicated by the location of anomalous regime (upper right) in Fig.2b.
We however remember that the critical disk luminosity, at which the anomalous behavior of GRO J appears, is only % of , and that LMC X-3 exhibits no such deviation from the standard-disk even with close to . Another important difference between these two BHBs is that the value of for GRO J is only for a BH even in the standard regime , while that of LMC X-3 agrees with . This fact makes the values of for GRO J much higher than those for LMC X-3 when compared at the similar luminosity. Interestingly, the observed value of the temperature of GRO J, keV, which corresponds to the critical luminosity, is almost the same as the upper limit of keV) for LMC X-3. We hence suggest that the endpoint of the standard regime is not determined by the luminosity but instead by the temperature, which is thought to be –1.3 keV for both LMC X-3 and GRO J. Such a consideration is consistent with a theoretical expectation that, at a high temperature, the opacity of the disk is given by electron scattering instead of photo-electric absorption that dominates at lower temperatures.
Thus, we consider that the systematically higher (or smaller ) is responsible for the anomalous behavior of GRO J. Because the innermost stable orbit becomes smaller for a prograde rotation around a spinning BH, down to in the extreme case, the anomalous behavior of GRO J may be attributed ultimately to its BH spin, as already suggested by Zhang et al. (1997), and Makishima et al. (2000).
We would like to thank Prof. H. Inoue and Prof. S. Mineshige for helpful discussions. We are also grateful to Dr. C. Done for valuable comments and discussions.
References
- Ebisawa et al. (1993) Ebisawa, K., Makino, F., Mitsuda, K., Belloni, T., Cowley, A., Schmidke, P., & Treves, A. 1993, ApJ, 403, 684
- Esin et al. (1997) Esin, A., McClintock, J.E., & Narayan, R. 1997, ApJ, 489, 865
- Grove et al. (1998) Grove et al. 1998, ApJ, 500, 899
- Kubota (2000) Kubota, A., 2001, Ph.D. Thesis, University of Tokyo
- Kubota et al. (1998) Kubota, A., Tanaka, Y., Makishima, K., Ueda, Y., Dotani, T., Inoue, H., & Yamaoka, K. 1998, PASJ, 50, 667
- Kuiper et al. (1988) Kuiper, L., van Paradijs, J., & van der Klis, M. 1988, A & A, 203, 79
- Makishima et al. (1986) Makishima, K., et al. 1986, ApJ, 308, 635
- Makishima et al. (2000) Makishima, K., et al. 2000, ApJ, 535, 632
- Mitsuda et al. (1984) Mitsuda, K., et al. 1984, PASJ, 36, 741
- Nishimura et al. (1986) Nishimura, J., Mitsuda, K., & Itoh, M. 1986, PASJ, 38, 819
- Orosz and Bailyn (1997) Orosz, J.A. & Bailyn C.D. 1997, ApJ, 477, 876
- Shakura and Sunyaev (1973) Shakura, N.I., & Sunyaev, R.A. 1973, A&A, 24, 337
- Shimura and Takahara (1995) Shimura, T. & Takahara F. 1995, ApJ 445, 780
- Sobczak et al. (1999) Sobczak, G.J., McClintock, J.E., Remillard, R.A., Bailyn, C.D. & Orosz J.A. 1999, ApJ 520, 776 (S99)
- Tanaka and Lewin (1995) Tanaka, Y., & Lewin, W.H.G. 1995, in X-ray Binaries, ed. W.H.G. Lewin, J. van paradijs, & W.P.J. van den Heuvel (Cambridge University Press, Cambridge), 126
- Wilms et al. (2001) Wilms, J. et al. 2001, MNRAS, 320, 327
- Yamaoka et al. (2001) Yamaoka, K., Ueda, Y., Inoue, H., Nagase, F., Ebisawa, K., Kotani, T., Tanaka, Y., & Zhang, S.N. 2001, PASJ, 53, 179
- Zhang et al. (1997) Zhang, S.N., Cui, W., & Chen, W. 1997, ApJ, 482, L155