Observations of the Optical Counterpart to XTE J1118+480 During Outburst by the ROTSE-I Telescope
Abstract
The X-ray nova XTE J1118+480 exhibited two outbursts in the
early part of 2000. As detected by the Rossi X-ray Timing Explorer (RXTE),
the first outburst began in early January and the second began in
early March. Routine imaging of the northern sky by the Robotic
Optical Transient Search Experiment (ROTSE) shows the optical
counterpart to XTE J1118+480 during both outbursts. These data
include over 60 epochs from January to June 2000. A search of
the ROTSE data archives reveal no previous optical outbursts of
this source in selected data between April 1998 and January 2000.
While the X-ray to optical flux ratio of XTE J1118+480 was low
during both outbursts, we suggest that they were full X-ray novæ
and not mini-outbursts based on comparison with similar sources.
The ROTSE measurements taken during the March 2000 outburst also
indicate a rapid rise in the optical flux that preceded the X-ray
emission measured by the RXTE by approximately 10 days. Using these
results, we estimate a pre-outburst accretion disk inner truncation
radius of Schwarzschild radii.
1 Introduction
On March 29, 2000, the detection of a new X-ray nova with the RXTE All Sky Monitor (ASM) was announced (Remillard et al., 2000). Subsequent analysis of archival ASM data revealed that the source had been rising since March 5 and had also undergone an earlier outburst during January 2-29, 2000. An optical counterpart was quickly identified at 12.9 magnitude by Uemura et al. (2000), who also identified an 18.8 magnitude object from the USNO catalog as the probable quiescent optical counterpart. Observations with the Burst and Transient Source Experiment (BATSE) indicate that the energy spectra for both outbursts was characterized by a power law with a photon index of 2.1, and the source was visible up to 120 keV (Wilson & McCollough, 2000). The optical spectrum was typical of X-ray novæ in outburst (Garcia et al., 2000). Optical data also revealed a sinusoidal variation suggesting a binary system with an orbital period of 4.1 hours (Cook et al., 2000). Quasi-periodic oscillations (QPOs) of 0.08 Hz were found using the RXTE Proportional Counter Array (PCA) (Revnivtsev et al., 2000). No periodic signal was observed in the power spectrum at frequencies greater than 100 Hz. The above measurements all imply that XTE J1118+480 is a binary accretion system composed of a black hole and an evolved low-mass companion. Recently, observations of the system in quiescence by McClintock et al. (2001) have established that the primary of the system has a mass greater than , thus indicating that it is a very strong black hole candidate.
XTE J1118+480 exhibits some features that are atypical of X-ray novæ. The X-ray to optical flux ratio is very low which would generally indicate a high inclination system, however no eclipses have been observed (Uemura et al., 2000). The source is near the Lockman hole (Lockman et al., 1986) and does not suffer from high interstellar absorption, thereby allowing observations with the Extreme Ultraviolet Explorer (EUVE). The EUVE observations show no periodic modulation suggesting the inclination is low enough that no obscuration by the disk rim occurs (Hynes et al., 2000). This implies that the source is intrinsically faint in X-rays.
Due to the strange behavior of the source, optical data during the initial stages of these outbursts provide useful constraints on the possible structure of the accretion disk and the mechanisms involved. The Robotic Optical Transient Search Experiment I (ROTSE-I) imaged the source throughout both the January and March outbursts. These data are presented below.
2 Instrument and Observations
The ROTSE program consists of several robotic telescopes designed to search for optical transients, particularly those associated with Gamma-Ray Bursts (GRBs) (Kehoe et al. 2000). These robotic telescopes rapidly respond to satellite derived triggers of astrophysical transients in various wavebands. The first generation of the ROTSE telescopes is ROTSE-I, which consists of an array of four Canon 200mm f1.8 lenses, each equipped with a thermo-electrically cooled 2048x2080 pixel CCD camera. Each lens/camera pair has an 8.1x8.1 degree field. Each image pixel subtends 14.4 arcseconds. To maximize sensitivity, the system is currently operated without filters. The system allows each camera to expose simultaneously so that the array acts as a single telescope with a 16x16 degree field.
When not responding to triggered events, the ROTSE telescopes perform regular patrol observations. A typical ROTSE-I sky-patrol consists of a series of 80 second exposures covering the area of sky visible above 20 degrees elevation. Each field is imaged twice consecutively to allow for the elimination of false detections caused by cosmic rays, satellite trails and glints, hot pixels, etc. The mount is moved slightly between exposure pairs to better facilitate the background rejection by shifting the celestial coordinates of hot pixels and other camera defects. Currently we perform two sky-patrols every night, generating four images (two pairs) of most sky locations. During periods near full moon, the exposure time is reduced to 20 seconds to eliminate the possibility of saturation due to the increased sky brightness.
The next morning, the images (1000 total) are corrected and calibrated to obtain accurate positions and magnitudes for each object by comparison to the Hipparchos catalog (Høg et al., 1998). This provides accurate positions and an effective V-band magnitude for each object. Normal sky-patrol images are generally sensitive to 15th magnitude (14th during full moon). A typical night’s observing covers about 18,000 square degrees and records the brightness of stars. For objects within 2 degrees of XTE J1118+480, over 22 observations during the month of March 2000, photometric accuracy was at magnitude 13 and at magnitude 15. Astrometric residuals are generally about 0.1 pixel (1.4 arcseconds). ROTSE-I has been operating in this manner since March of 1998. The archive has now grown to over 4 Terabytes (660,000 images) covering the entire sky north of -40 degrees declination.
3 Results
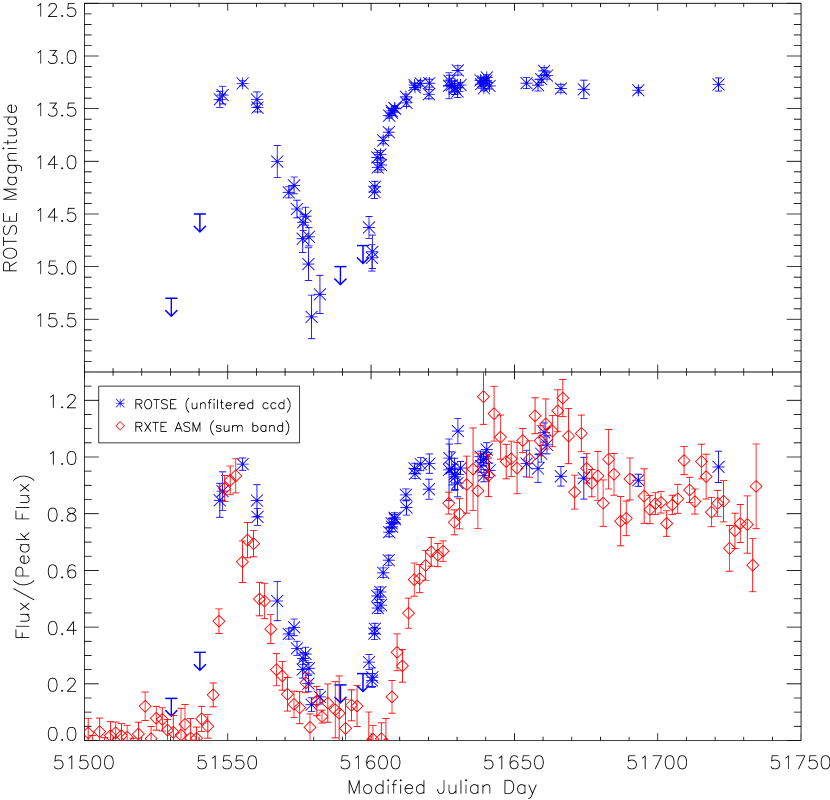
The ROTSE-I archive provides data on the optical counterpart to XTE J1118+480 throughout the January outburst and most of the March 2000 outburst (Figure 1). The ROTSE-I system was inactive from December 30, 1999, to January 4, 2000, in preparation for the year 2000 roll-over. As a result, we do not have data on the initial stages of the January outburst. The object is especially well covered from mid-February through March. After mid-April, our coverage dropped significantly and we did not observe the final stages of the second outburst. During the duration of our observations of this source, we detected no short optical flares as mentioned by Uemura et al. (2000). For the analysis presented here, the data was normalized to the observation from March 1 to ensure proper relative photometry between images. Also, since XTE J1118+480 was relatively close to our detection threshold in some of the shorter exposures, we took the weighted average of each pair of sky patrol observations. A search of the ROTSE-I archives during periods of new moon going back to April 1998 reveal no indication of this source. The location of XTE J1118+480 is typically not observed by ROTSE-I during the fall months of the year ( August-October).
The ROTSE-I light curve from the January burst has a similar morphology to the RXTE/ASM light curve. Both display a rapid rise which peaked around January 6. The X-ray data indicate that the object reached peak flux in less than 10 days. Although the initial stages of the January outburst were poorly sampled by ROTSE-I, the early limits indicate that the optical rise must have been quite rapid as well. The object then proceeded to dim at a relatively linear rate in flux over the next month in both the optical and X-ray. The later stages of the decay were well monitored by ROTSE-I. Figures 1 and 2 suggest that the optical emission lagged the X-ray emission during the declining phase of this burst by 5 days.
ROTSE-I detected the second outburst of XTE J1118+480 on February 26, 2000, 7 to 8 days before the first significant detections by the ASM. The optical intensity rapidly rose to half its peak intensity by March 1 and achieved a peak intensity of magnitude 13.3, five days later. In contrast, the X-ray emission reached half its peak intensity by March 11, approximately 10 days after the optical reached half its peak intensity level. XTE J1118+480 remained near magnitude 13.3 through June 2000. The January outburst also peaked near magnitude 13.3, possibly indicating that this is a natural limit based on the structure of the accretion disk. Figure 2 shows the optical to X-ray flux ratios seen by ROTSE-I and the ASM respectively. During the early stages of March burst, the flux ratio initially was high and then decreased steadily to unity over the next 20 days or so.
4 Discussion
Optical precursors have been observed previously in black hole X-ray novæ. Just prior to an X-ray outburst of GRO J1655–40 in April 1996, Orosz et al. (1997) obtained filtered optical data on the source showing an optical rise preceding the X-ray outburst by about 6 days. Optical observations of the August 1993 mini-outburst of GRO J0422+32 also indicated optical emission preceding the detection of X-rays by 16 days (Castro-Tirado et al., 1996). Hynes et al. (2000) have suggested the outbursts of XTE J1118+480 are more like mini-outbursts seen in GRO J0422+32 than a full X-ray nova. The X-ray delay observed in the March outburst of XTE J1118+480 is also analogous to the well known UV delay observed for dwarf novæ (Warner (1995) and references therein).
While the peak X-ray luminosities for both outbursts of XTE J1118+480 ( erg/s in the keV energy range, assuming the source distance of 1.1 kpc) were rather low, the general properties of its long-term variability are similar to that of other bright X-ray transients. For example, XTE J1550–564 also underwent two consecutive outbursts of comparable duration to XTE J1118+480 beginning in late 1998 (Jain, et al., 2001). Moreover, the normalized profiles of the second outbursts in both systems are very similar. This fact suggests that this outburst of XTE J1118+480 is a full X-ray nova rather than a mini-outburst. The low peak luminosity of the source can probably be attributed to the properties of the binary system. The binary period of XTE J1118+480 is known to be one of the shortest among the low mass X-ray binary transient systems, implying a smaller size of the primary Roche lobe and different parameters of the accretion disk (like mass and accretion rate). The X-ray and optical properties of XTE J1118+480 (Revnivtsev et al., 2000; Hynes et al., 2000) resemble the properties of another well-known Galactic black hole candidate GX 339–4 during its hard/low state outbursts (at comparable luminosity level of ergs/s) (Motch et al., 1983). Both sources demonstrate a high optical to X-ray flux ratio and simultaneous low frequency QPOs in X-ray and optical bands (Motch et al., 1983; Revnivtsev et al., 2000; Hynes et al., 2000).
To explain the origin of dwarf novæ and X-ray transients, the Disk Instability Model (DIM) was proposed (Smak, 1981; Mineshige & Wheeler, 1989). In the framework of this model, the UV/X-ray delay is a result of propagation of the heating front through the accretion disk (Meyer, 1984). This front transforms the disk from the cold (quiescent) state to a hot state raising the optical and UV/X-ray flux from the disk. However, the standard DIM fails to explain the delay quantitatively: the calculated travel time of the heating front, which should be near the sound speed of the medium, is less than 1 day for a typical system – a value which is much shorter than commonly observed (Pringle, Verbunt & Wade, 1986; Hameury et al., 1997).
A number of accretion flow models have been proposed to explain the hard X-ray emission of X-ray binaries and cataclysmic variables in the quiescent and hard/low spectral states (Chakrabarti & Titarchuk, 1995; Meyer & Meyer-Hofmeister, 1994; Narayan, McClintock & Yi, 1996). These models involve a hot optically-thin inner region that is surrounded by an optically-thick standard accretion disk. This two-component geometry of the accretion flow seems to resolve the problem of the standard DIM. The inward moving heating front should stop at the inner edge of the optically-thick disk. Then the inner edge of the transformed disk moves toward the compact object on the viscous time scale, which is much longer than the heating front propagation time. As the transition radius moves inward, a growing fraction of the emitted photons are intercepted and Comptonized by the hot corona, giving rise to the hard X-ray emission. The X-ray delay times predicted by this model are in much better agreement with observations.
One proposed model involving a hot optically-thin inner region of the accretion disk is the Advection Dominated Accretion Flow or ADAF (Narayan, McClintock & Yi, 1996). In this model the accretion disk evaporates into an optically-thin, quasi-spherical corona. The corona, or ADAF region, consists of a two-temperature plasma in which the ions and electrons interact weakly which results in much of viscous heat being advected into the black hole instead of being radiated away through Comptonization. Esin et al. (2001) have applied the ADAF model to multiwavelength observations of XTE J1118+480 during outburst in optical, EUV, and X-ray. These multiwavelength measurements are well fit by a black hole at a distance of kpc in which the ADAF transition radius, , is at where is a Schwarzschild radius.
Hameury et al. (1997) use the ADAF model and the results of Orosz et al. (1997) to estimate the transition radius of the quiescent optically thick accretion disk in GRO J1655–40 to be on the order of . Assuming the same mechanism for the outburst of XTE J1118+480 and given the X-ray delay time observed in the March outburst of XTE J1118+480 ( days), we can estimate the value of the inner radius of the quiescent accretion disk in this system. The characteristic viscous time scale for a gas pressure dominated accretion disk with dominant free-free opacity (Shakura & Sunyaev, 1973) is
| (4-1) |
where , , and are the disk viscosity parameter, disk accretion rate in units of g/s, mass of the compact object in solar units, and distance from the compact object in units of cm respectively. Here and elsewhere we use the symbols and to denote distance in physical and Schwarzschild units respectively (). The accretion rate can be estimated using: . Using an ASM count-rate of 2.8 c/s and a distance of 1.1 kpc, the peak X-ray luminosity should be (Fender et al., 2001), implying an accretion rate of .
Assuming the X-ray delay time, to be equal to the viscous time, , one can calculate the initial value of the transition radius, :
| (4-2) |
Using the values from the Esin et al. (2001) model and our own observations; , , , and , one obtains and .
We can estimate the outer radius of the accretion disk, for comparison to the transition radius calculated above. Using numerical integration, Eggleton (1983) approximates the effective radius of the Roche lobe as:
| (4-3) |
Where is the radius of the primary Roche lobe, is the binary separation, and . Using and we obtain . Using the orbital parameters from McClintock et al. (2001), we have , where is the distance from the secondary to the center of mass and is the inclination of the system. Assuming and , we get cm. If we then assume the outer radius of the accretion disk is some fraction of (Lin & Papaloizou, 1979), say 80%, then cm and .
While our estimated value for of XTE J1118+480 is similar to that calculated for GRO J1655–40 by Hameury et al. (1997), the outer disk radius, , is likely smaller than found in typical X-ray novæ. According to the DIM model, it is the outer radius which should determine the total mass stored in the accretion disk before the onset of the outburst. If we assume a constant coefficient of mass conversion into emission, the accretion disk mass then determines the integral flux emitted during outburst. This model may explain qualitatively why the level of X-ray emission detected from XTE J1118+480 was unusually low, whereas the temporal evolution of the outburst was similar to other typical X-ray novæ, such as XTE J1550–564 (Jain, et al., 2001).
5 Summary
We have presented data from the ROTSE-I telescope that show the optical counterpart of XTE J1118+480 during two outbursts in the early part of 2000. A comparison of the ROTSE-I optical data with the RXTE/ASM X-ray data during the second outburst show that XTE J1118+480 appeared first in the optical band, approximately 7 days before appearing in X-rays. Additionally, the optical flux rose at a much greater rate than the X-ray flux during the initial stages of the second outburst. At the half-power point, the delay was approximately 10 days.
A possible explanation for the X-ray delay is that the accretion flow consists of two components. The outer component is a classical geometrically thin, optically-thick disk. This flow then becomes an optically-thin corona, such as an ADAF, as it moves inward toward the central compact object. During outburst, the radius at which this transition occurs moves inward on a viscous time-scale, eventually resulting in X-ray emission. By measuring the delay between the onset of the optical emission and the X-ray emission, the initial radius of the transition region may be estimated. In the case of XTE J1118+480 we may approximate the initial transition radius by using the delay between the ROTSE-I and ASM observations of the March outburst. Given a 10 day delay, we estimate the transition radius to have been Schwarzschild radii, or km.
We would especially like to thank the RXTE/ASM team for their data on XTE J1118+480. Work performed at LANL is supported by NASA SR&T through DOE contract W-7405-ENG-36 and through internal LDRD funding. Work performed at University of Michigan is supported by NASA under SR&T grant NAG5-5101, the NSF under grants AST-9703282 and AST-9970818, the Research Corporation, the University of Michigan, and the Planetary Society. Work performed at LLNL is supported by NASA SR&T through DOE contract W-7405-ENG-48.
References
- Castro-Tirado et al. (1996) Castro-Tirado, A. J., Ortiz, J. L., & Gallego, J., 1997. A&A, 322, 507
- Chakrabarti & Titarchuk (1995) Chakrabarti, S. K., & Titarchuk, L. G., 1995. ApJ, 452, 226
- Cook et al. (2000) Cook, L., Patterson, J., Buczynski, D., & Fried, R., 2000. IAU Circ. 7397
- Eggleton (1983) Eggleton, P. P., 1983. ApJ, 268, 368
- Esin et al. (2001) Esin, A. A., McClintock, J. E., Drake, J. J., Garcia, M. R., Haswell, C. A., Hynes, R. I., & Muno, M. P., 2001. ApJ, submitted (astro-ph/0103044)
- Fender et al. (2001) Fender, R. P., Hjellming, R. M., Tilanus, R. P. J., Pooley, G. G., Deane, J. R., Ogley, R. N., & Spencer, R. E., 2001. MNRAS, 322, L23
- Garcia et al. (2000) Garcia, M., Brown, W., Pahre, M., McClintock, J., Callanan, P., & Garnavich, P., 2000. IAU Circ. 7392
- Hameury et al. (1997) Hameury, J. M., Lasota, J. P., McClintock, J. E., & Narayan, R., 1997. ApJ, 489, 234
- Høg et al. (1998) Høg, E., Kuzmin, A., Bastian, U., Fabricius, C., Kuimov, K., Lindegren, L., Makarov, V. V., & Röser, S., 1998, A&A, 335, L65
- Hynes et al. (2000) Hynes, R. I., Mauche, C. W., Haswell, C. A., Shrader, C. R., Cui, W., & Chaty, S., 2000. ApJ, 539, L37
- Jain, et al. (2001) Jain, R. K., Bailyn, C. D., Orosz, J. A., McClintock, J. E., Sobczak, G. J., 2001. ApJ, 546, 1086
- Kehoe et al. (2000) Kehoe, R., et al., 2000, STScI May 1999 Symp.
- Lasota et al. (1996) Lasota, J. P., Narayan, R., & Yi, I., 1996. A&A, 314, 813
- Lin & Papaloizou (1979) Lin, D. N. C., & Papaloizou, J., 1979. MNRAS, 186, 799
- Lockman et al. (1986) Lockman, F. J., Jahoda, K., & McCammon, D., 1986. ApJ, 302, 432
- Meyer (1984) Meyer, F., 1984. A&A, 131, 303
- Meyer & Meyer-Hofmeister (1994) Meyer, F., & Meyer-Hofmeister, E., 1994. A&A, 288, 175
- McClintock et al. (2001) McClintock, J. E., Garcia, M. R., Caldwell, N., Falco, E. E., Garnavich, P. M., & Zhao, P., 2001. ApJ, 551, L147
- Mineshige & Wheeler (1989) Mineshige, S., & Wheeler, J. C., 1989, ApJ, 343, 241
- Motch et al. (1983) Motch, C., Ricketts, M. J., Page, C. G., Ilovaisky, S. A., & Chevalier, C., 1983. A&A, 119, 171
- Narayan, McClintock & Yi (1996) Narayan, R., McClintock, J. E., & Yi, I., 1996. ApJ, 451, 821
- Orosz et al. (1997) Orosz, J. A., Remillard, R. A., Bailyn, C. D., & McClintock, J. E., 1997. ApJ, 478, L83
- Pringle, Verbunt & Wade (1986) Pringle, J. E., Verbunt, F., & Wade, R. A., 1986, MNRAS, 221, 169
- Remillard et al. (2000) Remillard, R., Morgan, E., Smith, D., & Smith, E., 2000. IAU Circ. 7389
- Revnivtsev et al. (2000) Revnivtsev, M., Sunyaev, R., & Borozdin, K., 2000. A&A, 361, L37
- Smak (1981) Smak, J., 1981. Acta Astron., 31, 395
- Shakura & Sunyaev (1973) Shakura, N. I., & Sunyaev, R. A., 1973. A&A, 24, 337
- Uemura et al. (2000) Uemura, M., Kato, T., Matsumoto, K., Yamaoka, H., Takamizawa, K., Sano, Y., Haseda, K., Cook, L., Buczynski, D., & Masi, G., 2000, PASJ, 52, L15
- Wilson & McCollough (2000) Wilson, C. A. & McCollough, M. L., 2000. IAU Circ. 7390
- Warner (1995) Warner, B. 1995. Cataclysmic Variable Stars, Cambridge University Press, 1995.
- Zhang et al. (1994) Zhang, S. N. et al., 1994, IAU Circ. 6046
| Date | MJDaaModified Julian Day (jd-2400000.5) | MagnitudebbUnfiltered optical ccd, values indicate sensitivity of image in which XTE J1118+480 is not detected. | Fluxcc |
|---|---|---|---|
| 12/18/99 | 51530.315 | 15.3 | 2.75 |
| 12/28/99 | 51540.283 | 14.5 | 5.75 |
| 1/04/00 | 51547.223 | 13.41.08 | 15.671.10 |
| 1/12/00 | 51555.195 | 13.26.02 | 18.030.41 |
| 1/24/00 | 51567.270 | 14.00.15 | 9.101.28 |
| 2/02/00 | 51576.305 | 14.58.08 | 5.350.38 |
| 2/08/00 | 51582.148 | 15.26.18 | 2.850.47 |
| 2/15/00 | 51589.313 | 15.0 | 3.63 |
| 2/23/00 | 51597.184 | 14.8 | 4.37 |
| 2/26/00 | 51600.301 | 14.92.13 | 3.950.41 |
| 3/01/00 | 51604.246 | 13.80.03 | 10.950.32 |
| 3/05/00 | 51608.164 | 13.49.02 | 14.540.32 |
| 3/12/00 | 51615.176 | 13.28.02 | 17.760.33 |
| 4/20/00 | 51654.227 | 13.26.05 | 18.070.87 |
| 6/26/00 | 51721.195 | 13.27.06 | 17.851.03 |