Type Ia Supernovae, the Hubble Constant, the Cosmological Constant, and the Age of the Universe
Abstract
The age of the Universe depends on both the present-day Hubble Constant and on the history of cosmic expansion. For decelerating cosmologies such as = 1, the dimensionless product and modestly high values of the Hubble constant would be inconsistent with a cosmic age larger than 12 Gyr. But if , then can take on a range of values. Evidence from the Hubble diagram for high redshift Type Ia supernovae favors and . Then, if lies in the range 65–73, the age of the Universe, , is Gyr.
Institute for Astronomy, University of Hawaii
http://cfa-www.harvard.edu/cfa/oir/Research/supernova/HighZ.html
1. It has been an interesting five years!
Five years ago, the combination of deep seated belief in inflation, implying , and stellar age estimates near 15 Gyr seemed to require . Measurements of and in clusters notwithstanding, Bartlett, Blanchard, Silk, and Turner wrote a provocative paper entitled, “The Case for a Hubble Constant of 30 km/s/Mpc.” Persuaded by the power of theoretical reasoning, Joe Silk bet Brian Schmidt and me a case of Scotch that . While Joe has not yet paid up, in the past 5 years he has moved closer to the source of Scotch while the Hubble constant has moved to 60 and beyond. The new element is that supernovae have made the connection between and the cosmic age more flexible because of plausible evidence for cosmic acceleration.
A Danish-English team (Norgaard-Neilsen et al. 1989) initiated a program to find supernovae in clusters of galaxies at redshifts of 0.3-0.5, with the idea that they could distinguish the effects of cosmic deceleration, as expected in an = 1 universe by measuring the peak apparent magnitudes of supernova light curves. The observational problem was to find these faint (m21-22) and distant supernovae near the peak of their light curves. But small detectors kept this pioneering effort from yielding significant results.
The Supernova Cosmology Project (SCP) based at Lawrence Berkeley Lab forged ahead with further attempts to find distant supernovae by extending the methods of the Danes to bigger, faster telescopes. After abandoning attempts to instrument the AAT prime focus for this purpose, they used the standard large format detectors at the Kitt Peak National Observatory starting in 1992 (Perlmutter 1995). By 1997, they had a preliminary result (Perlmutter et al. 1997) based on observations of seven supernovae discovered in 1994 and 1995. By comparing their supernovae with the sample at low redshift, they concluded that the evidence favored a universe with high matter density . They argued that the supernova data at that point placed the strongest constraint on the possible value of the cosmological constant, with their best estimate being .
Since 1995, there have been two groups pursuing evidence on cosmic deceleration using the Hubble diagram for supernovae. Our High-Z Supernova Search Team, steered by Brian Schmidt, and encompassing workers on four continents and one mid-Pacific island, found our first supernova in 1995 (Schmidt et al. 1998). From three additional supernovae studied with the High-Z Team found a low value of , showing that ordinary matter could not close the Universe (Garnavich et al. 1998). Our first results on were reported at the Dark Matter conference in February of 1998 by Filippenko and Riess (1998) and published in the Astronomical Journal in September 1998 (Riess et al. 1998). In the same period, the SCP revised their analysis of earlier data (Perlmutter et al. 1998) and then independently reported evidence on in the Astrophysical Journal in June 1999 (Perlmutter et al. 1999).
2. SNIa constraints on
Even this first round of supernova observations, which emphasized a sample near z0.5, provided a good constraint on the difference - which, since measures deceleration, and measures acceleration, translates into a surprisingly tight constraint on .
The present samples of SNIa published, in hand, and being reduced by the two teams provide a statistically robust measurement that . The important questions now are whether the supernovae at large redshift are really the same as the supernovae nearby and whether exotic forms of grey dust might obscure both the supernovae and our understanding of cosmology (Aguirre, 1999, 2000). The observational approach to answer these questions is to use spectra to examine the question of homogeneity (Coil et al. 2001) and multicolor observations over a wide range of wavelengths (as might be done with a superb 8-m infrared telescope at the world’s best site) to constrain the properties of intergalactic dust (Riess et al. 2000). So far, although the distant supernovae could have failed these tests, they seem indistinguishable from the SNIa nearby.
A more ambitious test for the cosmological origin of the observed effect is to extend the data set to higher redshift. While dimming due to evolution or dust would most naturally lead to larger effects at higher redshift, cosmological effects could have the opposite sign due to cosmic deceleration at early epochs (z 1.5), followed by a transition to acceleration in the more recent past.
2.1. What does a supernova look like?
Looking at real data helps develop an understanding of the observational issues in discovering and measuring light curves for high redshift supernovae. Here we illustrate the appearance of a z=0.81 supernova, SN 1999fj, as observed in a series of images from October through December 1999. Large format detectors on telescopes at good seeing sites are the chief requirement for efficient surveys to find type Ia supernovae at . Follow-up observations with 8-m class telescopes enable us to construct light curves that can be used to place each SNIa firmly on the Hubble diagram.
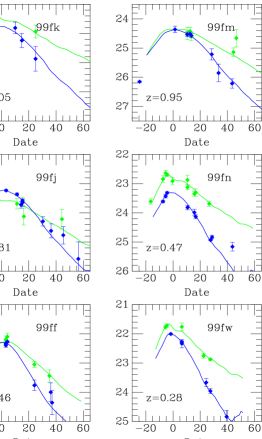
2.2. Light curves from Fall 1999
One of the key developments that makes SNIa so useful as standard candles is the discovery by Mark Phillips (Phillips 1993) that the luminosity of a SNIa is related to its rate of decline after maximum light. This approach, refined by Hamuy et al. (1996) and by Riess, Press & Kirshner (1996) allows the distance of a well-observed SNIa with two color data to be determined to better than 10%.
The light curves for high redshift supernovae are obtained in filters which can be transformed back to rest frame B and V with good precision. Time dilation, a signature of cosmic expansion, is a powerful effect for supernovae near z, transforming 40 days in the observer’s frame to 20 days in the supernova’s own rest frame (Leibundgut et al. 1995). Photometric calibration and scrupulous subtraction of galaxy light are serious problems for this work which become more difficult at high redshift. Nevertheless, images like those in Figure 1 can be used to construct light curves as shown in Figure 2.
3. Meditations on
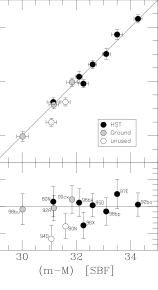
What is the observational evidence on ? Many techniques have been developed for measuring extragalactic distances and the ones we love the best are SNIa (Jha et al. 1999) and the Surface Brightness Fluctuation method, reviewed recently by Blakeslee, Ajhar, & Tonry (1999). Ajhar et al. 2001 demonstrate that these methods are internally consistent: as Figure 3 shows, distances measured by SNIa and by SBF to the same galaxies are consistent within the quoted errors. This suggests that both methods are in good shape.
But what is , so diligently sought through the decades? This depends entirely on the sample of Cepheids used and the distances assigned to those Cepheids by expert workers in that field. If you use the distances to galaxies with Cepheids as determined by various papers by the Key Project (Ferrarese et al. 2000, Freedman et al. 2001, Gibson & Stetson 2001) to define the absolute magnitude of SNIa and SBF, you get , 75, and 77 for both SNIa and SBF. If you use the distances to the same galaxies using the same Cepheid observations as reduced by Saha et al (1997) and most recently compiled by Parodi et al. (2000), you get according to the methodology used by the High-Z team, or according to Parodi et al. Similarly, the distances to the SBF calibrating galaxies depend entirely on the Cepheid distances.
The Hubble constant is not determined by SNIa or by SBF alone: these methods give excellent relative distances to galaxies and tie the cosmic expansion firmly to the local calibrators, but the calibration by Cepheids is now the largest uncertainty in measuring the local value of the Hubble Constant. For the rest of this paper, we will either adopt as a best-guess value, or else a probability distribution which consists of two Gaussians of fractional width 0.1, centered on and , with a , weighting. It ain’t perfect, but it’s our gut feeling of where really lies.
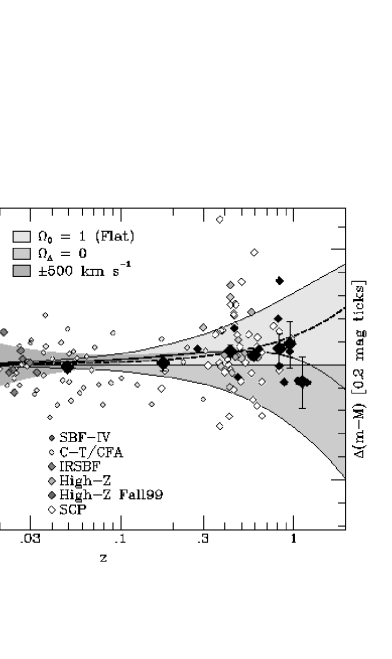
4. Differential Hubble diagram for SBF and SNIa
The key evidence on a value for comes from Figure 4. All the supernova and SBF distances are consistent at low redshift, and the supernova data indicate that a model with =0 does not fit at z 0.5. This is the case for an accelerating universe, whether urged on by a cosmological constant or by something which varies with time. The best fit model has and . None of the observers is satisfied with the current state of the statistical errors (about twice as large for each SCP supernova as for the High-Z data) or with current limits on possible systematic effects that might make distant supernovae dimmer.

Figure 4 shows that a systematic effect that just grows as the redshift is not a good fit to the data, but the most telling way to separate a systematic effect that is proportional to redshift or time is to look at redshifts above 1. For a -dominated cosmology, there is a transition, somewhere around , from acceleration here and now to deceleration in the distant past when the matter density, which scales as would have been more important. The High-Z Team is working hard to test these ideas. Our Fall 1999 data, which are being slowly beaten into photometric perfection, emphasize z1 objects which will provide strong evidence to distinguish cosmology from systematics. Preliminary reductions are shown here. Our Fall 2000 program emphasized careful UBVRI photometry in the supernova rest frame to discern the effects of not-quite-gray dust. The final reduction of those data requires observations of the galaxy without the supernova, obtained a year after the discovery, and will be forthcoming when these templates are in hand (Jha 2001).
5. – constraints and the Distribution of
We can employ the tools of likelihood analysis to construct contours in the – plane, as illustrated in Figure 5. Of special note is the effectiveness of just a handful of z 0.9 supernovae in contracting the contours of this plot (as imagined by Goobar and Perlmutter 1995). A concise way to express the best constraint on and is . Interestingly, contours of constant age are very nearly parallel to the long axis of the error ellipse in Figure 5. This means that the competition between deceleration due to and acceleration due to is well captured by the measurement of luminosity distances, and the value of is well constrained even though the individual values of and are not.
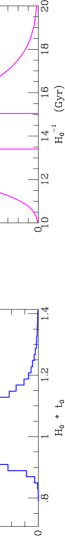
Marginalizing the probabilities of Figure 5 onto the axis yields a probability distribution for as shown in Figure 6. We find . The absolute value of the cosmic age depends on , which, given the excellent agreement of the SBF and SNIa distances, inherits almost all its errors from the Cepheid zero point.
6. Summary
Precise distance estimators measured over the range from z 0 to z1 provide powerful constraints on the dimensionless product . Despite an ongoing struggle between deceleration and acceleration, the fortuitous result is that the formulation in elementary textbooks; turns out to be accurate. A more formal way to express the contraint from SNIa at is that they imply . For our guess at the true value of , Gyr. A better value for the age of the Universe hinges on nearby matters like the distance to the LMC and metallicity dependence of Cepheids!
References
Aguirre, A. 1999 ApJ, 525, 583.
Aguirre, A, and Haiman, Z. 2000 ApJ, 532, 28.
Ajhar, E.A., Tonry, J.L., Blakeslee, J.P., Riess, A.G. & Schmidt, B.P. 2001, ApJ, in press.
Bartlett, J.G. Blanchard, A. Silk, J. and Turner, M.S. 1995 Science 267, 980.
Blakeslee, J.P., Ajhar, E.A., & Tonry, J.L. 1999, in Post-Hipparcos Cosmic Candles, eds. A. Heck & F. Caputo (Boston: Kluwer Academic Publishers), 181.
Coil, A. et al. 2000, ApJ, 544, L111.
Ferrarese, L. et al. 2000, ApJ, 529, 745.
Filippenko, A. and Riess, A.G. (1998) Phys.Rept. 307, 31-44.
Freedman, W. L., et al. 2001, ApJ, in press (astro-ph/0012376).
Garnavich, P. M., et al. 1998, ApJ, 493, 53.
Goobar, A. Perlmutter, S. 1995 ApJ, 450, 14.
Gibson, B. K. Stetson, P.B. 2001 ApJ, 547, L103.
Hamuy,M. et al. 1996 AJ, 112, 2398.
Jha, S. et al. 1999 ApJS, 125, 73.
Jha, S. et al. 2001 astro-ph/0101521.
Leibundgut, B. et al. 1996 ApJ, 466, 21.
Norgaard-Neilsen et al. 1989 Nature 339, 523.
Parodi, B.R., Saha, A., Sandage, A., & Tammann, G.A. 2000, ApJ, 540, 634.
Perlmutter et al. 1995, ApJ, 44, L41.
Perlmutter et al. 1997, ApJ, 483, 565.
Perlmutter et al. 1998, Nature 391, 54.
Perlmutter et al. 1999, ApJ, 517, 565.
Phillips, M. M. 1993, ApJ, 413, L105.
Riess, A. G., Press, W. H., & Kirshner, R. P. 1996, ApJ, 473, 88.
Riess et al. 1998 AJ, 116, 1009.
Riess et al. 2000 ApJ, 536, 62.
Riess et al. 2001 astro-ph/0104455.
Saha, A. et al. 1997, ApJ, 486, 1.
Schmidt et al. 1998 ApJ, 507, 46.
Acknowledgments.
Support for this work was provided by NASA through a grant from the Space Telescope Science Institute, which is operated by the Association of Universities for Research in Astronomy, Inc. under NASA contract NAS5-26555.