Space-VLBI observations of OH masers
Abstract
We report on the first space-VLBI observations of the OH masers in two main-line OH transitions at 1665 and 1667 MHz. The observations involved the space radio telescope on board the Japanese satellite HALCA and an array of ground radio telescopes. The maps of the maser region and images of individual maser spots were produced with an angular resolution of 1 mas, which is several times higher than the angular resolution available on the ground. The maser spots were only partly resolved and a lower limit to the brightness temperature K was obtained. The masers seem to be located in the direction of low interstellar scattering.
Astro Space Center, Profsouznaya st. 84/32, 117810 Moscow, Russia
University of Guanajuato, Department of Astronomy, Apdo Postal 144, Guanajuato, CP36000, GTO, Mexico
National Astronomical Observatory, 2-21-1 Osawa, Mitaka, Tokyo 181, Japan
1. Introduction
OH masers were the first to be discovered as a new class of astronomical phenomenona exhibiting intense, narrow-band, polarized, variable emission in interstellar molecular transitions. The source of this emission was shown to be small, compact clumps of neutral gas, at the periphery of compact H ii regions created by newly born massive O stars. Another class of OH masers is related to evolved low- and medium-mass stars, and is not considered here. High angular resolution study of OH masers showed that they consist of a number of bright compact maser spots separated by several arcseconds. The spots themselves are from 2 to 70 mas in extent, and in some masers are barely resolved, even with the highest angular resolution available from ground-based VLBI arrays.
Current models of OH maser emission deal with gas condensations of particle density 107 cm-3, kinetic temperature 100 K, illuminated by the far-infrared emission from hot dust. With Doppler velocity gradient FIR-line overlap produces population inversion responsible for the main-line emission at 1665 MHz and 1667 MHz. A magnetic field of about 10 milligauss is sufficient to produce Zeeman splitting of lines and strong elliptical polarization.
The goal of the high angular resolution study of OH masers is to determine relative position of the spots, to measure the intensity, and to map the spots. Determination of the size and the shape of the maser spots would be very helpful for understanding the maser emission mechanism and its limiting brightness temperature. The shape of the maser spots may be indicative of the type of physical phenomena responsible for the origin of the maser emission.
Several possible sites for the origin of maser emission - such as the shocks at the border of H ii regions, or the interaction region between a molecular outflow and ambient molecular clouds, as well as protoplanetary accretion disks around young star – have been suggested. The maser spot shape and size are important properties of the maser emission, provided they are intrinsic to the source, and not caused by a propagation effect such as interstellar scattering.
There is a widespread opinion that OH masers are heavily scattered by interstellar turbulence, and that observed images of maser spots are scattering-broadened images of essentially point-like sources. This view is based on data obtained from the study of scattering of pulsars and continuum sources. The importance of scattering for OH masers is due to their location within the thin galactic disk where the scattering is most severe.
Slysh et al. (1996) used a three-station VLBI network to measure the angular size of three compact OH masers. With a fringe separation of 4.2 mas and high signal-to-noise ratio data, the angular size of several spectral features in the two main-line OH transitions was measured simultaneously. The measured angular size was in the range from 1.40.4 mas to 4.30.1 mas. It was found that the angular size of the spectral features with the same radial velocity, presumably originating in the same region, was larger in the 1667-MHz line than in the 1665-MHz line. This cannot be the result of scattering, since the scattering size should be virtually the same at these two close frequencies. It was concluded that the measured angular size at 1667 MHz, 4.30.1 mas for OH34.260.15 and 3.50.2 mas for W48, is intrinsic to the sources. These two masers together with OH45.47+0.13 exhibit an angular size for spectral features which is much less than the average broadening estimated from pulsar measurements. The conclusion of that study was that the distribution of the scattering material in the Galaxy is patchy, and that these three masers are located in a direction of low interstellar scattering. Still higher angular resolution was achived in space-VLBI observations of OH masers using a 8-m telescope on board of the Japanese spacecraft HALCA and an array of large ground telescopes (Slysh et al. 2001). The observations of OH34.260.15 with the synthesized beam of about 1 mas partially resolved maser spots and confirmed the low interstellar scattering in the direction of this maser. In this communication we present additional space-VLBI data for OH masers OH34.260.15, W48 and CepA.
2. Observations and data reduction
Three OH masers were observed as a part of the Key Science Program of the Japanese Satellite HALCA in 1998, by the space-ground very long baseline interferometer. The satellite radio telescope has an 8-m diameter deployable parabolic mirror and uncooled L-band receiver, orbiting the Earth with a 6-h period, apogee 21000 km and perigee 560 km (Hirabayashi et al. 1998). The ground radio telescope array for OH34.26+0.15 was: the 70-m DSN telescope Tidbinbilla in Australia, the phased 622-m Australia Telescope, the 22-m Mopra Telescope in Australia, the Shanghai 25-m Telescope in China, the 64-m Telescope in Usuda, Japan, and the 64-m Telescope in Bear Lakes near Moscow. It was the first time that the Bear Lakes Telescope participated in space-VLBI observations; for W48: Australia Telescope, Mopra, Shanghai, 26-m telescope in South Africa (Hartebeesthoek), 26-m telescope in Hobart (Tasmania), 32-m telescope in Noto (Italy); for CepA: 70-m telescope in Robledo (Spain) and 10x25-m VLBA (USA).
Left circular polarization data over a 16-MHz bandwidth centered on the 1665-MHz and 1667-MHz OH main lines were recorded using S2 recorders at each station. The data were correlated using the Canadian S2 space-VLBI correlator. The 16 MHz data were filtered using a bandpass filter and then resampled before correlation in order to attain a spectral resolution of 488 Hz channel-1 (0.088 km s-1) over a bandpass of 500 kHz. The CepA data were recorded on VLBA recorders and correlated on the VLBA correlator in Socorro, USA, with the 16-MHz band divided in 1024 spectral channels, giving a spectral resolution of 15.625 kHz per channel (2.81 km s-1 ). Amplitude calibration was achieved using the ’gain’ and Tsys data obtained from ground observatories and from the VSOP operations group. The post-correlation data reduction and imaging was performed at the Astro Space Center using the aips package of NRAO. The strongest and most compact spectral feature was taken as a reference in the self-calibration process. Its position relative to the correlating position was determined by the fringe rate method, using the ground array.
3. Results
3.1. OH34.26+0.15


The correlated LCP spectra of OH34.26+0.15 on the short Australia Telescope – Mopra baseline on which the source is unresolved, in both main-line OH transitions, is shown in Fig. 1 (left). Five spectral features A–D and G are present in the 1665-MHz spectrum, and two features E and F in the 1667 MHz spectrum; their relative position is shown in Fig. 1 (right). All components are partly resolved with the beam of the space-ground or ground only array, but most of the components may have structure and consist of several smaller components. Feature B consists of four separate closely spaced spots. Feature F (1667 MHz) coincides with feature B within the measurement errors, and its shape is similar to the shape of feature B. These two features may come from the same maser condensation, a supposition that can be tested with higher accuracy relative 1665/1667 position measurements. If this is the case the radial velocities of features B and F must coincide, and the observed velocity difference of 0.5 km s-1 can be attributed to a difference between Zeeman splittings of 1665-MHz and 1667-MHz lines because of different g-factors of the two transitions. If the observed features B and F are -components of Zeeman pairs (both are left circular polarized), one can calculate that the velocity difference of 0.5 km s-1 corresponds to the magnetic field of B=4.2 milligauss, which is a value commonly found in OH masers.
OH34.260.15 is located at a distance of 3.8 kpc near a cometary H ii region and near two ultracompact H ii regions. Maser spots A, C and D coincide with the northern ultracompact H ii region G34.30.2B, while spots B, E, F and G coincide with the cometary H ii region G34.3+0.2C. Our map of OH components (Fig. 1) is consistent with the VLA map of the same source obtained by Gaume & Mutel (1987) in 1985.
The most compact component is feature A, which is known to be left hand circularly polarized. It was resolved in one direction; the angular size in this direction is 2.0 mas and less than 0.5 mas in the perpendicular direction. Feature A was fitted with an ellipse in position angle 70∘ with the ratio of major to minor axes greater than 4. This size is a result of the fitting and deconvolution with the beam of the image. As an almost independent check of the size of feature A, we made a direct fit of a Gaussian model to uv data using only fringe amplitude information. This procedure is independent in the sense that it does not use the self-calibration and global fringe fitting. The best fit to fringe amplitudes from three telescopes AT, Tid and HALCA was achieved with an elliptical Gaussian, having major and minor axes 2.60.5 and 0.30.3 mas and a position angle 61532 which, within the errors, is the same as obtained from the image. From our data it is not possible to say whether maser spot A has a stripe-like shape, or is composed of a chain of point-like sources. To determine this, one needs higher angular resolution and higher signal-to-noise data in order to obtain maps with a higher dynamic range.
The upper limit of the angular size of feature A corresponds to the lower limit of its brightness temperature of 6 K. Other features have somewhat larger sizes and lower brightness temperature limits, although it cannot be excluded that they consist of several unresolved subcomponents.
3.2. W48


The correlated 1665-MHz LCP spectrum on the short baseline is shown on Fig 2 (left). There are four spectral feature in the spectrum, and on the map four spots correspond to these features (Fig. 2 (right)). The largest separation between the spots is 100 mas, or 310 AU at the distance 3.1 kpc. In 1667-MHz line there is a single spectral feature at LSR velocity 42.2 km s-1 , the position of the 1667-MHz feature has not been measured. The 1667-MHz feature is resolved, with angular size 13.0x2.3 mas at the position angle 115∘. The minor axis in fact is an upper limit, therefore the 1667-MHz spot may be a 13 mas long filament of the width less than 2.3 mas, or a chain of closely spaced point sources. All 1665-MHz spots are unresolved with the VSOP-to-ground baselines, with the syntheesized beam 2.1x0.8 mas. The upper limit of the angular size of the brightest feature B is 1 mas, which corresponds to the linear size 3 AU.
There is no ultracompact region at the position of the OH maser, the nearest ultracompact region G35.201.74 is 20′′ away. However, there is a mid-infrared source MIR 1 (Persi et al. 1997) coinciding also with H2O maser HC1 (Hoffner & Churchwell 1996). Its luminosity is 240-300 L and can be due to a pre-main sequence star or a young star of the mass of about 4 M. The observed velocity spread of the OH maser 6.6 km s-1 and the separation of 310 AU are consistent with OH masers being gravitationally bound by the 4 M star in the middle. The lower limit of the brightness temperature of the brightest feature B is 4.2x10¹² K.
3.3. CepA
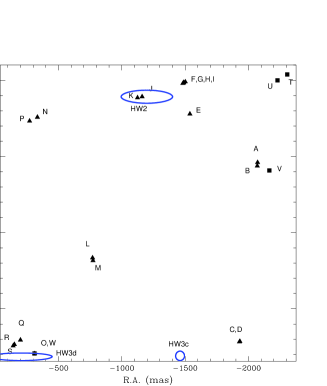

CepA was observed with HALCA and ground array consisting of the VLBA and 70-m telescope in Robledo, Spain. The tape recorder was VLBA recorder, and correlation has been done at the VLBA correlator, with 16 MHz band divided into 1024 spectral channels. This gave a very poor spectral resolution of 2.81 km s-1 , which was inadequate to resolve separate spectral features. Also, their amplitude was reduced due to the spectral smearing of narrow spectral features (typically 0.3 km s-1 ) in the wide spectral channels. Nevertheless, one can distinguish between several maser spots with VLBI mapping even if they are in the same spectral channels. Both 1665-MHz and 1667-MHz lines were in the same band which allowed to image both lines on the single map. The spot map of CepA is shown on Fig. 3 (left). 22 spots (4 spots at 1667 MHz and 18 spots at 1665 MHz) have been mapped with the ground array which provided the synthesized beam 3.3x4.0 mas. Only one 1667-MHz spot W coincides with the 1665-MHz spot O, within 1 mas. Other spots as all 1665-MHz spots are scattered over an area of about 2′′.5 by 3′′.5, or 1800 by 2500 AU at the distance of 0.7 kpc. This map is in a good agreement with the MERLIN map obtained by Migenes et al. (1992). In the same area there are several ultracompact HII regions (HW2, HW3c and D) shown on Fig. 3 (left) as ellipses (Torrelles et al. 1998). They are excited by massive B0-B1 stars each, of the mass 12-13M . The maser spots can be gravitationally bound to these stars, either to a particular star (spots S,R,Q,W,O to HW3d, spots K,J,E,F,G,H,I to HW2), or to the common gravitational potential of all the stars (the rest of the spots). The stars themselves can be gravitationally bound forming a multiple star system. At the mean distance of 1000 AU the orbital velocity for 13 M star is 3.5 km s-1 which is about the same as the velocity spread of OH maser features. The maser spots have been completely resolved on all ground-to-space baselines. Fig 3 (right) shows correlated flux versus baseline dependence for the brightest spot Q. The decline of the correlated flux with the baseline corresponds to a Gaussian spot size of 3.8 mas. The image of this spot (not shown) corresponds to a Gaussian source 5.1x3.4 mas. The size of the rest of 1665-MHz spots is of the same order. The 1667-MHz spots are much larger: the major axis is 18-20 mas, and the minor axis is from 4 to 13 mas. The linear size of the spots is from 3 to 14 AU, and the brightness temperature of the spot Q is 3.5x10¹² K.
4. Summary and conclusions
OH masers are associated with single massive stars or multiple star systems. The lowest mass star is 4 M star in W48, and the highest mass 25 M is in OH34.260.15. The maser spots are gravitationally bound to the stars, and may be on Keplerian orbits in single star systems, or on complicated orbits in multiple star systems, at the distance 150 AU to 3000 AU. The maser spots are partly resolved by the space-to-ground interferometer. The most compact are maser spots in W48. In CepA which is the nearest OH maser the maser spots were completely resolved. The linear size of the maser spots is several astronomical units in all masers. 1665-MHz masers are a factor of 3 more compact than 1667-MHz masers. The brightness temperature ranges from 3.5x10¹² K in CepA to more than 6x10¹² K in OH34.260.15. The interstellar scattering in the direction of these masers does not increase observed angular size and is less than 1 mas.
5. Acknowledgements
We gratefully acknowledge the VSOP project, which is led by the Japanese Institute of Space and Astronomical Science in cooperation with many organizations and radio telescopes around the world. The National Radio Astronomy Observatory is a facility of the National Science Foundation, operated under a cooperative agreement by Associated Universities, Inc. VIS, MAV and IEV acknowledge support from the INTAS (grant No. 97-11451) and from the Russian Foundation for Basic Research (grant No. 01-02-16902).
References
Gaume R.A. & Mutel R.L. 1987, ApJS, 65, 193
Hirabayashi H. et al. 1998, Science, 281, 1825
Hoffner P. & Churchwell E. 1996, A&AS, 120, 283
Migenes V., Cohen R.J., Brebner G.C. 1992, MNRAS, 254, 501
Persi P., Felli M., Lagage P.J., Roth M.L., Testi L. 1997, A&A, 327, 299
Slysh V.I. et al. 1996, MNRAS, 283, L9
Slysh V.I. et al. 2001, MNRAS, 320, 217
Torrelles J.M., Gomez J.M., Rodrigez L.F., Curiel S., Anglada G. 1998, ApJ, 509, 262