11email: E.Kuulkers@sron.nl, M.Mendez@sron.nl 22institutetext: Astronomical Institute, Utrecht University, P.O. Box 80000, 3508 TA Utrecht, The Netherlands 33institutetext: Astronomical Institute “Anton Pannekoek”, University of Amsterdam, and Center for High Energy Astrophysics, Kruislaan 403, 1098 SJ Amsterdam, The Netherlands
33email: homan@merate.mi.astro.it, michiel@astro.uva.nl 44institutetext: Department of Physics and Center for Space Research, Massachusetts Institute of Technology, Cambridge, MA 02138, USA
44email: lewin@space.mit.edu
X-ray bursts at extreme mass accretion rates from GX 17+2
We report on ten type I X-ray bursts originating from GX 17+2 in data obtained with the
RXTE/PCA in 1996–2000. Three bursts were short in duration (10 s), whereas the others
lasted for 6–25 min. All bursts showed spectral softening during their decay. There is no evidence
for high-frequency (100 Hz) oscillations at any phase of the bursts.
We see no correlations
of the burst properties with respect to the persistent X-ray spectral properties, suggesting
that in GX 17+2 the properties of the bursts do not correlate with inferred mass accretion rate.
The presence of short bursts in GX 17+2 (and similar bright X-ray sources) is not accounted for
in the current X-ray bursts theories at the high mass accretion rates encountered in this source.
We obtain satisfactory results if we model the burst emission with a black body,
after subtraction of the persistent pre-burst emission. The two-component spectral model does not fit
the total burst emission whenever there is a black-body component present
in the persistent emission. We conclude that in those cases the black-body contribution from the
persistent emission is also present during the burst. This implies that, contrary to previous suggestions,
the burst emission does not arise from the same site as the persistent black-body emission.
The black-body component of the persistent emission is consistent with being produced in
an expanded boundary layer, as indicated by recent theoretical work.
Five of the long bursts showed evidence of radius expansion of the neutron star
photosphere (independent of the spectral analysis method used),
presumably due to the burst luminosity reaching the Eddington value.
When the burst luminosity is close to the Eddington value, slight deviations from pure black-body radiation
are seen at energies below 10 keV. Similar deviations have been seen during (long) X-ray bursts from
other sources; they can not be explained by spectral hardening models.
The total persistent flux just before and after the radius expansion bursts
is inferred to be up to a factor of 2 higher than the net peak flux of the burst.
If both the burst and persistent emission are radiated isotropically,
this would imply that the persistent emission is up to a factor of 2 higher than the Eddington
luminosity. This is unlikely and we suggest that the persistent luminosity is close to the
Eddington luminosity and that the burst emission is (highly) anisotropic (2).
Assuming that the net burst peak fluxes equal the Eddington limit,
applying standard burst parameters (1.4 M☉ neutron star,
cosmic composition, electron scattering opacity appropriate for high temperatures), and
taking into account gravitational redshift and spectral hardening,
we derive a distance to GX 17+2 of 8 kpc, with an
uncertainty of up to 30%.
Key Words.:
accretion, accretion disks — binaries: close — stars: individual (GX 17+2) — stars: neutron — X-rays: bursts1 Introduction
X-ray bursts were discovered in 1975 from the source 4U 182030 (Grindlay & Heise 1975; Grindlay et al. 1976). It was realized soon thereafter that these were thermo-nuclear runaway events on the surface of neutron stars (Woosley & Taam 1976; Maraschi & Cavaliere 1977). Another kind of X-ray bursts was found (together with the above type of bursts) from MXB 1730355 (later referred to as the Rapid Burster), which were suggested to be due to accretion instabilities. The former and latter kind of bursts were then dubbed type I and type II, respectively (Hoffman et al. 1978a).
The main characteristics of type I bursts (for a review see Lewin et al. 1993) are: sudden and short (1 s) increase in the X-ray flux, exponential decay light curve, duration of the order of seconds to minutes, softening during the decay (attributed to cooling of the neutron star surface), (net) burst spectra reasonably well described by black-body emission from a compact object with 10 km radius and temperature of 1–2 keV, and total energies ranging from 1039 to 1040 erg. When the luminosity during the burst reaches the Eddington limit (i.e., when the pressure force due to radiation balances the gravitational force), the neutron star photosphere expands. Since L, when the radius of the photosphere, R, expands, the effective temperature, Teff, drops, with the burst luminosity, Lb, being constant (modulo gravitational redshift effects with changing R) at the Eddington limit, LEdd. Bursts during their radius expansion/contraction phase are therefore recognizable by an increase in the inferred radius with a simultaneous decrease in the observed temperature, while the observed flux stays relatively constant.
The emission from a (hot) neutron star is not expected to be perfectly Planckian, however (van Paradijs 1982; London et al. 1984, 1986; see also Titarchuk 1994; Madej 1997, and references therein). This is mainly due to the effects of electron scattering in the neutron star atmosphere, deforming the original X-ray spectrum. This results in a systematic difference between the effective temperature (as would be measured on Earth), Teff,∞, and the temperature as obtained from the spectral fits, Tbb (also referred to as ‘colour’ temperature, see e.g. Lewin et al. 1993). In general, the deviations from a Planckian distribution will depend on several parameters, such as temperature, elemental abundance, neutron star mass and radius. The hardening factor, Tbb/Teff,∞, has been determined through numerical calculations by various people and its value is typically around 1.7. When the burst luminosity approaches the Eddington limit the deviations from a black-body become larger, and so does the spectral hardening (Tbb/Teff,∞2, Babul & Paczyński 1987; Titarchuk 1988). During extreme radius expansion phases, however, this trend may break down and Tbb/Teff,∞1 (Titarchuk 1994). Attempts have been made to determine the spectral hardening from the observed cooling tracks, but conclusions are still rather uncertain (e.g. Penninx et al. 1989; Smale 2001). As a result, the interpretation of X-ray bursts spectra has remained uncertain and constraints on the mass-radius relationship for neutron stars elusive.
Type I X-ray burst theory predicts three different regimes in mass accretion rate (Ṁ) for unstable burning (Fujimoto et al. 1981, Fushiki & Lamb 1987; see also Bildsten 1998, 2000, Schatz et al. 1999, and references therein; note that values of critical Ṁ depend on metallicity, and on assumed core temperature and mass of the neutron star):
-
1)
low accretion rates; : mixed H/He burning triggered by thermally unstable H ignition
-
2)
intermediate accretion rates; – : pure He shell ignition after steady H burning
-
3)
high accretion rates; 4– : mixed H/He burning triggered by thermally unstable He ignition
H and He are burning stably in a mixed H/He environment for very low and very high values of , i.e. below and above (close to the critical Eddington Ṁ). During pure helium flashes the fuel is burned rapidly, and such bursts therefore last only 5–10 s. This gives rise to a large energy release in a short time, which causes the bursts often to reach the Eddington limit, leading to photospheric radius expansion. Bursts with unstable mixed H/He burning release their energies on a longer, 10–100 s, timescale, due to the long series of decays in the rp-process (see e.g. Bildsten 1998, 2000).
The Z sources (Hasinger & van der Klis 1989) are a group of sources inferred to persistently accrete near the Eddington limit. In a colour-colour diagram they trace out a Z-like shape, with the three limbs of the Z (historically) referred to as the horizontal branch (HB), normal branch (NB) and flaring branch (FB), from top to bottom. Ṁ is inferred to increase from sub-Eddington at the HB, near-Eddington at the NB to super-Eddington at the FB (e.g. Hasinger 1987; Lamb 1989; Hasinger et al. 1990). According to the burning regimes outlined above these sources should exhibit long (10–100 s) type I X-ray bursts, at least on the HB and NB. However, of the Z sources, only GX 17+2 and Cyg X-2 show (infrequent) bursts (Kahn & Grindlay 1984; Tawara et al. 1984c; Sztajno et al. 1986; Kuulkers et al. 1995, 1997; Wijnands et al. 1997; Smale 1998), indicating that most of the material is burning stably. This is in contrast to the above theoretical expectations for high Ṁ. Moreover, the bursts in Cyg X-2 are short (5 s), whereas GX 17+2 shows both short (10 s) and long (100 s) bursts. One of the bursts of Cyg X-2 showed a radius expansion phase (Smale 1998); this burst clearly bears all the characteristics of a He flash (regime 2), whereas the neutron star is inferred to accrete at near-Eddington rates. The short duration bursts in GX 17+2 also hint to a He flash origin, whereas the long duration bursts hint to unstable mixed H/He burning (regime 3; see also van Paradijs et al. 1988). A study of X-ray bursts from Cyg X-2 and GX 17+2 observed by EXOSAT showed no correlation of the burst properties with position in the Z, although the number of bursts observed from GX 17+2 was small (Kuulkers et al. 1995, 1997).
The Proportional Counter Array (PCA) onboard the Rossi X-ray Timing Explorer (RXTE) combines high throughput using a large collecting area (maximum of 6500 cm2) with the ability to label photons down to a time resolution of s. This is ideal to study short events like X-ray bursts, especially during the start of the burst. Such studies may provide more insight in the properties of X-ray bursts which occur at these extreme mass accretion rates. Analysis of X-ray bursts in persistent sources at (relatively) high inferred mass accretion rates (typically 0.2 ṀEdd) observed with the RXTE/PCA were presented for one burst seen with Cyg X-2 (Smale 1998) and one seen in GX 3+1 (Kuulkers & van der Klis 2000). In this paper we present the first account of ten X-ray bursts from GX 17+2 observed by the RXTE/PCA during the period 1996–2000. For a description of the correlated X-ray timing and spectral properties of GX 17+2 using the same data set we refer to Homan et al. (2001).
2 Observations and Analysis
| Year | Start (UT) | End (UT) | texpb | of | ||||
| (ksec) | bursts | |||||||
| 1996 | feb | 07 | 13:27 | feb | 09 | 00:02 | 58 | 1 |
| 1997 | feb | 02 | 19:13 | feb | 27 | 03:34 | 59 | 1 |
| 1997 | apr | 01 | 19:13 | apr | 04 | 23:26 | 35 | 0 |
| 1997 | jul | 27 | 02:13 | jul | 28 | 00:33 | 43 | 0 |
| 1998 | aug | 07 | 06:40 | aug | 08 | 23:40 | 71 | 1 |
| 1998 | nov | 18 | 06:42 | nov | 20 | 13:31 | 86 | 2 |
| 1999 | oct | 03 | 02:43 | oct | 12 | 07:05 | 298 | 5 |
| 2000 | mar | 31 | 12:15 | mar | 31 | 16:31 | 7 | 0 |
| a Between Feb 2–27, 1997 observations every 3–6 days. | ||||||||
| b Total effective exposure time. | ||||||||
The PCA (2–60 keV; Bradt et al. 1993) onboard RXTE observed GX 17+2 various times during the mission. Up to now a total of 657 ksec of useful data has been obtained. A log of these observations is given in Table 1. During the observations in 1996–1998 all five proportional counter units (PCUs) were active, whereas in 1999 and 2000 only three units were active. The high voltage settings of the PCUs have been altered three times during the mission (so-called gain changes), which modified the response of the detectors. These changes therefore mark four periods, called gain epochs. The observations were done in two standard modes: one with relatively high spectral resolution (129 energy channels covering the whole PCA energy band) every 16 sec, the Standard 2 mode, the other having no spectral information providing the intensity in the whole PCA energy band at a moderate time resolution of 0.125 s, the Standard 1 mode. Additionally, data were recorded in various high time resolution (2 ms) modes that ran in parallel to the Standard modes, and that recorded photons within a specific energy band with either low spectral resolution (B-modes or E-modes) or no spectral resolution (SB-modes). The B-, E- and SB-modes used here combined the information from all layers of all active PCUs together. During the 1996 observations a B- and E-mode were available, giving 16 and 64 energy bands, covering channels 0–49 and 50–249, at 2 ms and 125 s, respectively. For most of the observations in 1997 four SB modes covering the total PCA energy range were available. In the 1998, 1999, and 2000 observations two SB-modes covering channels 0–13 and 14–17 at 125s, and an E-mode giving 64 energy bands covering channels 18–249 at 16 s time resolution were available.
For the spectral analysis of the persistent emission we used the Standard 2 data. We accumulated data stretches of 96 s just before the burst, combining the PCUs which were operating at that time. In order to study the spectral properties of the bursts we used two approaches. Spectra during the bursts were determined every 0.25 sec for the first 20 s of the burst. For the short bursts this means the whole duration of the burst. For the long bursts we also used the Standard 2 data to create spectra at 16 s intervals, for evaluating the remainder of these bursts. Since no high time resolution spectral data were available during the 1997 observations (only 4 SB-modes), only the Standard 2 data were used to study the spectral properties of the burst from this observation. All spectra were corrected for background and dead-time using the procedures supplied by the RXTE Guest Observer Facility111http://heasarc.gsfc.nasa.gov/docs/xte/recipes/cook_book.html.. A systematic uncertainty of 1% in the count rate spectra was taken into account. For our spectral fits we confined ourselves to the energy range of 3–20 keV, which is best calibrated. The hydrogen column density, NH, towards GX 17+2 was fixed to that found by the Einstein SSS and MPC measurements (21022 atoms cm-2, Christian & Swank 1997; see also Di Salvo et al. 2000). In all cases we included a Gaussian line (see Di Salvo et al. 2000) fixed at 6.7 keV, with a fixed line width of 0.1 keV. One sigma confidence errors were determined using .

Large amplitude, high coherence brightness oscillations have been observed during various type I X-ray bursts in other low-mass X-ray binaries (LMXBs; see e.g. Strohmayer 1998, 2001). We searched all the bursts from GX 17+2 for such oscillations. Using the high time resolution modes we performed Fast Fourier Transforms to produce power spectra with a Nyquist frequency of 2048 Hz. This was done in the total energy band (2–60 keV) and in a high energy band ranging from 8 keV to 20 keV. For the 1996 observations, however, the high time resolution mode only covered the 13.5–60 keV range; the 2–60 keV power spectra had a Nyquist frequency of 256 Hz. In all cases, our searches were carried out on power spectra of 0.25 s or 2 s in duration. To increase the sensitivity for cases where burst oscillations are only present for a period of time comparable or shorter than the length of the power spectrum, we ‘oversampled’ the data by factors of 2 and 8, respectively, by taking the start time of the next data segment to be 0.125 s and 0.25 s later than that of the previous one, instead of 0.25 s and 2 s (i.e. we use overlapping data segments) .
| eventa | Start Time (UT) | Eb | PCUsc | tdurd | trisee | tfrf | texpg | /dofh | branchi | |||
| b1 | 1996 | feb | 08 | 16:17:12 | 1 | 5 | 10 | 1.22 | 0.35 0.05 | 1.83 0.08 | 1.1/130 | mNB |
| b2 | 1997 | feb | 08 | 02:36:34 | 3 | 5 | 360 | 1.19 | 0.34 0.08 | 248 | 2.5/49 | mNB |
| b3 | 1998 | aug | 07 | 13:15:50 | 3 | 5 | 10 | 0.53 | 0.27 0.09 | 2.55 0.24 | 1.0/131 | lNB |
| b4 | 1998 | nov | 18 | 08:51:26 | 3 | 5 | 1000 | 1.34 | 0.61 0.04 | 197 2 | 3.7/147 | SV |
| b5 | 1998 | nov | 18 | 14:37:30 | 3 | 5 | 10 | 0.41 | 0.54 0.04 | 2.06 0.13 | 1.1/85 | mNB |
| b6 | 1999 | oct | 03 | 15:36:32 | 4 | 3 (0,2,3) | 1600 | 0.41 | 0.19 0.04 | 274 3 | 2.0/242 | lHB |
| b7 | 1999 | oct | 05 | 23:41:43 | 4 | 3 (0,2,4) | 500 | 0.56 | 0.30 0.03 | 77.3 1.2 | 1.9/104 | uNB |
| b8 | 1999 | oct | 06 | 11:10:33 | 4 | 3 (0,2,3) | 500 | 1.66 | 0.13 0.02 | 70.2 1.4 | 1.2/57 | lHB |
| b9 | 1999 | oct | 09 | 12:34:24 | 4 | 3 (0,2,3) | 500 | 0.13 | 0.16 0.02 | 76.4 1.5 | 3.1/66 | uNB |
| b10 | 1999 | oct | 10 | 09:10:47 | 4 | 3 (0,2,3) | 700 | 0.72 | 0.20 0.04 | 115 3 | 3.7/57 | lNB |
| f1 | 1996 | feb | 07 | 03:39:11 | 1 | 5 | 10 | 1.03 | 1.12 0.07 | 2.98 0.49 | 1.3/88 | mFB |
| f2 | 1998 | nov | 19 | 14:38:24 | 3 | 5 | 10 | 0.41 | 0.33 0.04 | 1.72 0.35 | 1.1/28 | uFB |
| f3 | 1998 | nov | 20 | 00:44:43 | 3 | 5 | 10 | 0.75 | 0.45 0.06 | 1.85 0.25 | 1.1/55 | uFB |
| f4 | 1999 | oct | 11 | 08:55:30 | 4 | 3 (0,2,3) | 10 | 5.0 | 1.06 0.20 | 2.18 0.22 | 1.1/148 | lFB |
| a Designation used in text. | ||||||||||||
| b RXTE gain epoch of the observation. | ||||||||||||
| c Numbers of active PCUs; if 5 the PCU unit numbers are given between brackets. | ||||||||||||
| d Approximate duration in sec. | ||||||||||||
| e Time (sec) for the count rate to rise from 25% to 90% of the net-peak rate. | ||||||||||||
| f Duration of fast rise phase in sec, see text. | ||||||||||||
| g Exponential decay time in sec. | ||||||||||||
| h Goodness of the exponential fit to the decay part of the light curve. | ||||||||||||
| i Source position in the Z just before the event (see also Fig. 16); u, m, and l stand for upper, middle and lower, | ||||||||||||
| respectively. SV means ‘soft’ vertex, i.e. the NB/FB transition region. | ||||||||||||
3 Results
3.1 Temporal behaviour


Inspection of all the Standard 1 light curves of GX 17+2 at 1 s time resolution yielded a total of fourteen burst-like events (designated b1, b2, …, b10, f1, …, f4; the reason for different designations is the nature of the events, see below). Seven events were rather short, 10 s (b1, b3, b5, f1–f4), whereas the other events were long, 360–1600 s (b2, b4, b6–b10). Table 2 gives the start times of these events, together with the gain epoch in which the observations were done and the number of active PCUs. In that table we also give the duration of the events as estimated by eye using the light curves in the total PCA energy band and/or the hardness (ratio of count rates in two energy bands) curves, the rise time of the event as determined in two ways (see below), and the exponential decay time as determined from a fit to the decay part of the Standard 1 light curves, together with the goodness of this fit expressed in terms of reduced , . We note that the estimates of the durations are rather arbitrary, but robust methods such as the so-called T90 measurements222T90 is defined as the time it takes to observe 90% of the total background-subtracted counts in an event, starting and ending when 5% and 95% of the total background-subtracted counts have been observed. as used for -ray bursts (see Koshut et al. 1996, and references therein) can not be applied, especially to the longer events, since the persistent emission varies on the same time scale (or even fatser) as the event itself, see e.g. Fig. 1. The rise time of the events was determined as follows. We constructed light curves in the full PCA energy band with a time resolution of 1/32 sec. We defined trise as the time for the event to increase from 25% to 90% of the net peak event rate (see e.g. Muno et al. 2000; van Straaten et al. 2001). A detailed look at the light curves revealed that the onset of events b1–b4, b8, b10, and f2 consisted of a rapid rise phase and a subsequent slower rise to maximum. In the events b5–b7, b9, f1, and f3 the count rate rapidly increased to maximum, with no subsequent slower rise. We therefore also fitted the pre-event phase, fast rise phase (and slow rise phase) with a constant level and one (or two) linear functions, respectively, using the Standard 1 light curves. We find that the total duration of the fast rise phase, tfr, is between 0.1 and 0.6 sec for events b1–b10 and 0.4–1 s for f1–f4 (Table 2). In the fits to the decay portion of the light curves for the short events we used the Standard 1 light curves at 0.125 sec time resolution, while for the longer events we rebinned these light curves to a time resolution of 5 sec. For some of the events an exponential does not describe the decay very well; this is probably due to the short term variations in the persistent emission. For these events we fitted only the initial decay (first few seconds for f2 and f3, and first few 100 s for burst b9 and b10).
In Fig. 2 we show the light curves of the four events f1–f4, at low (7 keV) and high (7 keV) energies, with the corresponding hardness (ratio of the count rates in the high and low energy band) curves, all at a time resolution of 0.125 s. Although they have a fast rise and a longer decay (see also Table 2), they show small or no variations in hardness. Time-resolved spectral analysis (like done in Sect. 3.2.3) confirmed this; no clear cooling during the decay can be discerned. We can therefore not classify these events as type I bursts. Since all of the four events occurred in the FB, we conclude that they must be flares, of which the light curves happen to resemble those of X-ray bursts (such as b1, b3 and b5). We will not discuss these four events further in the paper and denote the remainder of the ten events as bursts, since we will show below that they are genuine type I X-ray bursts.


In Fig. 3 we show the light curves of the three short bursts b1, b3 and b5, at low and high energies, with the corresponding hardness curves, all at a time resolution of 0.125 s. All three bursts show a fast rise (typically less than 0.5 s) and an exponential decay with a decay time of 2 s (see Table 2). During the rise the emission hardens; as the bursts decay, the emission becomes softer. The main difference between the three bursts is the fact that the peak of burst b3 is about 25% lower than the other two bursts; it looks like a ‘failed’ burst. It also has two peaks, as if some new unstable burning occurred, 5 s after the start of the burst.
In Figs. 4 and 5 we show the light curves of the long bursts b2, b4, and b6–b10, at low and high energies, with the corresponding hardness curves, all at a time resolution of 2 s. In Figs. 6 and 7 we focus on the start of these bursts, all at a time resolution of 0.125 s. Again the rise times are very short (also typically less than 0.5 s), but the decay times are much longer, with decay times in the range 70–280 s (see Table 2). Apart from the fact that the hard burst emission decays faster than the soft burst emission (i.e. spectral softening), there are more pronounced differences between the light curves in the two energy bands. In Figs. 4 and 5 one sees that all the low energy light curves show a kind of spike at the start of the decay. These spikes last for a few seconds in most cases; however, for burst b6 it seems to last 15 s (with an exponential decay time of 92 s). At high energies no such spikes occur (except for burst b10); instead the bursts have more flat-topped peaks, with durations ranging from tens of seconds to 200 s. Burst b6 is the nicest example of this. Zooming in on the start of these long bursts, it becomes clear that the rise is somewhat slower at high energies with respect to low energies (causing the hardening of the emission during the early phase of the burst). Also, in bursts b4 and b6–b9 very short (0.5 s) spikes occur during the rise in the high energy light curve, which again are especially evident in burst b6 (two spikes!). This causes the hardness to drop on the same time scale in some of these bursts. Later we will show that this corresponds to fast radius expansion/contraction episodes.

3.2 Spectral behaviour
3.2.1 Persistent emission before the bursts
| Fpersb | kTbb | Rbb,10c | d | Ecut | norm.e | gnorm.f | / | bbg | Ph | |
| (2–20 keV) | (keV) | (km) | (keV) | dof | ||||||
| b1 | 2.00.3 | 1.150.06 | 14.11.5 | 1.00.1 | 4.50.2 | 3.80.4 | 0.0130.002 | 0.89/47 | 16 | 510-10 |
| b2 | 2.20.5 | 1.100.03 | 22.12.2 | 0.40.2 | 3.80.2 | 1.50.4 | 0.0080.002 | 0.56/40 | 29 | 410-18 |
| b3 | 1.90.3 | 1.130.03 | 19.21.5 | 0.90.1 | 4.20.2 | 2.60.4 | 0.0130.002 | 0.58/40 | 29 | 110-18 |
| b4 | 2.00.3 | 1.100.04 | 20.31.8 | 0.70.1 | 4.00.2 | 2.30.4 | 0.0140.002 | 0.85/40 | 28 | 610-15 |
| b5 | 2.30.3 | 1.160.05 | 17.51.7 | 0.90.1 | 4.50.2 | 3.20.4 | 0.0100.002 | 0.59/40 | 23 | 510-15 |
| b6 | 2.50.1 | — | — | 1.030.03 | 5.10.1 | 4.80.1 | 0.0120.002 | 0.71/35 | 7i | 8 |
| b7 | 2.50.1 | — | — | 1.170.03 | 4.60.1 | 7.00.2 | 0.0150.002 | 1.22/35 | 2i | 30 |
| b8 | 2.40.5 | 1.080.13 | 11.04.3 | 1.00.1 | 5.30.3 | 3.80.5 | 0.0110.002 | 1.13/33 | 6 | 1 |
| b9 | 2.40.4 | 1.260.08 | 11.61.5 | 1.00.1 | 4.90.3 | 4.30.4 | 0.0100.003 | 0.87/33 | 13 | 810-5 |
| b10 | 1.90.3 | 1.180.05 | 15.11.4 | 1.10.1 | 4.50.3 | 3.70.5 | 0.0110.002 | 1.16/33 | 22 | 510-7 |
| a NH was fixed to 21022 atoms cm-2, see text. | ||||||||||
| b Unabsorbed persistent flux in 10-8 erg s-1 cm-2. | ||||||||||
| c Apparent black-body radius at 10 kpc. | ||||||||||
| d Power-law photon index. | ||||||||||
| e Power-law normalization in photons keV-1 cm-2 s-1 at 1 keV. | ||||||||||
| f Normalization in photons cm-2 s-1 in the line modeled by a Gaussian fixed at 6.7 keV and width () of 0.1 keV. | ||||||||||
| g Black-body emission contribution to the total persistent flux in % (2–20 keV). | ||||||||||
| h Probability (in%) that inclusion of a black-body component is not significant. | ||||||||||
| i 95% confidence upper limit, using kTbb=1.14 keV, see text. | ||||||||||
The persistent emission just before the bursts b6 and b7 can be satisfactorily (=0.7 and 1.2, respectively, for 35 degrees of freedom, dof) described by an absorbed cut-off power-law component plus a Gaussian line. For the persistent emission before the remainder of the bursts this is not a satisfactory model ( ranges from 1.4 with 35 dof for b8 to 5.5 with 42 dof for b3). An additional component is necessary to improve the fits. We used the F-test to calculate whether the additional component was indeed significant. For the additional component we chose a black body, as is generally used when modeling the X-ray spectra of bright LMXBs (e.g. White et al. 1986; Christian & Swank 1997; Church & Bałucińska-Church 2001). Note that more complicated models are necessary to describe the spectra of GX 17+2 with better energy resolution and broader energy range (e.g. Di Salvo et al. 2000). However, our approach is adequate for this paper. In the rightmost column of Table 3 we give the results of our F-tests, i.e. the probability that the addition of the black-body component in the spectral fits is not significant. We conclude that except for bursts b6 and b7, an additional component is warranted on the 99% level. In Table 3 we present the results of the spectral fits to the persistent emission. Some of the values are rather small (bursts b2, b3, b5), perhaps due to a slight overestimate of the systematic error added (1%). The unabsorbed persistent flux just before the bursts during the various observations varied between 1.9–2.510-8 erg s-1 cm-2 (2–20 keV). For bursts b6 and b7 we determined single parameter 95% confidence upper limits (using =2.71) on the black-body contribution, by including a black-body component in the spectral fits, and fixing the temperature to its mean value derived for the persistent spectra of the other bursts, i.e. kTbb=1.14 keV. The black-body component contribution to the persistent emission varied between less than 2% (burst b7) up to 29% (bursts b2, b3) in the 2–20 keV band (Table 3).


3.2.2 Persistent emission during the bursts?
3.2.2.1 Previous EXOSAT results
Usually it is assumed that the persistent emission is not influenced by the burst and that one can, therefore, study the burst by subtracting the persistent emission from the total source emission. This is referred to as the ‘standard’ burst spectral analysis (see e.g. Sztajno et al. 1986). However, if the neutron star photosphere contributes significantly to the persistent emission, this approach is not correct, if the burst emission originates from the same region (van Paradijs & Lewin 1986). In this case the spectral fits to the net burst spectra yield a systematically larger black-body temperature, Tbb, and smaller apparent black-body radius, Rbb, especially near the end of the burst when the net burst flux is low. In fact, in this case of incorrect subtraction of the persistent emission, the net burst spectrum is not a black-body. Van Paradijs & Lewin (1986) proposed to fit the total source spectrum with a two-component model, a black-body component and a non-black-body component. During the burst the non black-body component is fixed to what is found in the persistent emission, and the black-body component is left free. The black-body component should include all emission from the neutron star photosphere. The underlying idea is that the non black-body component arises from the accretion process, and is not influenced by the X-ray burst.
GX 17+2 is a bright X-ray source, and presumably the neutron star contributes significantly to the persistent emission (Van Paradijs & Lewin 1986; Sztajno et al. 1986). Since the source is bright, compared to most other burst sources the net flux at the peak of the burst relative to the persistent flux is rather low. Sztajno et al. (1986) found that the black-body component contributed 40% to the persistent emission just before the two bursts observed by EXOSAT. Using the ‘standard’ burst spectral analysis Sztajno et al. (1986) found relatively high black-body temperatures (kTbb2–3 keV) and relatively small apparent black body radii at a distance of 10 kpc (Rbb,103–5 km, for isotropic emission) for the short (10 s) burst. For the long (5 min) burst, kTbb only showed a small change from 2.1 keV at the peak of the burst to 1.7 keV near the end of the burst, with Rbb,10 decreasing from 7 km to 4 km. Their fits were, however, satisfactory, with of 0.6–1.2. Using the two-component model, Sztajno et al. (1986) found that during the short burst the values for Tbb were in the range normally seen in type I X-ray bursts, and that the systematic decrease in Rbb had disappeared. The values for the two-component model fits ranged between 0.6 and 1.3, except for one fit, for which =1.6, i.e. slightly worse than the ‘standard’ spectral analysis. They attributed this to the smaller relative error in the total burst data than in the net-burst data, for which the persistent emission was subtracted. Note that in this case Sztajno et al. (1986) found a slight increase in Rbb,10, apparently anti-correlated with Tbb, which they argue was due to the non-Planckian shape of the spectrum of a hot neutron star (van Paradijs 1982; see Titarchuk 1994; Madej 1997, and references therein; see, however, Sect. 5.2).
3.2.2.2 Our RXTE results
Guided by the results of Sztajno et al. (1986) discussed in Sect. 3.2.2.1, we first fitted the total burst data using a black body and a cut-off power law plus a Gaussian line. The parameters of the absorbed cut-off power law and Gaussian line were fixed to the values found for the persistent emission before the burst (Table 3). Using this model we obtained good fits to the 16 s spectra of bursts b6 and b7, for which the persistent emission did not contain a significant black-body contribution ( of 1 for 37 dof). However, the 16 s spectral fits were bad whenever the persistent emission spectra contained a black-body component; the fits became worse as the persistent black-body contribution became stronger (for the first 100 s of the burst: /dof1.5–3/37 [burst b8], /dof2.5–8/37 [burst b9], /dof5–10/37 [burst b10], /dof20–24/44 [burst b4], /dof22–25/44 [burst b2]). The worst occurred near the peak of the bursts. For instance, Fig. 8 shows the best-fit parameters and for burst b4, for which the persistent emission had a black-body contribution of 28% (2–20 keV). An example of a burst spectrum and the result of the two-component fit is shown in Fig. 9a for burst b2. The with 44 dof for burst b4 decreases from 24 at the beginning of the burst to 2 near the end of the burst. A similar trend is seen for the 0.25 s burst spectral fits: of 2 for 18 dof during the first 10 s of burst b4 and an of 1 for 16 dof during the first 10 s of burst b6 (see Fig. 8). The values for 0.25 s spectral fits were much lower than those for the 16 s spectral fits, due to the much lower signal to noise and lower spectral resolution of the 0.25 s spectra. Note that the high values of for the 16 s spectra are not due to fast spectral variations within the time the spectra are accumulated. This only applies to spectra which include the first few seconds of the bursts, during the short radius expansion and initial contraction phase (see Sect. 3.2.4). Halfway the decline of burst b4, Rbb seems to increase again; this is also seen in the other long bursts (except burst b6), and in the short bursts (e.g. burst b1, see Fig. 8). This is similar to that seen by Sztajno et al. (1986), but their fits seemed better (see Sect. 3.2.2). This is (probably) due to the much lower signal to noise ratio of the EXOSAT/ME data.

The mean bolometric black-body flux during the first 10 s after the peak, Fbb,peak, of bursts b4 is higher than that of burst b6. The difference is 0.63(0.12)10-8 erg s-1 cm-2 (for the uncertainty in Fbb,peak we used the rms variation in the bolometric black-body fluxes). This is consistent with the bolometric black body contribution in the persistent emission, Fbb,pers, before burst b4 (indicated by the dotted lines in the top panels for burst b4 in Fig. 8): Fbb,pers=0.65(0.05)10-8 erg s-1 cm-2. We measured Fbb,peak and Fbb,pers for all the bursts to see if this effect is seen in other bursts as well. We used the highest observed black body flux, except for burst b2 where we used the first 16 s measurement after the start of the burst. The result is displayed in Fig. 10a. Indeed, Fbb,peak differs between the bursts and is clearly correlated with Fbb,pers (except for burst b3). Such a relation can be expected if Fbb,peak is close to a certain upper limit (presumably the Eddington limit) and includes a (certain fraction) of the persistent emission. We can reasonably fit the data points to the function F (excluding bursts b2 and b3; burst b2 did not cover the first 10 s after the peak of the burst, and burst b3 was weaker than the other bursts). The resulting =2.0 for 7 dof. We find 10-8 erg s-1 cm-2; this is close to the values of Fbb,peak for bursts b6 and b7 which had no significant black-body contribution in the preceding persistent emission. In Fig. 10 we have also indicated whether a burst was a radius expansion event (see Sect. 3.2.4). It can be seen in Fig. 10a that the bursts with no radius expansion/contraction phase (except burst b3) have somewhat higher values of Fbb,peak than the radius expansion bursts (except burst b4). Theoretically, during the radius expansion/contraction phases the flux should equal the Eddington limit. Therefore, the (peak) fluxes observed for different radius expansion bursts should have similar values, whereas for bursts with no radius expansion/contraction phase they should be either similar or smaller. This is not the case.

To summarize, we find that the method proposed by Van Paradijs & Lewin (1986) and applied by Sztajno et al. (1986) to the bursts observed by EXOSAT does not work for our bursts observed with the RXTE/PCA. The two-component spectral fits during the bursts give bad results whenever there is a black-body contribution to the per-burst persistent emission. Moreover, the total burst peak fluxes, Fbb,peak are different from burst to burst and depend on the amount of the black-body contribution to the persistent emission, Fbb,pers. This is not what one would expect if during some of the bursts a limit is reached (presumably the Eddington limit). We conclude that the persistent black-body emission does not disappear during the burst. An example is displayed in Fig. 9b. We show again the first 16 s spectrum during burst b2 plus now the results of a three-component fit, i.e. two black bodies and a cut-off power-law plus Gaussian line (subjected to interstellar absorption). The parameters of the cut-off power law plus Gaussian line and one black-body component have been fixed to those found for the persistent emission (so the fit does have the same number of dof as the one displayed in Fig. 9a). Clearly, the fit has improved considerably. This means that the burst emission is decoupled from the persistent emission, and therefore the ‘standard’ spectral analysis should work in this case. This is the subject of the next subsection.
3.2.3 ‘Standard’ spectral analysis: net burst emission

When modeling the net burst spectra (i.e. spectra obtained after subtraction of the pre-burst persistent emission from the total source spectrum) by a black body, the spectral fits are almost all satisfactory ( values of 1). The fit results are shown for the 3 short bursts in Fig. 11 (b1, b3, b5) and for the 7 long bursts in Figs. 12 (b2, b4, b7–b10) and 13 (left panel; b6). For the long bursts we used a logarithmic time scale, to emphasize the start of the bursts, where changes in the parameters are most rapid.
The fits are, while much improved overall, still not optimal during the peaks of the long bursts b4, b6 and b10 (2–3 with 44 [b4] or 37 [b6,b10] dof for the spectral fits to the 16 s spectra). In Fig. 14 we show the average net burst spectrum during the flat top part of burst b6 excluding the radius expansion and initial contraction phase (Sect. 3.2.4), i.e. 27–187 s after the start of the burst. Tbb and Rbb,10 do not change much during this interval. Clearly, deviations occur below 10 keV; the intensity drops below 5.5 keV, while there is an excess between 5.5–8 keV. These deviations are much larger than the calibration uncertainties.
In the short bursts Tbb decreases during the decay, indicating cooling of the neutron star, as already noted from the hardness curves. There are some slight variations in Rbb,10 and Tbb during the first few seconds. However, considering the behaviour of the net burst black-body flux, Fbb,net, they do not show the correlations that would be expected for radius expansion events, i.e. an increase in Rbb,10 with a simultaneous drop in Tbb and a (nearly) constant Fbb,net.

The long bursts all show more or less the same behaviour (note again that for burst b2 we have no short time scale spectral information, see Fig. 12). After a fast increase (0.5 s) to maximum, Fbb,net remains constant (1.4–1.710-8 erg s-1 cm-2 for the various bursts) for 50–200 s, and then decays exponentially. The duration of this flat-topped phase is similar to that seen in the light curve at high energies (see middle panels of Figs. 4 and 5). During the first part Tbb increases, then it levels off, to decrease again when Fbb,net decreases.
Rbb,10 is 5 km during the decay of the burst, until Fbb,net drops below typically 0.210-8 erg s-1 cm-2. Then Rbb,10 decreases again. Note that this latter behaviour resembles the systematic effects described by van Paradijs & Lewin (1986) near the end of the burst, when the persistent emission becomes important with respect to the net burst emission (Sect. 3.2.2.1). However, we have argued above that the burst black-body emission is decoupled from the persistent black-body emission. It is unlikely that this behaviour is due to the fact that we assumed a constant persistent component during the bursts, while in fact the persistent component may vary on the same time scale of the burst or faster (see Sect. 3.1). If that was the case, one would expect that in some bursts Rbb would decrease, whereas in some others it would increase. On the contrary, we find that Rbb decreases in all bursts. We will discuss this issue in Sect. 5.2.2.
3.2.4 Radius expansion bursts
The most dramatic changes in the spectral parameters can be seen during the first few seconds of the long bursts: while there is a short dip in Tbb near the start of the burst, Rbb,10 shows values which are up to a factor of 6 larger than those found later on (although this is not true for burst b10, see Fig. 12). This is typical of radius expansion/contraction episodes, as described in Sect. 1. Burst b6 shows this behaviour clearest, and may have had even two of such episodes within one second (Fig. 13, left panel). The expansion to maximum radius takes place in less than 0.5 s, while the initial contraction phases are longer: it takes between 5 and 20 s from maximum expansion back to close to the neutron star surface. The final contraction phase lasts between 20 and 180 s We conclude that bursts b4, and b6–b9 are radius expansion bursts.
In Fig. 10b we show the (average) net-burst peak fluxes, Fbb,net_peak, determined in the same way as in the previous subsection for Fbb,peak, but now for the net-burst emission. Most of the net burst peak fluxes are in the same range. For the radius expansion bursts this is expected, if the Eddington limit is reached. Note that Fbb,peakFbb,net_peak for bursts b6 and b7, as expected if there is no black-body contribution to the persistent emission. We conclude that Fbb,net_peak in the radius expansion bursts is a measure of the Eddington luminosity observed at Earth. We find that Fbb,net_peak for the non-radius expansion bursts (except bursts b3) is more or less similar to the maximum flux for the radius expansion bursts.
Radius expansion events are most conveniently displayed in a flux-temperature diagram (where temperature increases from right to left, analogous to HR-diagrams). Our best example, burst b6, is displayed this way in the right-hand panel of Fig. 13. In this diagram the radius expansion/contraction phase and the subsequent cooling of the neutron star are clearly distinguished by two separate tracks (see e.g. Lewin et al. 1993). The data points distributed along the horizontal line in the upper part of the diagram (i.e. nearly constant Fbb,net of 1.2–1.310-8 erg s-1 cm-2) represent the expansion/contraction phase. The data points distributed along the diagonal line from the upper left to the lower right part of the diagram are from the cooling phase of the burst. We note that the point in between the two tracks is from the very first rise phase. Comparing both panels of Fig. 13 it is apparent that the burst spends a long time near the vertex of both tracks, about 150 s, where Fbb,net1.2410-8 erg s-1 cm-2 and kTbb2.65 keV. The first part (Fbb,net0.410-8 erg s-1 cm-2) of the cooling track is well described (=0.6 for 9 dof) by a straight line with a slope of 4.140.15 (dotted line in Fig. 13), i.e. Fbb,net is consistent with being proportional to T, as expected if the neutron star photosphere radiates as a black-body with constant effective area. Below Fbb,net0.410-8 erg s-1 cm-2 the data start to deviate from this relation. The flux-temperature diagrams for the other long bursts are more or less consistent with the behaviour of burst b6, although the exact locations of the vertices between the radius expansion/contraction phase and the cooling phase differ slightly (kTbb2.3–2.6 keV, Fbb,net1.2–1.3510-8 erg s-1 cm-2). The early parts of the cooling phases for the other long bursts are in most cases also consistent with black-body cooling, although the flux level at which they start to deviate from Fbb,netT varies from burst to burst (e.g. 110-8 erg s-1 cm-2 for burst b4). The slope becomes somewhat steeper below these fluxes for all bursts.
3.2.5 The radius expansion/contraction track
As we have shown above, the observed net burst flux is consistent with being constant during the radius expansion/contraction phases. For instance, for burst b6 a constant fit yields Fbb,net1.24 erg s-1 cm-2 with a reduced of 1.4 for 29 dof, excluding the highest flux point. However, for a constant composition and constant (an)isotropy of the radiation, one would expect to see a slight increase in the observed bolometric burst flux with increasing photosphere radius, since the gravitational redshift decreases (see e.g. Lewin et al. 1993). In Fig. 15, we zoom in on the observed radius expansion/contraction phase of burst b6 (note that for Fbb,net and Tbb we now use a linear scale). Overdrawn is an example of the expected relation between bolometric burst flux and the photospheric radius (continuous line), for ‘standard’ values of the mass of the neutron, =1.4 M☉, the hydrogen fraction (by mass), =0.73, the spectral hardening factor, Tbb/Teff,∞=1.7, and high-temperature electron scattering opacity, see Appendix B for details. The curve was normalized so as to give the observed values of Fbb,net and Tbb at touch down (the leftmost point of the radius expansion/contraction track). In practice this is analogous to solving for the distance and the photospheric radius R at touch down (see Appendix B). We can see that the curve does not follow most of the data points. Taking the low-temperature electron scattering opacity (but keeping the other parameters at their ‘standard’ values, see above) makes the disagreement even larger (dash-dot-dot-dotted line in Fig. 15). There are three ways to flatten the radius expansion/contraction track, or equivalently, to reduce the gravitational redshift corrections. The most obvious one is to lower the mass of the neutron star; the expected track (dash-dotted line) for =0.5 M☉ is given. However, such a low-mass neutron star is in not in line with the observed and expected masses for neutron stars (see e.g. Thorsett & Chakrabarty 1999). A second option is to lower the hydrogen content of the burning material (shown by the dashed line for =0). However, the long contraction phase is typical for unstable mixed H/He-burning (see Sect. 5.4) and not expected for unstable pure He-burning. Moreover, the distance derived at touch down is then rather high (d=15.2 kpc for =0, see Appendix B). Finally, increasing the hardening factor to Tbb/Teff,∞=2 also flattens the expected track (dotted line in Fig. 15). This may be the most realistic option, since spectral hardening values of 2 are inferred for burst luminosities near the Eddington limit (Babul & Paczyński 1987; but see Titarchuk 1994, where Tbb/Teff,∞1 at very large photospheric radii). We note that the effects of an expanded boundary layer, as discussed in Sect. 5.2.1, may also be of importance here. However, at present it is unclear how to take this into account.
3.2.6 Burst parameters
From X-ray spectral fits we can determine, for each burst, the maximum net bolometric black-body flux, Fbb,max, and the total burst fluence (i.e. the integrated net burst flux), Eb. These can be used to derive the burst parameters =Fpers/Fbb,max, where Fpers is the persistent flux flux between 2 and 20 keV (Table 3), and the average burst duration, =Eb/Fbb,max. Note that Fbb,max may be slightly underestimated due to the finite width of the time bins. The magnitude of this effect depends on how fast the flux varies with time. Eb has been determined by adding up the observed net burst fluxes, Fbb,net, per time bin from the beginning to the estimated end of the burst. Since Fbb,net decays exponentially it only vanishes finishes at infinite times. To compensate for this we fit the decay with an exponential and determine the ‘rest’ fluence by integrating from the estimated end of the burst up to infinity. The ‘rest’ fluence is large only for burst b2, which was interrupted during its decay (see Fig. 4). We also determined the burst parameter , which is the ratio of the average persistent flux to the time-averaged flux emitted in the bursts, =Fpers/(Eb/t), where t is the time since the previous burst. For we can only give lower limits, since the source is not observed during South Atlantic Anomaly passages and earth occultations. For burst b5 we have, however, also assumed that between bursts b4 and b5 no other bursts occurred (t=5.77 hr). Note that when we derive we assume that between bursts the persistent luminosity is constant. Since GX 17+2 is a highly variable source (see e.g. Fig. 1), this is not strictly valid. The burst parameters can be found in Table 4.
| burst | Fbb,maxa | Ebb | (s) | ||
| b1 | 1.590.06 | 5.380.07 | 3.390.14 | 1.30.2 | 700 |
| b2c | 1.330.01 | 356.40.7 | 2672 | 1.70.4 | 15 |
| b3 | 0.790.05 | 5.540.09 | 7.00.5 | 2.40.4 | 250 |
| b4 | 1.590.06 | 430.21.1 | 27111 | 1.20.2 | 10 |
| b5 | 1.460.07 | 5.260.07 | 3.600.17 | 1.60.2 | 100 |
| b5 | 90001300d | ||||
| b6 | 1.680.09 | 664.11.9 | 39622 | 1.50.1 | 1 |
| b7 | 1.360.08 | 143.31.0 | 1066 | 1.80.1 | 5 |
| b8 | 1.530.08 | 176.41.1 | 1156 | 1.60.3 | 25 |
| b9 | 1.500.08 | 137.61.0 | 925 | 1.60.3 | 25 |
| b10 | 1.650.08 | 169.00.9 | 1025 | 1.20.2 | 15 |
| a Bolometric peak net-burst black-body flux in 10-8 erg s-1 cm-2. | |||||
| b Burst fluence in 10-8 erg cm-2. | |||||
| c Using the 16 s spectral fit results. | |||||
| d Assuming that between burst b4 and b5 no other bursts occurred. | |||||
3.3 Burst position in the Z
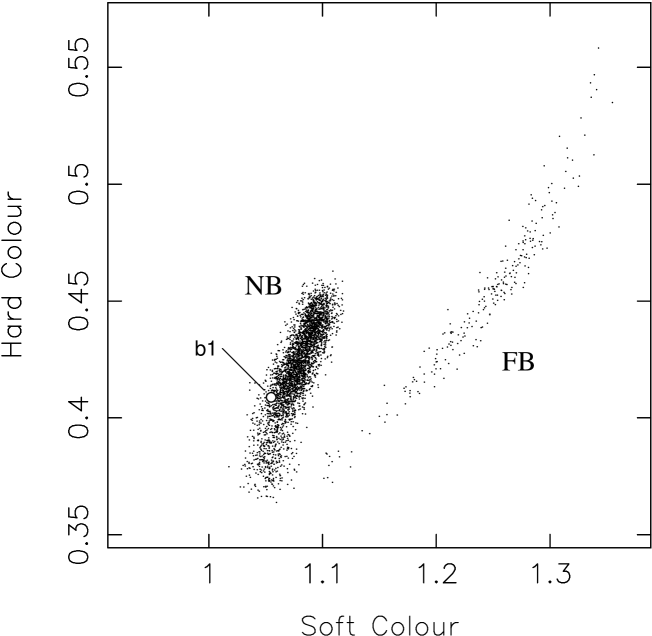
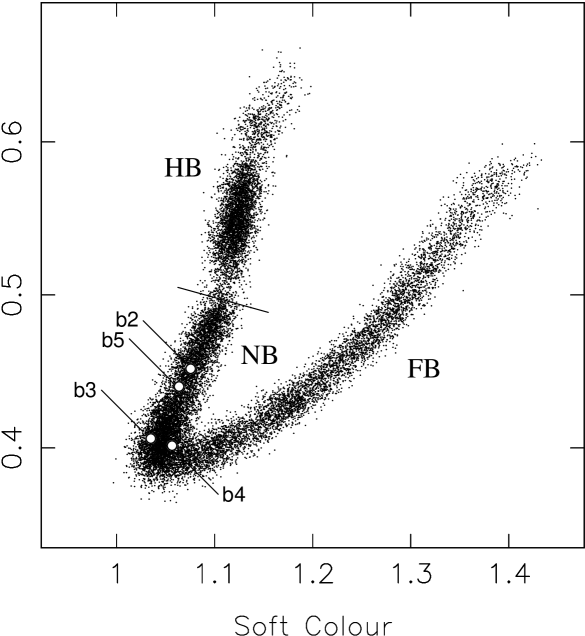
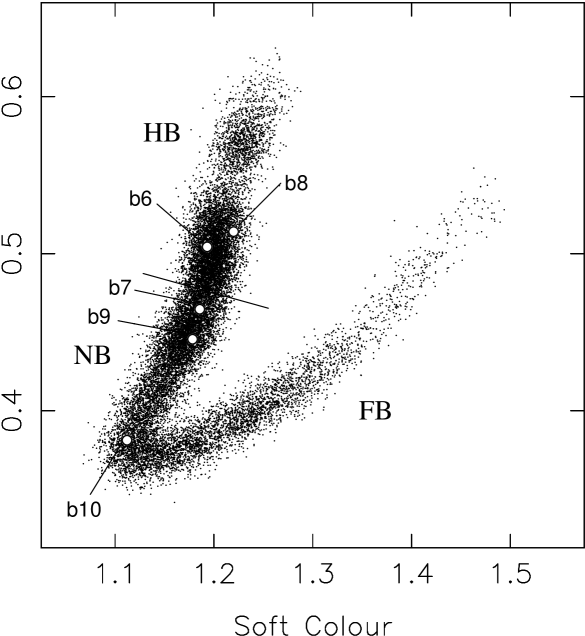
The colour-colour diagram (CD) of the data from the three different RXTE gain epochs is shown in Fig. 16, together with the source positions just before the burst (see also Table 2). To determine the position of the source in the CD at the time of the burst, we calculated the soft and hard colour values from 64 s intervals just before a burst. The three short bursts all occurred when the source was in the lower part of the NB. Among the long bursts, two occurred in the lower part of the HB, four in the NB, and one close to the NB/FB vertex. During the observations in 1996–2000 GX 17+2 spent about 28% of its time in the HB, 44% of its time in the NB, and 28% in the FB. It thus seems that the NB is overpopulated, whereas the FB is underpopulated with bursts (i.e. none occurred). However, by assuming that bursts have an equal chance to occur at each instant independent of branch, this result is statistically not significant (4% probability seeing 7 out of 10 bursts in the NB, and 7% of seeing none out of 10 bursts in the FB). Our conclusion does not change much if we include the EXOSAT/ME results reported by Kuulkers et al. (1997); for 260 ksec of observing time, GX 17+2 spent 11% of the time in the HB, 66% in the NB and 23% in the FB, with 3 bursts occurring in the NB and 1 in the (lower part of the) FB. This leads to total probabilities of 7% of seeing 10 out of 14 bursts in the NB, and 6% of seeing only 1 out of 14 bursts in the FB.
4 Search for burst oscillations
Following the method described by Leahy et al. (1983; see also Vaughan et al. 1994) we defined a 99% confidence level above which powers are regarded to be due to a real signal. This level depends on the number of trials, which basically is the number of independent frequency bins that are examined. In our search this number is 2107 which leads to a trigger level of 42.8 in the Leahy et al. (1983) normalization. This level was never reached, indicating that no coherent oscillations were detected in any of the bursts. We inspected the frequencies of the highest observed powers. These powers occurred at apparently random frequencies, consistent with the idea that they are due to random fluctuations.


Since no powers were found above the trigger level, only upper limits to the strength of possible burst oscillations can be given (see van der Klis 1989; Vaughan et al. 1994). We used the (maximum) observed powers to determine a 99% confidence upper limit to a true signal power. These upper limit powers were then converted into the full amplitude of an assumed sinusoidal signal333If a sinusoidal signal is given by , the full amplitude is defined as ., which is given by:
where is the (upper limit) signal power (Vaughan et al. 1994; Groth 1975), the number of photons used in the power spectrum, the frequency at which the power was found, and the Nyquist frequency. Table 5 gives the upper limits on for all bursts — each burst was divided into four parts: 5 s before the rise, the rise, the peak, and decay (= end of peak + 2texp). Note that is a factor larger than the rms amplitude that is often quoted.
The values of the upper limits are not very constraining. Only those obtained from the 2 s power spectra in the 2–60 keV band are well below the strongest values observed in some of the atoll sources (see e.g. Strohmayer 1998, 2001).
| burst | a | upper limits on fractional amplitudeb | burst | a | upper limits on fractional amplitudeb | ||||||
| 0.25 s | 2 s | 0.25 s | 2 s | 0.25 s | 2 s | 0.25 s | 2 s | ||||
| 2–60 keV | 2–60 keV | 8–20 keV | 8–20 keV | 2–60 keV | 2–60 keV | 8–20 keV | 8–20 keV | ||||
| b1c | b | 0.28 | 0.12 | 1.0 | 0.67 | b6 | b | 0.41 | 0.14 | 0.70 | 0.28 |
| r | 0.23 | 0.07 | 1.0 | 0.34 | r | 0.28 | 0.09 | 0.49 | 0.24 | ||
| p | 0.25 | 0.09 | 1.0 | 0.45 | p | 0.40 | 0.15 | 0.63 | 0.24 | ||
| d | 0.27 | 0.11 | 1.0 | 0.60 | d | 0.45 | 0.16 | 0.89 | 0.30 | ||
| b2 | b | 0.34 | 0.10 | 0.66 | 0.26 | b7 | b | 0.47 | 0.16 | 0.78 | 0.26 |
| r | 0.19 | 0.07 | 0.51 | 0.20 | r | 0.30 | 0.08 | 0.58 | 0.15 | ||
| p | 0.29 | 0.10 | 0.55 | 0.20 | p | 0.36 | 0.13 | 0.63 | 0.23 | ||
| d | 0.33 | 0.11 | 0.68 | 0.26 | d | 0.46 | 0.16 | 0.80 | 0.34 | ||
| b3 | b | 0.36 | 0.13 | 0.77 | 0.25 | b8 | b | 0.41 | 0.14 | 0.74 | 0.26 |
| r | 0.21 | 0.08 | 0.51 | 0.17 | r | 0.33 | 0.10 | 0.56 | 0.20 | ||
| p | 0.32 | 0.12 | 0.64 | 0.24 | p | 0.37 | 0.14 | 0.59 | 0.24 | ||
| d | 0.32 | 0.12 | 0.71 | 0.25 | d | 0.43 | 0.16 | 0.72 | 0.27 | ||
| b4 | b | 0.37 | 0.14 | 0.76 | 0.27 | b9 | b | 0.41 | 0.13 | 0.77 | 0.30 |
| r | 0.30 | 0.09 | 0.62 | 0.23 | r | 0.25 | 0.09 | 0.56 | 0.22 | ||
| p | 0.29 | 0.11 | 0.55 | 0.20 | p | 0.38 | 0.14 | 0.63 | 0.22 | ||
| d | 0.38 | 0.13 | 0.75 | 0.27 | d | 0.45 | 0.17 | 0.78 | 0.28 | ||
| b5 | b | 0.33 | 0.11 | 0.63 | 0.22 | b10 | b | 0.45 | 0.19 | 0.67 | 0.34 |
| r | 0.24 | 0.09 | 0.42 | 0.17 | r | 0.34 | 0.09 | 0.48 | 0.23 | ||
| p | 0.27 | 0.10 | 0.39 | 0.17 | p | 0.38 | 0.14 | 0.51 | 0.26 | ||
| d | 0.28 | 0.10 | 0.57 | 0.22 | d | 0.48 | 0.18 | 0.68 | 0.34 | ||
| a Phase of burst profile: b=before burst, r=rise, p=peak, d=decay. | |||||||||||
| b 99% confidence upper limits in the 50–2000 Hz frequency range. | |||||||||||
| c 99% confidence upper limits in the 2–60 keV energy band are between 50–250 Hz. The high-energy band used is 13.5–20 keV. | |||||||||||
5 Discussion
5.1 X-ray burst properties
Of the ten X-ray bursts from GX 17+2 seen so far with the RXTE/PCA, three are rather short (10 s), whereas the other seven have durations of 6–25 min. They all show evidence for cooling of the neutron star photosphere during the decay, confirming previous results. The burst durations found are in the range seen previously (Kahn & Grindlay 1984; Tawara et al. 1984c; Sztajno et al. 1986; Kuulkers et al. 1997). Using the time-resolved X-ray spectral fits (see Sect. 5.2) we determined the burst fluence, (a characterisation of the burst decay time), (the net brightness of the burst with respect to the persistent level) and (the ratio between the total net burst flux and total persistent flux in between bursts). Since not all these parameters were given for GX 17+2 bursts observed previously, we (re-)determined these values from the information given in the various papers. This is explained in Appendix A and the results are given in Table A.1. Again, our values for the burst parameters for both the short and long bursts are comparable to those for the bursts observed previously. Since observations with RXTE are interrupted by either SAA passages or Earth occultations, and the fact that the length of each ‘continuous’ observation was limited (hours) we could not determine the time interval between bursts. Our lower limits on are, therefore, rather low. However, from the bursts observed previously, it is found that always exceeds 1000. This means that most of the accreted material is being burned continuously. One of our short bursts occurred about 5.8 hr after a long burst. So far this is the shortest recurrence time encountered for a burst in GX 17+2. The fluences of the bursts from GX 17+2 are either 5.510-8 erg cm-2 (short bursts) or 140–67010-8 erg cm-2 (long bursts). At a distance of 10 kpc (but see Sect. 5.3) these correspond to total energies of 6.51038 erg and 2–81040 erg, respectively, in the range seen for type I bursts (see e.g. Lewin et al. 1993).
One of the short bursts was rather faint, with a peak intensity which was a factor of 1.25 lower than for the other bursts, and displayed two peaks in the light and bolometric flux curves. This burst resembles the (relatively) weak double-peaked bursts seen from 4U 163653 (Sztajno et al. 1985; Fujimoto et al. 1988). Such bursts are clearly not radius expansion/contraction events, but are instead thought to be due to the mixing of fresh material into the unstably burning layer; such mixing may be caused by shear instabilities in the outer envelope of the neutron star (Fujimoto et al. 1988).
We show for the first time that almost all of the long bursts of GX 17+2 have episodes of radius expansion and contraction of the neutron star photosphere. In all cases the expansion and initial contraction occur during the first few seconds of the bursts, but the final contraction phase duration varies between 20 s and 180 s. During the expansion/contraction phase the net burst flux remains constant, presumably at the Eddington value. Long contraction phases might be caused by long phases of unstable hydrogen burning, whose time scale is limited by -decays, up to 100 s after the burst has started (see e.g. Bildsten 1998, 2000, and references therein). The maximum apparent radius at 10 kpc, Rbb,10, reached during the expansion episodes is 30 km. Corrected for gravitational redshift effects and spectral hardening (see Appendix B), the maximum photospheric radius R (as measured by a local observer) is 90–125 km. We do not see evidence for a change in the cut-off power-law component above 10 keV when the photosphere expands up to these radii. This suggests that either the environment in between the neutron star surface and expanded photosphere at 90–125 km is involved in producing the high-energy radiation but was not affected, or the inner disk and corona which presumably produce the high-energy radiation do not extend down to the neutron star. A possibility is that the magnetospheric radius extends out to at least these radii, disrupting the disk and corona near that point. Note that the radius range of 90–125 km overlaps with the range of magnetospheric radii expected for Z sources (10–100 km, see Ghosh & Lamb 1992). However, at the high mass accretion rates inferred for GX 17+2 the disk is expected to extend down to close to the neutron star (see Popham & Sunyaev 2001). For a more detailed discussion of the different emission regions we refer to the next subsection.
Long (minutes) X-ray bursts have been seen in many other sources (see, in order of decreasing duration, Hoffman et al. 1978b, Lewin et al. 1984, 25 min: 4U 170823; Swank et al. 1977, 10 min: 4U 1724307; Tawara et al. 1984a,b, 4.5 min: 3A 1715321; Kaptein et al. 2000, 3.3 min: 1RXS J171824.2402934; van Paradijs et al. 1990, 2.7 min: 4U 2129+11). The shapes of the light curves of these bursts at different energies are very similar to the long bursts of GX 17+2, i.e. fast (several seconds) rise and peaked emission at low energies and relatively slower rise at high energies. They also have rather long episodes of contraction, i.e. long episodes of Eddington fluxes, up to 300 s (see e.g. Lewin et al. 1984). Moreover, the curves for Tbb and Rbb as a function of time show similar shapes.
The difference, however, between the long bursts of GX 17+2 and those in the other sources is that ‘precursors’ are present in the light curves before almost all of the long bursts from other sources. Note that these are not real precursors, but indicate very large radius expansion (Rbb100 km). No emission is then seen because of the very low effective temperatures reached; the peak of the emission is shifted to UV wavelengths. Thus the X-ray burst light curve is interrupted by a gap of no X-ray emission leading to an apparent precursor (see Lewin et al. 1984). The rise to maximum radius in those sources is on the order of several seconds. In GX 17+2 the maximum value of Rbb is a few times the neutron star radius and the expansion lasts typically only a second. The most important difference, however, is that the persistent emission just before the long bursts in other sources is 1% of the Eddington value, i.e. a factor of 100 lower than in GX 17+2 (see also Sect. 5.4).
We note that even longer X-ray bursts do exist, which last for several hours (Cornelisse et al. 2000, 2001; Wijnands 2001; Strohmayer & Brown 2001; Kuulkers 2001; Kuulkers et al. 2001). Their recurrence time is much longer than normal type I bursts (7.5 days, Cornelisse et al. 2001; 4.8 yrs, Wijnands 2001), and they seem to occur at persistent luminosites which are a factor of 0.1–0.2 of the Eddington limit.
5.2 Black-body spectral fits
5.2.1 Decoupled persistent and burst emission
It has previously been pointed out (van Paradijs & Lewin 1986; see also Sztajno et al. 1986) that, if the persistent emission before the burst contains a spectral component which originates from the same regions as the burst emission, this should be taken into account in the spectral analysis of X-ray bursts. This is especially the case when the neutron star is accreting matter at high rates such as thought to be the case in Z sources, making the neutron star hot and radiate soft (black-body like) emission. ‘Standard’ X-ray burst spectral analyses (modeling the net-burst emission by black-body radiation) then results in systematic errors in the spectral parameters, especially during the end of the burst when the net-burst luminosity is small. It was therefore suggested to model the total burst emission using a two-component approach, i.e. with a soft component (usually a black body) and a hard component (fixed at the parameters found for the persistent emission). The former component is thought to contain all emission from the neutron star photosphere, while the latter component is assumed to be from the accretion disk and not affected by the prompt burst. However, we find that using this two-component spectral fitting approach does not give satisfactory results. Instead, the ‘standard’ burst analysis, which assumes the persistent emission continues unchanged, yield better fits.
This suggests that the persistent emission is unaffected during the burst and that the persistent black-body component (which is not always present) does not arise from the same region as the burst emission, contrary to what was previously assumed. We find that during the initial exponential decay phase of the bursts the neutron star photosphere shows pure black-body cooling. During that stage the apparent black-body radius stays constant at 5–6 km (at 10 kpc). Comparing these radii with the apparent radii of the black-body component of the persistent emission (if present) indicates that the persistent black-body component originates from a larger area than that of the burst emission (see Fig. 8). The inner part of the accretion disk or an expanded boundary layer are the most obvious sites for this persistent soft component. A recent study of X-ray spectra from LMXBs with luminosities spanning several orders of magnitude has shown that the persistent black-body emission likely does not arise in (part of) the accretion disk (Church & Bałucińska-Church 2001). Instead at very high accretion rates (near Eddington values) the accretion disk boundary layer around the neutron star expands radially, with radial extents larger than one stellar radius (Popham & Sunyaev 2001). Moreover, at these high rates the expected spectrum of the boundary layer strongly resembles a black-body. The fact that we see black-body emission in the persistent spectra with apparent radii which are larger (factor 2–3) than the neutron star (see also Church & Bałucińska-Church 2001) is in line with this. Still, one would expect that such a boundary layer would be affected by the bursts (see Popham & Sunyaev 2001), of which we do not see clear evidence from our spectral fits. We note, however, that Homan et al. (2001), who studied the properties of the NB and FB quasi-periodic oscillations (NB/FB QPO or NBO/FBO) during bursts b4 and b10, found that during the bursts the absolute amplitude of these QPOs decreased significantly. This suggests that the inner accretion flow is affected by the increase in the radiation from the neutron star, contrary to what our spectral results indicate. Apparently the QPO mechanism of the NBO/FBO is much more sensitive to the radiation field than the bulk flow of matter itself. This is in accordance with models for NBO/FBO (Fortner et al. 1989), which require a delicate balance between the radiation field and the accretion flow, that might easily be disrupted during X-ray bursts.
5.2.2 Deviations from black-body emission
During the radius expansion/contraction phase black-body emission does not provide a good description of our observed net-burst spectra, leaving a slight excess in emission between 5.5–10 keV and lack of emission between 3–5.5 keV (Fig. 11). Such systematic deviations have been observed before, especially during radius expansion/contraction phases. For example, spectra obtained with the Large Area Counter onboard Ginga during the long burst of 4U 2129+11 (van Paradijs et al. 1990) show remarkably similar deviations at the same energies as we see in GX 17+2. The persistent mass accretion in 4U 2129+11 is inferred to be a factor of 100 lower than for GX 17+2. This suggests that the radiation properties of the photospheres are the same when they are radiating near the Eddington luminosity, which is independent of the mass accretion rate. As noted by van Paradijs et al. (1990), the ‘bumpiness’ of the residuals point to the presence of relatively narrow-band spectral features, rather than the residuals being due to broad-band spectral hardening at Eddington luminosities (see also Strohmayer & Brown 2001).
From our ‘standard’ spectral analysis, we find that the apparent black-body radii decrease near the end of the decay of the bursts. This was also inferred from the EXOSAT/ME observations of GX 17+2 (Sztajno et al. 1986), and has been seen in other sources as well (e.g. Chevalier & Ilovaisky 1990). If this were due to a real decrease in the burst emitting area one might expect to see burst oscillations due to the spinning neutron star. We do not see evidence for this. If the expanded boundary layer reacts to its changing environment on the same time scale as the burst itself then variations in this layer’s structure could also play a role here.
This observed behaviour resembles the systematic effects described by van Paradijs & Lewin (1986), which occurs near the end of the bursts in the presence of a persistent hot neutron star component. However, we have argued that the persistent black body component does not contribute to the burst emission, so this is not a viable explanation. Sztajno et al. (1986) argued that this effect also can not be due to spectral hardening, since that would lead to an apparent radius increase with decreasing Tbb. Their argument was based on the assumption that the spectral hardening decreases with decreasing temperatures (and therefore decreasing burst luminosity; see also Sztajno et al. 1985). However, later model calculations have shown that in fact spectral hardening increases again whenever the burst luminosity drops below a certain value (Lbb0.2LEdd, e.g. London et al. 1986, Ebisuzaki 1987). For an assumed constant size of the emission region during the cooling stage (presumably the whole neutron star surface), the apparent radii will then become smaller as Tbb decreases, consistent with what is observed.
5.3 The distance to GX 17+2 and the persistent emission
Assuming that during the expansion and contraction phase the net-burst luminosity equals the Eddington luminosity we can estimate the distance to GX 17+2. As noted before (Lewin et al. 1993; see also recent discussion by Kuulkers & van der Klis 2000), this is not without problems. Assuming (see Appendix B) a neutron star with a canonical mass of 1.4 M☉, using the electron scattering opacity, , for cosmic composition in the low-temperature limit, we obtain L erg s-1. For the observed values of Fbol1.2–1.310-8 erg s-1 cm-2 this leads to distances of d11.4–11.9 kpc (assuming isotropic radiation and no spectral hardening, i.e. Teff,∞=Tbb). Close to the neutron star, however, one still has to take into account gravitational redshift effects. We therefore estimated the distance by solving the relevant equations, for the explanation of which we refer the reader to Appendix B. Correcting for gravitational redshift effects, taking the same ‘standard’ parameters as above, using values of appropriate for very high temperatures, and correcting for spectral hardening (Tbb/Teff,∞=1.7) we found distances between 10.8–12.0 kpc, with an average of d11.3 kpc (again see Appendix B for details). If the burst emission is highly anisotropic (2) we derive d8 kpc, see below. We note that these estimates have systematic uncertainties of the order of 30% or so (see Lewin et al. 1993; see also Kuulkers & van der Klis 2000, and Appendix B). At touch down the radius of the photosphere, R, presumably equals the radius of the neutron star surface. We find values of R12–20 km, where the range arises from the different assumptions in deriving these radii (Appendix B).
One can also use the radius expansion events to estimate the persistent luminosity in Eddington units, without the need of knowing the distance to the source, mass of the neutron star, etc. However, for the long bursts we find that the total emission before/after the burst is a up to factor of 2 larger than the net-burst emission during expansion/contraction phase. If indeed the maximum net-burst flux equals the Eddington flux, this implies that the persistent flux is up to 2 times the Eddington flux. From the models characterising the behaviour of Z sources it is inferred that on the HB, NB and FB, the mass accretion rates (and therefore luminosity) are just below, at or just above Eddington values, respectively (e.g. Hasinger 1987; Lamb 1989; Hasinger et al. 1990). The only way out is that the net burst emission is (highly) anisotropic compared to the persistent emission. Since the true luminosity values should be more or less comparable, one thus infers an anisotropy factor of 2 for the net burst emission. This cannot be ascribed to localized emission on the neutron star (see also Section 5.4), but might be due to part of the burst emission being hidden behind a puffed-up inner accretion disk. In the case of highly anisotropic burst emission (2) the distance estimate to GX 17+2 is reduced to 8 kpc (see Appendix B). This estimate is comparable to that derived for other similar X-ray sources (e.g. Christian & Swank 1997; Schulz 1999). We note that anisotropic burst emission may also explain the apparent inconsistency in the distance to Cyg X-2 from a radius expansion burst, i.e. 11.6 kpc (Smale 1998; for a 1.9 M☉ neutron star, peak photospheric radius of 26 km, cosmic abundances, low temperature opacity, no spectral hardening; see also Appendix B), and that derived from optical measurements, i.e. 7.2 kpc (Orosz & Kuulkers 1999). However, for Cyg X-2 the persistent flux before the burst was of the same order as the net peak burst flux.
5.4 X-ray bursts and (extreme) mass accretion rates
We found no significant correlation between the burst parameters and the position of the source in the Z-track at the time of the bursts, i.e. both long and short bursts may occur at similar mass accretion rates. We find that no X-ray bursts occurred when the source was on the FB, despite considerable coverage compared to the other branches of the Z. However, this result is not sufficiently significant to exclude the possibility that bursts occur on the FB as frequently as elsewhere. We do note that the absence of bursts on the FB is consistent with theoretical expectations (see Sect. 1; e.g. Bildsten 1998, 2000), as the mass accretion rate on the FB is thought to be super-Eddington (e.g. Hasinger 1987; Lamb 1989; Hasinger et al. 1990).
At near-Eddington accretion rates, long bursts are expected from X-ray burst theory (see Sect. 1; see also van Paradijs et al. 1988). These are thought to be due to mixed H/He burning, triggered by thermally unstable He ignition. The fast rise and the short radius expansion part of the long bursts resemble pure helium flashes which last on the order of 5–10 s, although in the case of GX 17+2 the recurrence times of these bursts are on the order of a day instead of the expected hours for typical pure helium flashes. This flash triggers the long phase of unstable mixed H/He burning. Our analysis provides the first example of the existence of such long bursts at high (near-Eddington) accretion rates. However, GX 17+2 also displays short (10 s) bursts, which are not expected at high accretion rates. Similarly, Cyg X-2, also accreting at near-Eddington values, displays rather short bursts (5 s). Such short bursts (presumably He flashes) are only expected for accretion rates which are a factor of 20–100 lower.
Since it is not the global mass accretion rate that matters, but the mass accretion rate per unit area (e.g. Marshall 1982; see also Bildsten 2000), it might be that at different times the area which accumulates most of the accreted matter differs, giving rise to short and long bursts. However, if the areas are relatively small, pulsations are expected due to the neutron star rotation (unless the accreted matter is distributed symmetrically along the rotation axis, such as in an equatorial belt). We do not see any evidence for this.
The properties of X-ray bursts depend not only on the mass accretion rate (per unit area), but also on the temperature of the neutron star envelope and composition of the accreted material (e.g. Fushiki & Lamb 1987; Taam et al. 1996; see also Bildsten 1998, 2000; Lamb 2000). At high accretion rates and high envelope temperatures the combined He flash and mixed H/He burning occurs; however at high accretion rates and low envelope temperatures only He flashes may occur (see Lamb 2000). The difference in envelope temperature at different times may indeed explain the occurrence of the two types of bursts, and it would be worthwhile to explore this further. It is not clear, however, how such different envelope temperatures could be reached at very similar accretion rates. The composition of the accreted material is not expected to change much, since fresh matter arrives at high rates.
The situation at high mass accretion rates becomes even more confusing when one considers the bright ‘GX atoll’ sources (GX 3+1, GX 13+1, GX 9+1, GX 9+9) as well as the other Z sources (Sco X-1, GX 51, GX 340+0, GX 349+2, Cyg X-2). The former are thought to accrete with rates around 10% of the Eddington mass accretion rate (Psaltis & Lamb 1998; see also Kuulkers & van der Klis 2000). For those sources, only short (10–15 s duration) bursts are seen (infrequently) in GX 3+1 (Makishima et al. 1983; Asai et al. 1993; Molkov et al. 1999; Kuulkers & van der Klis 2000) and GX 13+1 (Matsuba et al. 1995) and no bursts have been reported for GX 9+1 and GX 9+9, despite ample observing times.
The X-ray spectral and fast timing properties of the other five canonical Z sources are very similar to those of GX 17+2 (see Hasinger & van der Klis 1989; van der Klis 2000), and thus one would infer comparable mass accretion rates. Of the five of these sources, however, only Cyg X-2 shows X-ray bursts, which are typical He flashes, whereas the others do not burst at all (despite ample observing times). Since at very high accretion rates no bursts are expected one would then naively infer that the average mass accretion rate is different, i.e. higher, in the four non-bursting Z sources with respect to the two bursting Z sources. But this would imply that the correlated X-ray spectral and fast timing properties are not a function of the inferred mass accretion rate; van der Klis (2001) has recently proposed a way in which the correlated properties could vary in response to changes in the mass accretion rate without being a function of it. A slightly different suggestion was made by Homan et al. (2001) who propose that the mass accretion rate is not the parameter that determines the position along the Z track. As a consequense, bursts that occur at a similar position along the Z might occur at different mass accretion rates and therefore have different proporties. Note also that differences in mass accretion rate per unit area may be of importance here, as was already suggested by Kuulkers et al. (1997) to explain the properties of quasi-periodic oscillations occurring on the HB and upper parts of the NB, and the presence of bursts in GX 17+2. On the other hand, since the envelope temperatures and composition also influence the bursting properties, they may be of importance too (e.g. Taam et al. 1996). Future modelling may provide more insight in the processes involved.
6 Conclusions
We found ten X-ray bursts in all data on GX 17+2 obtained with the RXTE/PCA to date. Three of them were short (10 s), while the others lasted from 6 to 25 min. All the bursts showed spectral softening during the decay, indicative of cooling of the neutron star. No evidence for high-frequency (100 Hz) oscillations at any phase of the bursts is seen. We find no evidence for correlations of the burst properties with respect to the source position in the colour-colour diagram (presumably a function of the mass accretion rate). The long bursts are consistent with being due to mixed H/He burning, triggered by thermally unstable He ignition, as expected at the inferred near-Eddington mass accretion rates in GX 17+2. However, the presence of short bursts in GX 17+2, as well as short bursts in Cyg X-2, another persistently bright LMXB, and no bursts in the other four similar LMXBs Sco X-1, GX 51, GX 340+0 and GX 349+2, is not accounted for in the current X-ray burst theories. Note that this also holds for the bright ‘GX atoll’ sources GX 3+1, GX 13+1, GX 9+1 and GX 9+9, which are thought to accrete near one tenth of the Eddington rate. Of these four atoll sources, only GX 3+1 and GX 13+1 infrequently show short (10–15 s) X-ray bursts, whereas GX 9+1 and GX 9+9 have not been seen to burst at all.
We found that two-component spectral fits to the total burst emission, as has been suggested previously, do not give satisfactory results whenever the persistent emission before the burst contains a black-body component. On the other hand, the ‘standard’ spectral fit analysis, in which the burst emission is modeled by black-body radiation after subtraction of the persistent emission before the burst, does provide satisfactory results. This means that whenever there is a black-body contribution in the persistent emission before the burst, it is probably also present during the burst itself (i.e. the burst black-body emission appears on top of the persistent black-body emission). This implies that the burst emission does not arise at the same site as the black-body component often seen in the persistent emission. We find evidence that the emission region of the persistent black-body component is larger than that of the burst emission, which indicates that it probably originates in an expanded boundary layer, as recent modeling indicates.
Five of the long bursts showed evidence for an expanding photosphere during the first seconds of the burst, presumably due to the burst luminosity reaching the Eddington limit. The contraction phase differs in duration between the bursts, the longest being 3 min. The net burst fluxes reached during the radius expansion/contraction phase are all more or less similar, which is indicative of the Eddington limit as observed at earth.
The persistent flux just before the burst is inferred to be up to a factor 2 higher than the net burst flux during the radius expansion/contraction phase. If in both cases the emission is isotropic, this implies that the persistent emission is up to a factor of 2 higher than the Eddington luminosity. We suggest that the burst emission is (highly) anisotropic. Since both the persistent luminosity in GX 17+2 and the net burst luminosity during the expansion/contraction phase are thought to have near Eddington values, we then derive an anisotropy factor of 2 for the burst emission.
When the burst luminosity is near Eddington values, deviations from pure black-body radiation are evident below 10 keV. Similar deviations have been seen during (long) X-ray bursts in other low-mass X-ray binaries, and can not be explained by spectral hardening. Assuming that the black-body approximation is, nevertheless valid, that the net burst peak fluxes during the radius expansion/contraction phase equals the Eddington limit as seen on Earth, and using an anisotropy factor of 2, we estimate the distance to GX 17+2, taking into account gravitational redshift effects and spectral hardening. For ‘standard’ parameters (=1.4 M☉, cosmic composition) we derive a distance 8 kpc, with a systematic uncertainty of up to 30%.
Acknowledgements.
We thank Lars Bildsten, Jean in ’t Zand and Marten van Kerkwijk for providing comments on earlier drafts of this paper, Keith Jahoda for providing up-to-date response matrices, and the referee for carefully reading the manuscript. EK thanks the MIT/RXTE X-ray burst group for making us aware of the burst-like event f1, which resulted in our detection of the events f2–f4. This work was supported in part by the Netherlands Organization for Scientific Research (NWO). WHGL is grateful for support from NASA.References
- (1) Asai, K., Dotani, T., Nagase, F., Mitsuda, K., Kitamoto, S., Makishima, K., Takeshima, T., Kawabata, K. 1993, PASJ, 45, 801
- (2) Babul, A., Paczyński, B. 1987, ApJ, 323, 582
- (3) Bildsten, L. 1998, in: The Many Faces of Neutron Stars, R. Buccheri, J. van Paradijs, M.A. Alpar (eds.), Dordrecht: Kluwer, p. 419
- (4) Bildsten, L. 2000, in: Cosmic Explosions, S.S. Holt, W.W. Zhang (eds.), AIP, 522, p. 359
- (5) Bradt, H.V., Rothschild, R.E., Swank, J.H. 1993, A&AS, 97, 355
- (6) Chevalier, C., Ilovaisky, S.A. 1990, A&A, 228, 115
- (7) Christian, D., Swank, J.H. 1997, ApJS, 197, 177
- (8) Church, M.J., Bałucińska-Church, M. 2001, A&A, 369, 915
- (9) Cornelisse, R., Heise, J., Kuulkers, E., Verbunt, F., in ’t Zand, J.J.M. 2000, A&A, 357, L21
- (10) Cornelisse, R., Kuulkers, E., in ’t Zand, J.J.M., Verbunt, F., Heise, J. 2001, A&A, submitted
- (11) Di Salvo, T., Stella, L., Robba, N.R., et al. 2000, ApJ, 544, L119
- (12) Ebisuzaki, T., 1987, PASJ, 39, 287
- (13) Fortner, B., Lamb, F.K., Miller, G.S. 1989, Nat, 342, 775
- (14) Fujimoto, M.Y., Hanawa, T., Miyaji, S. 1981, ApJ, 247, 267
- (15) Fujimoto, M.Y., Sztajno, M., Lewin, W.H.G., van Paradijs, J. 1988, A&A, 199, L9
- (16) Fushiki, I., Lamb, D.Q. 1987, ApJ, 323, L55
- (17) Ghosh, P., Lamb, F.K. 1992, in: Proc. NATO Conf. on X-ray Binaries and Reycled Pulsars, E.P.J. van den Heuvel, S.A. Rappaport (eds.), Kluwer, Dordrecht, p. 487
- (18) Grindlay, J., Heise, J. 1975, IAUC 2879
- (19) Grindlay, J., Gursky, H., Schnopper, H., Parsignault, D.R., Heise, J., Brinkman, A.C., Schrijver, J. 1975, ApJ, 205, L127
- (20) Groth, E.J. 1975, ApJS, 29, 285
- (21) Hasinger, G. 1987, A&A, 186, 153
- (22) Hasinger, G., van der Klis, M. 1989, A&A, 225, 79
- (23) Hasinger, G., van der Klis, M., Ebisawa, K., Dotani, T., Mitsuda, K. 1990, A&A, 235, 131
- (24) Hoffman, J.A., Lewin, W.H.G., Doty, J., Jernigan, J.G., Haney, M., Richardson, J.A. 1978b, ApJ, 221, L57
- (25) Hoffman, J.A., Marshall, H.L., Lewin, W.H.G. 1978a, Nat, 271, 630
- (26) Homan, J., van der Klis, M., Jonker, P.G., Wijnands, R., Kuulkers, E., Méndez, M., Lewin, W.H.G. 2001, ApJ, in press [astro-ph/0104323]
- (27) Kahn, S.M., Grindlay, J.E. 1984, ApJ, 281, 826
- (28) Kahn, S., Grindlay, J., Halpern, J., Ladd, E. 1981, IAU Circ. 3625
- (29) Kaptein, R.G., in ’t Zand, J.J.M., Kuulkers, E., Verbunt, F., Heise, J., Cornelisse, R. 2000, A&A, 358, L71
- (30) Koshut, T.M., Paciesas, W.S., Kouveliotou, C., van Paradijs, J., Pendleton, G.N., Fishman, G.J., Meegan, C.A. 1996, ApJ, 463, 570
- (31) Kuulkers, E. 1995, PhD thesis, University of Amsterdam
- (32) Kuulkers, E. 2001, ATel #68
- (33) Kuulkers, E., van der Klis, M. 2000, A&A, 356, L45
- (34) Kuulkers, E., van der Klis, M., van Paradijs, J. 1995, ApJ, 450, 748
- (35) Kuulkers, E., van der Klis, M., Oosterbroek, T., van Paradijs, J., Lewin, W.H.G. 1997, MNRAS 287, 495
- (36) Kuulkers, E., in ’t Zand, J.J.M., van Kerkwijk, M.H., et al. 2001, A&A, submitted
- (37) Lamb, D.Q. 2000, ApJS, 127, 395
- (38) Lamb, F.K. 1989, in: Two Topics in X-ray Astronomy, 23rd ESLAB Symposium, J. Hunt, B. Battrick (eds.), ESA SP-296, p. 215
- (39) Lamb, F.K., Miller, M.C. 2001, ApJ, 554, 1210
- (40) Leahy, D.A., Darbro, W., Elsner, R.F., Weisskopf, M.C., Kahn, S., Sutherland, P.G., Grindlay, J.E. 1983, ApJ, 266, 160
- (41) Lewin, W.H.G., Vacca, W.D., Basinska, E.M. 1984, ApJ, 277, L57
- (42) Lewin, W.H.G., van Paradijs, J., Taam, R.E. 1993, Space Sci. Rev., 62, 223
- (43) London, R.A., Taam, R.E., Howard, W.M. 1984, ApJ, 287, L27
- (44) London, R.A., Taam, R.E., Howard, W.M. 1986, ApJ, 306, 170
- (45) Madej, J. 1997, A&A, 320, 177
- (46) Makishima, K., Mitsuda, K., Inoue, H., et al. 1983, ApJ, 267, 310
- (47) Maraschi, L., Cavaliere, A. 1977, HiA, 4, 127
- (48) Marshall, H.L. 1982, ApJ, 260, 815
- (49) Matsuba, E., Dotani, T., Mitsuda, K., Asai, K., Lewin, W.H.G., van Paradijs, J., van der Klis, M. 1995, PASJ, 47, 575
- (50) Molkov, S.V., Grebenev, S.A., Pavlinsky, M.N., Sunyaev, R.A. 1999, in Proc. of the 3rd INTEGRAL Workshop “The Extreme Universe”, ApLC, 38, 141
- (51) Muno, M.P., Fox, D.W., Morgan, E.H., Bildsten, L. 2000, ApJ, 542, 1016
- (52) Orosz, J.A., Kuulkers, E. 1999, MNRAS, 305, 132
- (53) Paczyński, B., 1983, ApJ, 267, 315
- (54) Penninx, W., Damen, E., van Paradijs, J., Tan, J., Lewin, W.H.G., 1989, A&A, 208, 146
- (55) Popham, R., Sunyaev, R. 2001, ApJ, 547, 355
- (56) Psaltis, D., Lamb, F.K., 1998, in Neutron Stars and Pulsars, N. Shibazaki, N. Kawai, S. Shibata & T. Kifune (eds.), Tokyo, Universal Academy, p. 179
- (57) Schatz, H., Bildsten, L., Cumming, A., Wiescher, M. 1999, ApJ, 524, 1014
- (58) Schulz, N.S. 1999, ApJ, 511, 304
- (59) Smale, A. 1998, ApJ, 498, L141
- (60) Smale, A.P. 2001, ApJ, in press [astro-ph/0107354]
- (61) Stella, L. 2001, in Proceedings “X-ray Astronomy ’99 - Stellar Endpoints, AGN and the Diffuse Background”, G. Malaguti, G. Palumbo & N. White (eds), AIP Series of Conference Proceedings, in press [astro-ph/0011395]
- (62) Stella, L., Vietri, M., Morsink, M. 1999, ApJ, 524, L63
- (63) Strohmayer, T. 1998, Nucl. Phys. B. (Proc. Suppl.) 69/1-3, 129
- (64) Strohmayer, T. 2001, in Proceedings “X-ray Astronomy ’999 - Stellar Endpoints, AGN and the Diffuse Background”, G. Malaguti, G. Palumbo & N. White (eds), AIP Series of Conference Proceedings, in press [astro-ph/9911338]
- (65) Strohmayer, T.E., Brown, E.F. 2001, ApJ, submitted [astro-ph/0108420]
- (66) Sugimoto, T., Ebisuzaki, T., Hanawa, T. 1984, PASJ, 36, 839
- (67) Swank, J.H., Becker, R.H., Boldt, E.A., Holt, S.S., Pravdo, S.H., Serlemitsos, P.J. 1977, ApJ, 212, L73
- (68) Sztajno, M., van Paradijs, J., Lewin, W.H.G., Trümper, J., Stollman, G., Pietsch, W., van der Klis, M. 1985, ApJ, 299, 487
- (69) Sztajno, M., van Paradijs, J., Lewin, W.H.G., Langmeier, A., Trümper, J., Pietsch, W. 1986, MNRAS, 222, 499
- (70) Taam, R.E., Woosley, S.E., Lamb, D.Q. 1996, ApJ, 459, 271
- (71) Tawara, Y., Hayakawa, S., Kii, T. 1984b, PASJ, 36, 845
- (72) Tawara, Y., Kii, T., Hayakawa, S., et al. 1984a, ApJ, 276, L41
- (73) Tawara, Y., Hirano, T., Kii, T., Matsuoka, M., Murakami, T. 1984c, PASJ, 36, 861
- (74) Titarchuk, L.G. 1988, Soviet Astron. Lett., 14, 229
- (75) Titarchuk, L. 1994, ApJ, 429, 340
- (76) Thorsett, S.E., Chakrabarty, D. 1999, ApJ, 512, 288
- (77) Vaughan, B.A., van der Klis, M., Wood, K.S., et al. 1994, ApJ, 435, 362
- (78) van der Klis, M. 1989, in: Timing Neutron Stars, H. Ögelman, E.P.J. van den Heuvel (eds.), Kluwer Academic Publishers, p. 27
- (79) van der Klis, M. 2000, ARA&A, 38, 717
- (80) van der Klis, M. 2001, ApJ, submitted
- (81) van Paradijs, J. 1982, A&A, 107, 51
- (82) van Paradijs, J., Dotani, T., Tanaka, Y., Tsuru, T. 1990, PASJ, 42, 633
- (83) van Paradijs, J., Lewin, W.H.G. 1986, A&A, 157, L10
- (84) van Paradijs, J., Lewin, W.H.G. 1987, A&A, 172, L20
- (85) van Paradijs, J., Penninx, W., Lewin, W.H.G. 1988, MNRAS, 233, 437
- (86) van Straaten, S., van der Klis, M., Kuulkers, E., Méndez, M. 2001, ApJ, 551, 907
- (87) White, N.E., Peacock, A., Hasinger, G., Mason, K.O., Manzo, G., Taylor, B.G., Branduardi-Raymont, G.A. 1986, MNRAS, 218, 129
- (88) Wijnands, R. 2001, ApJ, 554, L59
- (89) Wijnands, R.A.D., van der Klis, M., Kuulkers, E., Asai, K., Hasinger, G. 1997, A&A, 323, 399
- (90) Woosley, S.E., Taam, R.E. 1976, Nat, 263, 101
Appendix A X-ray bursts from GX 17+2 observed with other instruments
X-ray bursts from GX 17+2 have been previously seen with the Monitor Proportional Counter (MPC) onboard the Einstein Observatory (Kahn & Grindlay 1984), the second Fine Modulation Collimator (FMC-2) onboard Hakucho (Tawara et al. 1984c) and the Medium Energy (ME) experiment onboard EXOSAT (Sztajno et al. 1986; Kuulkers et al. 1997). Not all the bursts parameters as tabulated in Table 4 for the bursts seen with the RXTE/PCA have been given by these authors. In order to compare our bursts in more detail with the other observed bursts we calculated these parameters from the information given in those papers. Since the X-ray energy ranges in which the different instruments operate are comparable, and most of the (burst) emission is radiated in these energy bands, such a comparison is feasible. In the next subsections we describe how the parameters were determined for the different bursts.
| burst | Fpersa | Fbb,maxb | Ebc | (s) | ||
| Kahn & Grindlay (1984) | ||||||
| 1.560.02 | see text | see text | 6.71.4 | 3.40.2 | 1750 | |
| Tawara et al. (1984c) | ||||||
| A | 2.8 | 1.5 | 346 | 36743 | 1.830.19 | 1000 |
| B | 2.8 | 2.0 | 94 | 758 | 1.380.13 | 1300 |
| C | 2.9 | 1.7 | 114 | 10937 | 1.770.20 | 1000 |
| D | 2.9 | 2.1 | 406 | 30927 | 1.410.11 | 1000 |
| Sztajno et al. (1986) | ||||||
| I | 1.510.13 | 1.10.4 | 4.71.0 | 6.271.2 | 3.60.2 | 1450 |
| II | 1.860.15 | 0.990.05 | 1143 | 1324 | 2.130.02 | 650 |
| Kuulkers et al. (1997) | ||||||
| III | – | – | – | 27 | 2.7 | 7000 |
| IV | – | – | – | 100 | 3.2 | 2200 |
| a Unabsorbed persistent flux in 10-8 erg s-1 cm-2, see also text. | ||||||
| b Peak net black-body flux in 10-8 erg s-1 cm-2. | ||||||
| c Burst fluence in 10-8 erg cm-2. | ||||||
A.1 MPC/Einstein
Kahn & Grindlay (1984, see also Kahn et al. 1981) observed a burst from GX 17+2 in 1980 with the MPC onboard Einstein, with a decay time of 7.5 s. From their background subtracted count rate profiles in the 1.4–14.4 keV energy band (their figure 1) we determined the values for and . The value of is consistent with what is inferred using the quoted net peak and persistent count rate of 0.15 and 0.56 Crab (2–6 keV), respectively, by Kahn et al. (1981). The persistent flux before the burst was given as 1.560.0210-8 erg cm-2 s-1 (1–20 keV). Kahn & Grindlay (1984) report a maximum peak flux of 9.110-8 erg cm-2 s-1 (1–20 keV). No error is given, but only a -sign. It is not clear whether this is a typo, or if this means that the value was approximate. Their peak flux is much higher than observed for the other bursts. An averaged net spectrum over the burst profile (first 7.68 s) was modeled as black-body emission. Values of keV and black-body emission area, Abb, of 1012 cm2 (at 10 kpc) were found. This, in principle, may give us a handle on the observed fluence. However, this gives us a value of Eb of 16110-8 erg cm-2 (using Tbb6.55 keV and Abb1.881012 cm2), which is also much larger than observed for the other short bursts. We, therefore, do not quote the peak flux and burst fluence in Table A.1. Using the Einstein database maintained at HEASARC444See http://heasarc.gsfc.nasa.gov/. we found the start of the (simultaneous HRI) observation as being March 29, 1980, 00:48:06 (UTC). The burst was observed 57 min later (Kahn et al. 1981). Using this and the observed rate just before the burst we determined an upper limit on .
A.2 FMC-2/Hakucho
Four bursts (two in 1981 and two in 1982; denoted A–D) were found, originating from GX 17+2, during pointed observations with the FMC-2 onboard Hakucho (Tawara et al. 1984c). They had e-folding decay times of 100 s (B, C) or 300 s (A, D). For each burst Tawara et al. (1984c) tabulated the net peak, net total (=fluence) and persistent flux in FMC-2 cts s-1 in the 1–22 keV band. From this they calculated . Using this information we calculated and verified . Tawara et al. (1984c) also provided the total integrated energy fluxes (= total fluence) of the two bursts in 1981 and the two bursts in 1982, together with the integrated persistent fluxes over 40 hr and 50 hr, respectively. Note that it is not clear if the fluence and persistent flux are both given for the 1–22 keV energy band, and whether the persistent fluxes are corrected for interstellar absorption or not. From this it was estimated that was of the order of 1000. Since the net fluence in counts of all bursts individually are given, we can determine the individual fluence in energy flux. Also, the (mean) persistent flux during the two observations can be determined. Moreover, assuming that between bursts A and B, which occurred 12.5 hr after each other, no other bursts occur, we give a more exact value for in this case (assuming a constant persistent flux). For the others we just assume the given value of 1000. We also give an estimate of the net peak burst flux, from the observed values of Fpers and .
A.3 ME/EXOSAT
Two bursts were found in the EXOSAT/ME observations taken in 1984 and 1985 with durations of 10 s and 5 min (Sztajno et al. 1986; denoted as burst I and II by Kuulkers et al. 1997). The persistent flux (2–20 keV) before a burst was determined from the spectral fits done by Sztajno et al. (1986), who used a bremsstrahlung plus a black-body component, subjected to interstellar absorption. The values for the bremsstrahlung parameters and NH were given in their text, whereas the black-body results were indicated in their figures 4 and 5. The spectral fit results to the net burst emission are shown in their figures 2 and 3, from which we determined the bolometric maximum net peak flux and the fluence. To determine the ‘rest’ fluence, we used the same approach as mentioned in Sect. 3.2.5, and fitted an exponential to the burst flux decay. In the case of burst I we have only 3 values; we therefore assumed that at infinity the burst flux decays to zero, while the exponential start time was set to the start of the burst. Since the spectral time resolution is not sufficient, we determined the burst parameters and from the observed raw (i.e. not dead-time corrected) count rate profiles (1–20 keV) given in their figure 1. We corrected the light curves for the ‘variable’ dead time (van der Klis 1989), as appropriate for the EXOSAT High Energy Resolution (HER) modes (see e.g. Kuulkers 1995). Sztajno et al. (1986) noted that in both bursts the maximum flux is 40% above the persistent level, indicating 2.5, in rough agreement with our estimates. Using the start time of the two observations during which the bursts occurred as given by Kuulkers et al. (1997), and assuming that the persistent flux was constant, we were able to determine lower limits on . Note that Sztajno et al. (1986) gave rough upper limits of 10000 and 500, for burst I and II, respectively, which are more or less consistent with our determined values.
For the two bursts (denoted as burst III and IV) observed in 1986 discussed by Kuulkers et al. (1997) we only estimated and from the observed (dead-time and background corrected) count rate profiles in the 1–20 keV band as displayed in their figure 7. is determined using the integrated net burst count rate profile and peak count rate. No spectral information is available for the persistent or burst emission in order to determine Fbb,max, Eb and , although they note that is probably larger than 1000 for the second burst, if no bursts occurred in between the two bursts. However, if we naively assume that the persistent count rate is constant between bursts, and that between the start of the 1986 EXOSAT observation and the first burst, and between the two bursts, no other burst occurred, we can still get a crude estimate of (the lower limit on) the value of .
Appendix B Distance estimate and gravitational redshift effect
| 0.25 s spectra | 16 s spectra | Rtdb | |||||
| burst | #c | d | e | # | (km) | ||
| b4 | 84 | 11.40.3 | 10.80.3 | 4 | 11.60.3 | 10.90.3 | 18.3 |
| b6 | 83 | 12.10.5 | 11.40.5 | 6 | 12.20.1 | 11.10.1 | 12.8 |
| b7 | 94 | 12.90.6 | 12.00.5 | 2 | 12.70.2 | 11.80.1 | 16.7 |
| b8 | 93 | 12.30.6 | 11.50.5 | 2 | 12.10.1 | 11.20.1 | 14.4 |
| b9 | 82 | 12.40.5 | 11.50.5 | 1 | 12.1 | 11.1 | 14.9 |
| Average: | 12.20.2 | 11.40.2 | 12.10.1 | 11.20.1 | 15.41.0 | ||
| a For the parameters used we refer to the text. | |||||||
| b Black-body radius R at touch down for a local observer (see text). | |||||||
| c Number of spectra in the expansion/contraction phase. | |||||||
| d Not taking into account gravitational redshift effects. | |||||||
| e Taking into account gravitational redshift effects. | |||||||
Most of the distances derived from radius expansion bursts in the literature are solely based on the observed fluxes at maximum expansion, Fbb,max, and assuming this equals the (non-relativistic) Eddington luminosity, LEdd,non_rel, from a source at distance . Here one uses L, where is the speed of light, the gravitational constant, the mass of the neutron star and the electron scattering opacity. Then the distance may be estimated as:
| (1) |
where is the anisotropy factor (for isotropic radiation =1). However, when the photosphere remains rather close to the neutron star, gravitational redshift effects become important (due to relativistic time dilation, see e.g. Lewin et al. 1993). The distance derived using Eq. B.1 is in fact only valid for values of the photosphere radius, RRns (see below). For RRns Eq. B.1 in principle only provides an upper limit on .
The (relativistic) Eddington luminosity for an observer near the neutron star is given by:
| (2) |
For an observer at Earth, Eq. B.2 becomes, taking into gravitational redshift effects:
| (3) |
where Rg is the Schwarzschild radius (1.5Rg; see Lewin et al. 1993). Also the effective black-body temperature measured at Earth, Teff,∞, is affected by the gravitational potential:
| (4) |
where Teff is the effective black-body temperature near the neutron star. Assuming that the source radiates as a black-body, we know that:
| (5) |
For LEdd,∞ we also have:
| (6) |
where FEdd,∞ is the Eddington flux received at Earth.
Eqs. B.3 and B.4 are strictly valid only for non-rotating stars, but it is still approximately correct for stars with rotation periods of a few milliseconds. FEdd,∞ is set equal to the observed net-burst fluxes, Fbb,net, during the radius expansion/contraction phase. As noticed in Sect. 5.2, it is not easy to infer Teff,∞ from our observed values of Tbb. We therefore fixed the hardening factor, Tbb/Teff,∞, to different values in order to assess its effect. We also assume certain values for and , and are then left with five equations (B.2–B.6) and five unknown variables (LEdd, LEdd,∞, Teff, R and d); this enables us to derive a distance estimate. First, one can eliminate LEdd and Teff by combining Eqs. B.2, B.4 and B.5, and one gets the following equality (for R1.5Rg):
| (7) |
Since this equation can not be solved easily in an analytic way, we solved for R numerically. Using R we can then determine LEdd,∞ (Eq. B.3), which in turn can be used to determine the distance, (Eq. B.6).
In the low-temperature limit the electron scattering opacity, , is given by cm2 g-1, where is the hydrogen fraction (by mass) of the photospheric matter (see e.g. Lewin et al. 1993). Note that for cosmic compositions =0.73. At very high temperatures (i.e. probably near the peak of bursts), however, the scattering electrons become relativistic and may instead be approximated by (in the low-density limit) , where is same as for the low-temperature limit (Paczyński 1983). It is not entirely clear how kT relates to our observed values of kTbb, but one may assume kT=kTbb (e.g. van Paradijs et al. 1990). We use the high temperature electron scattering opacity in our calculations. The estimated distances differ by a factor of 1.05 with respect to the estimates when taking the electron scattering opacity in the low-temperature limit (see also Table B.2).
The above described procedure for estimating the distance was followed using the values for Fbb,net and Tbb for each of the spectral fits to the 0.25 s and 16 s spectra in the radius expansion/contraction phase. When we assume no spectral hardening, i.e. Teff,∞=Tbb, and ‘standard’ parameters (=1.4 M☉, =0.73) no solutions can be found for those spectra having kTbb1.75 keV, i.e. only at the largest expansion radii do we have solutions (see also Table B.2)555Note that the gravitational redshift corrected distance estimates by Smale (1998: Cyg X-2), Kuulkers & van Klis (2000: GX 3+1) and Kaptein et al. (2000: 1RXS J171824.2402934) are derived using Teff,∞=Tbb and R=Rbb, thus only using Eqs. B.2, B.3 and B.6.. The highest observed values of kTbb during the radius expansion/contraction phase give the strongest constraints on the spectral hardening factor. This is at the moment of ‘touch-down’, i.e. at the vertex of the horizontal track and diagonal track in the flux versus temperature diagram. This locus is well defined for our long bursts observed in GX 17+2. Using the loci of the radius expansion bursts b4, b6–b9, we find that the minimum value of the (constant) hardening factor is between 1.34 (burst b4) and 1.52 (burst b6). The distance and radius R as inferred at the loci both increase for increasing spectral hardening (e.g. for burst b6, the distance increases by a factor 1.1, while R increases by a factor of 2 when the spectral hardening factor increases from 1.6 to 2).
In Table B.1 the results for ‘standard’ burst parameters can be seen, i.e. M☉, cosmic composition of the photospheric matter, isotropic radiation (=1), as well as taking Tbb/Teff,∞=1.7 and using the electron scattering opacity appropriate for high temperatures. We show the distance as derived by including gravitational redshift effects () and not including these effects (, i.e. using Eq. B.1). The errors are set equal to the observed variances in the derived distances.
| 0.25 s spectra | 16 s spectra | Rtdb | |||
| parametera | c | d | (km) | ||
| standarde | 12.10.5 | 11.40.5 | 12.20.1 | 11.10.1 | 12.8 |
| =2.0 M☉ | 14.40.6 | 13.50.6 | 14.60.1 | 12.70.2 | 13.0 |
| =0 | 15.90.7 | 15.30.6 | 16.10.1 | 15.10.1 | 18.9 |
| low-T | 11.60.5 | 11.00.5 | 11.70.1 | 10.60.1 | 11.8 |
| =2 | 8.50.3 | 8.10.3 | 8.60.1 | 7.90.1 | 12.8 |
| =0.5 | 17.10.7 | 16.20.7 | 17.30.1 | 15.80.1 | 12.8 |
| Tbb/Teff,∞=2 | 12.10.5 | 11.70.5 | 12.20.1 | 11.60.1 | 19.9 |
| Tbb/Teff,∞=1f | 12.10.5 (83) | 10.50.7 (9) | 12.20.1 (6) | — | — |
| a See text for details. | |||||
| b Black-body radius R at touch down for a local observer (see text). | |||||
| c Not taking into account gravitational redshift effects. | |||||
| d Taking into account gravitational redshift effects. | |||||
| e =1.4 M☉, =0.73, Tbb/Teff,∞=1.7,high-T , =1. | |||||
| f Between brackets the number of spectra taken into account are given. | |||||
By relaxing the assumptions of standard burst parameters (i.e. varying , and individually within reasonable limits, while keeping the others at the ‘standard’ values) one can get an estimate of the systematic uncertainties involved (see e.g. also Kuulkers & van der Klis 2000). The results are shown in Table B.2 for burst b6, which is the longest burst of our sample. We show the results assuming a neutron star mass of M☉, in the range required in models for explaining the kHz QPO in neutron star LMXBs (see e.g. Stella et al. 1999; Stella 2001; Lamb & Miller 2001), and close to the dynamical neutron mass estimate of Cyg X-2 using optical spectroscopy/photometry, 0.23 (Orosz & Kuulkers 1999). Note that the distance derived is rather high (Table B.2). We also made the assumption that the photospheric composition is hydrogen-poor (i.e. =0), as has been argued to be the case during radius expansion (see Sugimoto et al. 1984). However, the contraction phase of long bursts are typical of unstable mixed hydrogen/helium burning (see Sect. 5.4), which suggests that this is not a reasonable assumption. Also, the persistent mass accretion rate is inferred to be high, making it plausible that the photosphere will be continuously supplied with new hydrogen matter. Moreover, the distances derived are rather high (see Table B.2). We changed the anisotropy factor between the reasonable values (see van Paradijs & Lewin 1987; Lewin et al. 1993). Finally, we compared the distance values derived using values for valid for low temperatures. The results shown in Table B.2 suggests that the systematic uncertainties on the derived distance are up to 30%.