Redshift Evolution of the Merger Fraction of Galaxies in CDM Cosmologies
Abstract
We use semi-analytical modelling of galaxy formation to study the redshift evolution of the galaxy merger fractions and merger rates in CDM and quintessence (QCDM) cosmologies, their dependence on physical parameters such as the environment, the merger timescale, the way major mergers are defined, and the minimum mass of objects taken into account. We find that for a given final halo mass the redshift dependence of the merger fraction and the resulting merger rate can be fitted well by a power law for redshifts . The normalization and the slope depend on the final halo mass. For a given merger timescale and an assumed maximum mass ratio for major mergers, and depend exponentially on each other. The slope depends logarithmically on the ratio of the final halo mass and the minimum halo mass taken into account. In addition, the local normalization increases for larger while decreases. We compare the predicted merger fraction with recent observations and find that the model cannot reproduce both the merger index and the normalization at the same time. In general the model underestimates and by a factor of 2.
1 INTRODUCTION
Estimating the frequency of mergers in the universe is a challenging task. Besides the problems of defining a merger in contrast to an accretion event and finding such events, there is also the problem of the dependence on the environment, and the estimate of the merger timescales. For example, van Dokkum et al. (1999) find that the merger rate evolves as with in rich cluster, whereas the merger rate of field galaxies is found to evolve less strongly. In a recent study Le Fèvre et al. (2000) find using visually classified mergers and using close galaxy pairs in a population of field galaxies. Previous studies found (Carlberg, Pritchet, & Infante 1994), (Yee & Ellingson, 1995), (Patton et al., 1997), (Roche & Eales, 1999) and (Conselice, 2000). This spread in the values of the merger index is partly due to different methods used in deducing the merger rates (see e.g. Patton et al., 1997; Abraham, 1999). Correcting for selection effects in close pair studies, Patton et al. (2000) estimate that approximately of all nearby galaxies with are undergoing mergers.
On the theoretical side, Gottlöber, Klypin, & Kravtsov (2001) used N-body simulations and merger trees based on the Press-Schechter formalism, to derive the merger rate. They found for dark matter halos. In earlier studies of merger rates in N-body simulations Kolatt et al. (1999) found and Governato et al. (1999) found in a critical universe and in an open universe. In a previous semi-analytical approach Lacey & Cole (1993) calculated the accretion rate of baryonic cores. They assumed that each halo has only one baryonic core, neglecting the effect of multiple cores in a halo.
The purpose of this letter is a detailed investigation of the galaxy merger fraction and rate. In the following section the redshift dependence of the merger fraction and its dependence on the cosmological models, on the environment represented by the final dark halo mass, on the merger timescale, on the minimum mass of observed objects that would be identified as merger components, and on the definition of major mergers are investigated. Besides allowing a better understanding of how the merger rates of different observed samples are related, these estimates will test cosmological models.
2 THE MODEL
We study spatially flat CDM cosmologies with , and km s-1Mpc-1. We also study a quintessence model with and an equation-of-state (e.g. Caldwell, Dave, & Steinhardt 1998). Merger trees of dark matter halos were generated using the method described by Somerville & Kolatt (1999), which is based on the extended Press-Schechter formalism (Bond et al., 1991; Bower, 1991). This method was modified as proposed by Gottlöber et al. (2001). The power spectrum is obtained from the fitting formula of Bardeen et al. (1986) and normalized by . We use the expressions derived by Wang & Steinhardt (1998) for the value of and the linear growth factor. The history of a dark matter halo is followed back in time until the masses of all its progenitors fall below a minimum mass of . A progenitor with mass below is assumed to inhabit a small galaxy which has the mass of the surrounding dark matter halo. Whenever two halos merge the galaxies inside of them merge on a dynamical friction timescale as described by Kauffmann et al. (1999).
3 MERGER FRACTIONS AND RATES
From the observational point of view one can either estimate the fraction of visually confirmed mergers (Le Fèvre et al., 2000) or the fraction of galaxies in close pairs (e.g Patton et al., 2000, and references therein). To deduce the merger fraction it is necessary to correct the observed close pair fraction for background/foreground contaminations and to estimate how many of these physical close pairs are likely to merge (e.g. Yee & Ellingson, 1995; Le Fèvre et al., 2000). Usually one refers to the merger rate. The connection between the merger rate and the merger fraction is
| (1) |
where denotes the fraction of galaxies at redshift in close pairs which will merge on a timescale shorter than . Since depends on the separation of pairs, specifying also determines the close pairs. In general, observers measure the separation between galaxies in pairs and use the dynamical friction estimate to deduce a merger timescale. We calculate the merger fraction by counting the number of galaxies at each redshift which are experiencing a merger on a timescale less then and normalizing them to the total number of galaxies at this redshift. The merger fraction of galaxies at redshifts is usually approximated by a power law of the form:
| (2) |
where is the normalization to the local merger fraction (e.g. Le Fèvre et al., 2000).
For our analysis we consider only binary major mergers, which we define as mergers with mass ratio between and 1. Fig 1 shows the result of a representative simulation for a halo of mass at , adopting , , and a merger timescale of 1 Gyr for the CDM model. We find in all investigated cases that the merger rate and the merger fraction as a function of redshift can be approximated by a power law at redshifts , in agreement with the observations. At higher redshifts the merger rate flattens, which was also found by Conselice (2000) and Gottlöber et al. (2001).
In general, a range of final halo masses will contribute to the merger events seen in observational surveys. To take this into account and to estimate environmental effects we choose six different halo masses at redshift (; in units of ). Fig. 2 shows the dependence of and on and . For increasing , decreases and increases systematically. This trend is consistent with the findings of van Dokkum et al. (1999). Varying corresponds to different definitions of close pairs. The three curves in fig. 2 are exponential laws of the form , fitted to the merger fractions for different . The parameters used to fit the data points are and , and , and and for equal to 0.5 Gyr, 1 Gyr and 1.5 Gyr, respectively. In the same environment, that is the same final halo mass , increases with increasing merger timescale as binaries with larger separations are included. The merger index shows only weak variation.
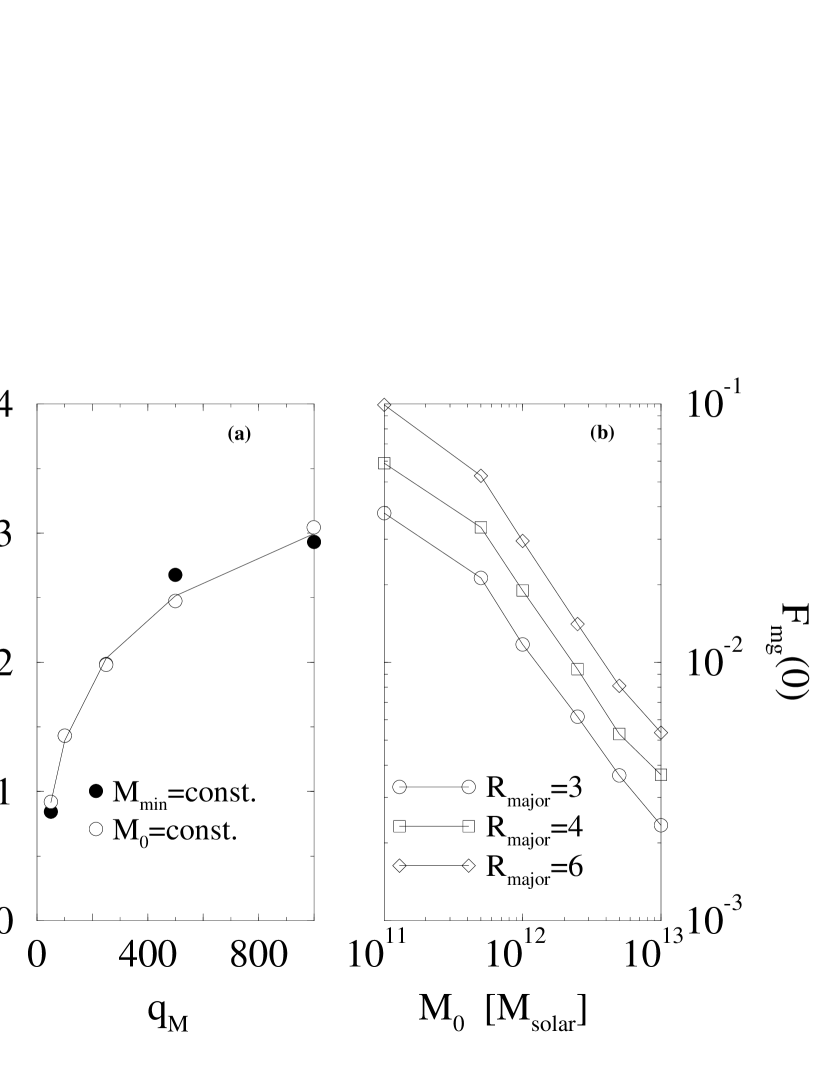
For computational reasons mergers are only resolved above a minimum mass . Mergers below this mass are neglected. This corresponds to observations with a magnitude limited sample of galaxies. The graphs in fig. 3a show the dependence of the merger index on . The filled circles are the results of merger trees with constant and varying . We compare these results with simulations for constant and varying , represented by open circles. The value of depends only on the ratio as .
Another important question is the influence of the definition of major mergers on the merger rate. The graphs in fig. 3b show the dependence of on different values of . An event is called major merger if the mass ratio of the merging galaxies is below and larger than 1. As increases, increases. We also find that the merger index stays roughly constant for low and decreases at larger . A decrease in with larger has also been reported by Gottlöber et al. (2001). It is a result of the adopted minimum mass for merger events. The detectable amount of major mergers with large mass ratios decreases faster with redshift than for equal mass mergers, since the small masses drop faster below the minimum mass. In observed samples of close pairs Roche & Eales (1999) and Patton et al. (2000) found that increased when they allow for larger , which agrees with our predictions.
How do the theoretical models compare to the observations? The star in fig. 2 is the measured merger fraction for field galaxies by Le Fèvre et al. (2000), who used and the local merger fraction of Patton et al. (1997). They identified close pairs as those which merge on a timescale less then Gyr. To compare this merger fraction with our estimates one needs to take into account that the dark halos of field galaxies can vary over a range of masses and that the merger timescale is subject to large uncertainties. We therfore weighted the different merger fractions of our sample of field galaxies with halo masses between and according to the Press-Schechter predictions. The merger index and the local merger fraction for different were calculated using the fitting formulae as shown by the graphs in fig. 2 and fig. 3a. We varied the the range of halo masses contributing to the sample by changing the lower bound of halo masses from to and changed within the range of 0.5 - 1.5 Gyr. The results of this reasonable parameter range lie inside the shaded region in fig. 2. Results for larger correspond to the upper part of the region and those for larger halo masses lie in the right part of the region. A comparison of our results with the observations shows, that the predicted merger index and the normalization are a factor 2 smaller than observed.
As a possible solution to this problem we have studied a quintessence model with . The QCDM model shows a shallower increase in the comoving number density of mergers with redshift than the CDM model. There is however not a significant difference in the merger fractions. This results from the fact that the difference in the comoving number density is compensated by the length of the redshift range contributing to the merger fractions. The QCDM universe with an age of years is younger than the adopted CDM universe with an age of years, which is the reason why the same refers to a larger redshift range in the QCDM universe. This result also emphasizes, that it will not be possible to break the degeneracy of these models by measuring merger rates. Comparing Le Fèvre et al. (2000) results with those obtained from the combined Caltech Faint Galaxy Redshift Survey (CFGRS) and Canadian Network for Observational Cosmology field galaxy survey (CNOC2) (R. Carlberg, private communication), which includes also minor majors, reveals that including minor mergers leads to a smaller merger index which is consistent with the predictions of our simulations. It is therefore not surprising that these two observed merger indices differ.
4 DISCUSSION AND CONCLUSIONS
Using semi-analytical modelling we recover a power law for the evolution of the merger rates and fractions at , as has been reported in earlier work. Varying the final mass , the local merger fraction shows an exponential dependence on the merger index of the form . The actual values of the parameters depend mainly on the merging timescale and on the definition of major mergers. Our predictions that will increase and will decreases in more massive environments is in qualitative agreement with observations. The merger index depends on the environment through the mass ratio . The logarithmic function fits the data well. We find a similiar behavior as Patton et al. (2000), which have shown that if they extend their galaxy sample to fainter magnitudes the local merger fraction rises. In addition, we also find that the merger index decreases with higher mass ratios. This is also beeing found by comparing the results of the combined CFGRS and CNOC2 sample with those of Le Fèvre et al. (2000). The adopted QCDM model does not show any significant difference to the CDM model. Therefore it is not possible to distinguish between these two models by measuring the merger rate of galaxies.
Our model predicts values for and which are too small
by a factor of 2 compared with the predictions by Le Fèvre et al. (2000) who used
the local merger fraction estimate of
Patton et al. (1997) which was derived with a different definition of major
mergers than theirs. As we have shown, the definition of a major merger
is crucial for the expected merger fraction. Our results indicate that the
local merger fraction for the galaxy sample of
Le Fèvre et al. (2000) who used must be less
than the value measured by Patton et al. (1997) who used a larger
. A smaller value of would lead to an even larger
discrepancy in compared to our results.
Another issue might
be observational errors, like projection effects or
uncertanties in the merger timescale estimates.
Our results strongly emphasize that the comparison of merger
fractions deduced
from different samples and with alternative techniques is questionable
if the adopted mass range and the definitions of close pairs and
major mergers are not the same.
We thank Ray Carlberg for pointing out the results from the CFGRS and CNOC2 data and Stefan Gottlöber for usefull comments.
References
- Abraham (1999) Abraham, R. G. 1999, in IAU Symp. 186, Galaxy Interactions at Low and High Redshift, ed. J. E. Barnes, & D. B. Sanders (Dordrecht: IAU), 11
- Bardeen et al. (1986) Bardeen, J. M., Bond, J. R., Kaiser, N., & Szalay, A. S. 1986, ApJ, 304, 15
- Bond et al. (1991) Bond, J. R., Cole, S., Efstathiou, G., & Kaiser, N. 1991, ApJ, 379, 440
- Bower (1991) Bower, R. G. 1991, MNRAS, 248, 332
- Caldwell et al. (1998) Caldwell, R. R., Dave, R., & Steinhardt, P. J. 1998, Physical Review Letters, 80, 1582
- Carlberg et al. (1994) Carlberg, R. G., Pritchet, C. J., & Infante, L. 1994, ApJ, 435, 540
- Conselice (2000) Conselice, C. J. 2000, preprint (astro-ph/0012008)
- Gottlöber et al. (2001) Gottlöber, S., Klypin, A., & Kravtsov, A. V. 2001, ApJ, 546, 223
- Governato et al. (1999) Governato, F., Gardner, J. P., Stadel, J., Quinn, T., & Lake, G. 1999, AJ, 117, 1651
- Kauffmann et al. (1999) Kauffmann, G., Colberg, J. M., Diaferio, A., & White, S. D. M. 1999, MNRAS, 303, 188
- Kolatt et al. (1999) Kolatt, T. S. et al. 1999, ApJ, 523, L109
- Lacey & Cole (1993) Lacey, C. & Cole, S. 1993, MNRAS, 262, 627
- Le Fèvre et al. (2000) Le Fèvre, O. et al. 2000, MNRAS, 311, 565
- Patton et al. (1997) Patton, D. R., Pritchet, C. J., Yee, H. K. C., Ellingson, E., & Carlberg, R. G. 1997, ApJ, 475, 29
- Patton et al. (2000) Patton, D. R., Carlberg, R. G., Marzke, R. O., Pritchet, C. J., da Costa, L. N., & Pellegrini, P. S. 2000, ApJ, 536, 153
- Roche & Eales (1999) Roche, N. & Eales, S. A. 1999, MNRAS, 307, 703
- Somerville & Kolatt (1999) Somerville, R. S. & Kolatt, T. S. 1999, MNRAS, 305, 1
- van Dokkum et al. (1999) van Dokkum, P. G., Franx, M., Fabricant, D., Kelson, D. D., & Illingworth, G. D. 1999, ApJ, 520, L95
- Wang & Steinhardt (1998) Wang, L. & Steinhardt, P. J. 1998, ApJ, 508, 483
- Yee & Ellingson (1995) Yee, H. K. C. & Ellingson, E. 1995, ApJ, 445, 37