Constraints on Thermal Emission Models of Anomalous X-ray Pulsars
Abstract
Thermal emission from the surface of an ultramagnetic neutron star is believed to contribute significantly to the soft X-ray flux of the Anomalous X-ray Pulsars (AXPs). We compare the detailed predictions of models of the surface emission from a magnetar to the observed spectral and variability properties of AXPs. In particular, we focus on the combination of their luminosities and energy-dependent pulsed fractions. We use the results of recent calculations for strongly magnetized atmospheres in radiative equilibrium to obtain the angle- and energy-dependence of the surface emission. We also include in our calculations the significant effects of general relativistic photon transport to an observer at infinity as well as the effects of interstellar extinction. We find that the combination of the large pulsed fractions and the high inferred luminosities of AXPs cannot be accounted for by surface emission from a magnetar with two antipodal hot regions or a temperature distribution characteristic of a magnetic dipole. This result is robust for reasonable neutron star radii, for the range of magnetic field strengths inferred from the observed spin down rates, and for surface temperatures consistent with the spectral properties of AXPs. Models with a single hot emitting region can reproduce the observations, provided that the distance to one of the sources is less than the current best estimate, and allowing for systematic uncertainties in the spectral fit of a second source. Finally, the thermal emission models with antipodal emission geometry predict a characteristic strong increase of the pulsed fraction with photon energy, which is apparently inconsistent with the current data. The energy-dependence of the pulsed fraction in the models with one hot region shows a wider range of behavior and can be consistent with the existing data. Upcoming high-resolution observations with Chandra and XMM-Newton will provide a conclusive test.
1 INTRODUCTION
Anomalous X-ray Pulsars (AXPs), first identified as a new class by Mereghetti & Stella (1995; see also Hellier 1994), are bright () X-ray sources with soft spectra. They have periods clustered between 612 s and no detectable radio counterparts. Of the five sources and one candidate known to date, three are found in supernova remnants (Gaensler et al. 2001). These associations as well as the low galactic latitudes of the AXPs imply that they are a young population of neutron stars. Their large period derivatives (), together with the constraints on the presence of companion stars set by Doppler delay measurements and the tight limits on the optical emission from an accretion disk (see, e.g., Mereghetti, Israel, & Stella 1998; Hulleman, van Kerkwijk, & Kulkarni 2000) led to the suggestion that AXPs are isolated neutron stars with very large magnetic field strengths ( G; Thompson & Duncan 1996).
In a group of models based on this hypothesis, collectively referred to as magnetar models, a large fraction of the X-ray emission of AXPs is powered by the decay of this strong magnetic field (see, e.g., Thompson & Duncan 1996), by neutron star cooling (Heyl & Hernquist 1998), by crustal fracturing under large magnetic torques (Duncan 1998), or even by isolated regions of intense magnetic activity on the neutron star surface. In all these cases, the heat released in the crust emerges as thermal radiation through the neutron star atmosphere, which has an anisotropic temperature distribution due to the presence of the strong magnetic field. In addition, magnetospheric processes may have a significant contribution to the total emission and have been suggested as the origin of hard tails observed in the spectra of AXPs. In the present paper, we focus on the surface emission, and compare the detailed predictions of these models to the properties of thermal-like emission observed in AXPs (see §2.2).
The possibility of constraining models of AXPs based on the observed properties of their pulse profiles was recently pointed out by DeDeo, Psaltis, & Narayan (2001). A very prominent characteristic of AXPs is that their X-ray fluxes can be highly modulated during a pulse cycle. Correspondingly, they have a wide range of pulsed fractions, extending from to as high as in the keV photon-energy range (see, e.g., Pivovaroff, Kaspi, & Camilo 2000). Taking into account the suppression of pulsed fractions caused by general relativistic light bending around the neutron star surface, DeDeo et al. (2001) show that the high end of this range of pulsed fractions can be produced only if the surface emission is localized and highly beamed. This calculation, however, is carried out for bolometric pulsed fractions and relies on simple, radially peaked mathematical functions for describing the beaming of the emerging radiation. Using a similar description, Perna, Heyl, & Hernquist (2000) argue that the effects of interstellar extinction might significantly increase the bolometric pulsed fractions. We discuss these effects in §3.4.
Simultaneous consideration of the variability properties and the X-ray luminosities of AXPs provides an even more powerful diagnostic of the underlying emission mechanism (Psaltis, Özel, & DeDeo 2000). This is because, for a thermally emitting star of a given effective temperature, a small emitting area minimizes the pulse-phase averaged luminosity, while maximizing the pulsed fraction. This was demonstrated in the case of blackbody radiation that emerges isotropically from the neutron-star surface. In the present work, we use this effect as a test of the thermal emission models proposed for the AXPs, because they are simultaneously bright and can reach high pulsed fractions. Furthermore, we propose to use as another test of emission models the energy-dependence of the pulsed fraction, which carries characteristic signatures of the underlying emission mechanism. Applying the above diagnostics to AXPs as well as going beyond the study of purely bolometric pulsed fractions requires the calculation of the photon-energy and angle dependences of the radiation emerging from an ultramagnetized neutron star atmosphere.
Models of neutron-star atmospheres in radiative equilibrium have recently been calculated for the G magnetic field strengths required by the magnetar models of AXPs (Özel 2001a; Ho & Lai 2001). These calculations demonstrate that the emerging spectra are broader in shape than pure blackbodies and have color temperatures that are higher than the effective temperatures of the atmospheres (see also Zane et al. 2001 and §3.2 for a discussion). Özel (2001a) also shows that taking into account vacuum polarization effects leads to the generation of a power-law tail at high photon energies for high magnetic field strengths. Moreover, angle-dependent radiative transfer calculations show that the beaming of the emerging radiation depends strongly on photon energy, is largely non-radial, and, therefore, cannot be described by any of the simple beaming functions used in previous studies (Özel 2001a). As a result, general relativistic light bending may actually lead to an increase of the pulsed fraction for such non-radially peaked radiation patterns (Özel 2001b). This thus affects the generality of the results of DeDeo et al. (2001).
In this paper, we use the results of detailed calculations of magnetar atmospheres (Özel 2001a, 2001b) in order to compare the predicted spectral and variability properties of thermally emitting magnetar models to a synthesis of all available data on AXPs. In particular, we apply two diagnostic tests relevant for thermal emission models (§4) to ASCA and BeppoSAX observations of AXPs in order to assess the viability of such models. We begin by reviewing the observed properties of AXPs, focusing on their pulsed fractions, thermal luminosities, and distance estimates.
2 THE DATA
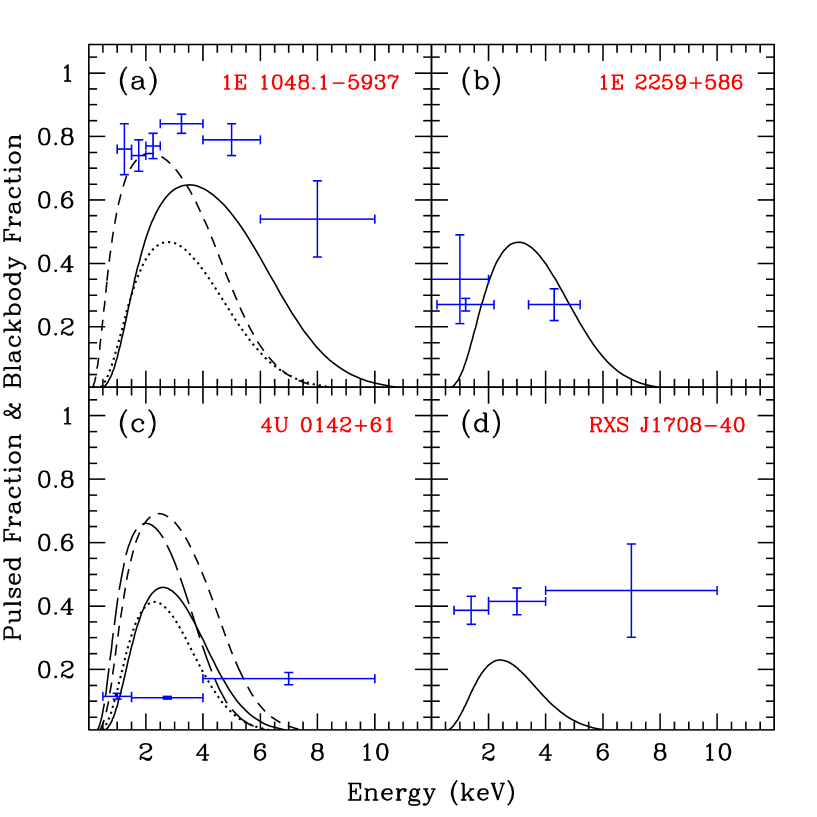
In this section, we discuss the observed properties of AXPs, summarized in Figure 1, and Tables (see also Mereghetti 2001 for a review). The list of 5 known AXPs, along with their periods, period derivatives, and inferred dipole magnetic field strengths are given in Table 1. We consider in detail their pulse morphologies, pulsed fractions, spectra, and the distance estimates to these sources, all of which play an important role in the proposed diagnostic tests discussed in detail in §3 and §4. Because three AXPs are inside supernova remnants (Gaensler et al. 2001), accurate measurements of their pulsed fractions and X-ray spectra require the use of imaging telescopes to remove the contamination from the remnants. For this reason we focus our discussion on observations carried out with imaging telescopes.
2.1 Pulse Profiles and Pulsed Fractions
The pulse profiles of AXPs are characterized by large duty cycles (see Gavriil & Kaspi 2001 and references therein) and pulsed fractions in the range to that depend weakly on photon energy (see Table 2 and Fig. 1). Monthly monitoring of five AXPs over three years with the Rossi X-ray Timing Explorer showed no detectable variability of their pulse shapes (Gavriil & Kaspi 2001), indicating that the pulse profiles of AXPs are largely stable (but see Iwasawa, Koyama, & Halpern 1992 for possible short-duration changes in the pulse profile of 1E 2259586).
AXPs show a varying degree of structure in their pulse profiles. With the exception of 1E 1048.15937 which shows a highly sinusoidal pulse (e.g., Oosterbroek et al. 1998), the profiles of the other AXPs show multiple peaks in a pulse cycle and significant power in the second harmonic (Gavriil & Kaspi 2001). We can make use of the structure of the pulse profiles to infer the emission geometry. In the framework of the thermally emitting magnetar model, with its non-radial beaming pattern, this structure can be accounted for either by the presence of two antipodal emission regions or by a single emission region, depending on the observer angle (Özel 2001b). We consider both of these cases in §4.
To characterize pulse variability of AXPs, we consider the peak-to-peak changes of the X-ray flux during a pulse cycle, as measured by the pulsed fraction defined as
| (1) |
Here, and are the maximum and minimum values of the observed photon flux. We now consider the pulsed fraction and its energy dependence for each source separately.
For 1E 1048.15937, the weak energy dependence of the pulsed fraction was determined from BeppoSAX observations by Oosterbroek et al. (1998). The pulsed fraction was found to be in six energy bands (see Fig. 1a). Similar results were also obtained by Corbet & Mihara (1997) and Paul et al. (2000) with ASCA observations.
For 1E 2259586, which lies in the supernova remnant CTB 109, pulse profiles at different photon energies have been published mostly for observations made with non-imaging detectors (Tenma: Koyama, Hoshi, & Nagase 1987; EXOSAT: Hanson et al. 1988, Morini et al. 1988; Ginga: Koyama et al. 1989). The contamination from the remnant emission at low photon energies leads to an apparent increase of the pulsed fraction with energy (as, e.g., reported by Koyama et al. 1989). Hanson et al. (1988) compared the pulsed fraction measured using the imaging telescope (LE) onboard EXOSAT at low energies ( keV), with the value measured using the non-imaging detector (ME) at higher photon energies ( keV, which are less contaminated by the remnant) and suggested that in this source the pulsed fraction depends very weakly on photon energy. This is also consistent with the results of Rho & Petre (1997) who published the pulse profile observed with ROSAT/PSPC in the keV range (the exact energy bounds are not quoted in the paper), from which we infer a pulsed fraction of (Fig. 1b).
Analysis of the pulse profiles of 4U 014261 at different photon energies yields consistent pulsed fractions between BeppoSAX (Israel et al. 1999) and ASCA observations (White et al. 1996; Paul et al. 2000). We use the pulse profiles of Israel et al. (1999) to infer the pulsed fractions in three energy bands, which yield in the two lower and in the highest bands (Fig. 1c).
For 1RXS J1708494009 (hereafter referred to as RXS J170840 for simplicity), we infer the pulsed fraction in three energy bands using the pulse profiles from ASCA observations reported by Sugizaki et al. (1997). The results are shown in Figure 1d.
Finally, the low observed countrates from 1E 1841045 do not allow for a comparison of pulsed fractions at different photon energies. Vasisht & Gotthelf (1997) report that the pulsed fraction in the ASCA/GIS energy band ( keV) is roughly after subtracting the contribution of the supernova remnant to the flux. (Note that the actual value for the pulsed fraction quoted in Vasisht & Gotthelf 1997 is because of a factor of 2 difference in the definition of this quantity adopted by these authors.)
2.2 Spectral Fits
The observed X-ray spectra of AXPs are soft and suggest the presence of thermal emission originating from the surfaces of the neutron stars. However, in most cases, a single blackbody component is insufficient to characterize the spectrum and the residual hard excess is typically modeled with the addition of a steep power law (see Table 3 and Mereghetti 2001 for a review). Although a fraction of this hard excess may be due to the effects of the neutron star atmosphere, the power-law tail has often been assumed to have a separate, possibly magnetospheric, origin. The blackbody contribution to the observed flux is large at moderate ( keV) photon energies, ranging between (see Fig. 1).
Recently, Perna et al. (2001) fit the spectra of AXPs with a model of surface emission from a strongly magnetic neutron star with a dipole field geometry (Heyl & Hernquist 1998). They argue that the fits still require the addition of a power-law component, although we note that its statistical significance is weak (at the level) given the large uncertainty in the reported power-law normalizations (see Table 2 of Perna et al. 2001). It should also be noted that the atmosphere model (Heyl & Hernquist 1998) employed by the authors makes use of Rosseland mean opacities which is problematic because such an averaging, dominated by one of the photon polarization modes of an ultramagnetized plasma, fails to capture the important polarization and angle dependence of the magnetic opacities. Therefore, the resulting radial temperature profiles do not show the characteristic plateaus at multiple depths in the atmosphere and can be an order of magnitude too high at the neutron star surface, giving rise to incorrect spectra (Shibanov et al. 1992; Özel 2001a). The requirement for a power-law component in connection to more detailed models of surface emission has not yet been explored (also see below).
Regarding such spectral decompositions, we first note that the weak dependence of the pulsed fraction on photon energy, together with the fact that the blackbody contribution is highly variable with photon energy (Fig. 1), with a prominent peak at keV, is problematic for any model that consists of two distinct thermal and non-thermal emission mechanisms of different origins (see also Oosterbroek et al. 1998). For example, for the BeppoSAX observations of 1E 1048.15937, the blackbody contribution is at keV and at keV, while the pulsed fraction remains constant at . Therefore, to explain the weak energy-dependence of the pulsed fraction would require the two components to be strongly coupled in a contrived way, or to be pulsed with the same nearly constant pulsed fraction and without a significant phase lag.
In either case, since the thermal surface emission, as inferred from the large blackbody contribution, dominates the total flux at least at keV for most AXPs, the surface emission itself needs to be strongly pulsed in this energy range, given the observed pulsed fractions. This is true even if the inferred power-law component dominates the luminosity measured over a much wider energy range. Therefore, the recent suggestion that the high pulsed fractions may be due to the power-law components alone, based on the large contribution of the power law to the flux over a wide energy range (Perna et al. 2001), is not supported by the energy dependences of the pulsed fractions and of the two spectral components. (Note also that the inferred power-law contribution to the keV flux for all AXPs found by Perna et al. 2001 suffers from large formal uncertainties).
Recent theoretical models of strongly magnetic neutron-star atmospheres have shown that the emerging spectra are significantly broader than a simple blackbody and, depending on the magnetic field strength, can exhibit power-law tails (Özel 2001a). This suggests that the surface emission alone may be able to account for the entire observed spectra, including the power-law tails. Correspondingly, simple blackbody fits may have caused an overestimate of the inferred power-law components. Therefore, within the framework of the thermally emitting magnetar models, the blackbody component of the spectral decomposition provides only a lower limit to the thermal contribution from the neutron star surface.
In this paper, we use the decomposition of the observed AXP spectra into two components only as a mathematical expression that describes their shapes. We focus on the fluxes of the blackbody components as lower limits to the emission from the stellar surfaces. We also use their measured temperatures ( in Table 3) for a direct comparison of the magnetar models to the existing fits, by setting , where is the color temperature of the thermal emission spectrum measured at infinity.
2.3 Distance Estimates
AXPs have been discovered in a wide range of galactic longitudes and with a distribution clustered close to the galactic plane. The distances to these sources are uncertain, primarily due to the lack of counterparts for most of them. Various techniques have been employed, involving the properties of the compact objects in the X-rays and, in some cases, those of the associated supernova remnants. Because one of our diagnostic tools (see §4 and Fig. 6) depends sensitively on the inferred source luminosities, hence distances, we review here in detail the current best distance estimates and assess their uncertainties (see also Table 4).
The AXP 1E 1048.15937 lies in the direction of the Carina nebula (Seward, Charles, & Smale 1986). The spectral fits for this source require an equivalent neutral hydrogen column density in the range cm-2 (see Table 3). The values of cm-2 that resulted from fitting a simple power-law spectral model to low-resolution data (Seward et al. 1986) are not favored by subsequent ASCA and BeppoSAX observations. The lower end of this range implies an optical extinction of mag (Gorenstein 1975; Predehl & Schmitt 1995), comparable to or exceeding those of stars () that lie within the Carina nebula (e.g., Turner & Moffat 1980). This implies that the source is within or behind the nebula and, therefore, has a minimum distance of 2.7 kpc, as suggested by Seward et al. (1986). We have also verified this conclusion by comparing the interstellar extinction measurements for other X-ray sources in the Carina nebula (Corcoran, M. private communication) to the value inferred for 1E 1048.15937, reaching consistent results. We therefore adopt the value of 2.7 kpc as a conservative lower limit to the distance. (Note that the 10 kpc distance used by Perna et al. 2001 has been calculated by Mereghetti & Stella 1995 using spin-equilibrium arguments for an accreting G neutron star and is, therefore, inconsistent to use in connection with a magnetar model.)
The distance estimate to 1E 2259586 is linked to the distance measurements to the supernova remnant CTB 109 (G109.11.0), which is likely to be associated with the pulsar (Fahlman & Gregory 1981; see also Gaensler et al. 2001). This association is based on the spatial coincidence of the two sources and is supported by the similar X-ray column density towards the pulsar and remnant. Several independent measurements exist for the distance towards the supernova remnant. The strongest (lower) limit of kpc is based on spectrophotometric distances to stars in HII regions within a molecular cloud that appears to be either in contact with or in front of CTB 109 (Crampton, Georgelin, & Georgelin 1978; Tatematsu et al. 1987). Kinematic 21-cm distance measurements place the remnant as well as the molecular cloud at a distance of kpc. The discrepancy with the spectrophotometric distance is likely to be caused by the assumption of circular orbits in the kinematic distance analysis (Braun & Strom 1986). Finally, the uncertain relation for supernova remnants yields a distance of kpc for CTB 109, though with significant uncertainty (Hughes et al. 1984). These distance measurements are discussed in more detail in Wang et al. (1992) and Hulleman et al. (2000b). Here, we adopt the conservative range of kpc for the distance to 1E 2259586.
The distance estimates to 4U 014261, which lies at , rely on the values of the column density inferred from spectral fits. Different studies with ASCA and BeppoSAX yield consistent values; they find cm-2, which implies mag of optical extinction. Comparing this value to the extinction measured for stars in two open clusters along the same direction ( mag), Israel, Mereghetti, & Stella (1994) concluded that the distance to the AXP is larger than kpc, which is determined independently for the clusters. However, Israel et al. (1994) also noted that the distance to the clusters may not imply a lower limit for the distance to the AXP, because the line-of-sight to 4U 014261 crosses the edge of a local ( kpc) molecular cloud. Including or neglecting the contribution of the molecular cloud to the extinction results in two different lower limits for the distance to the source, both of which we consider in our calculations.
The source RXS J170840 is another AXP for which the distance estimate relies on the column density inferred from X-ray extinction. The range of column densities cm-2 obtained from spectral fits (Sugizaki et al. 1997) agrees well with the total atomic and molecular H column densities obtained using 21-cm and CO observations in the direction of the source, which lies towards the Galactic Center. Given that the latter column densities correspond to the contribution from the entire galaxy along the line of sight, Sugizaki et al. (1997) concluded that the source cannot lie at a distance much closer than the Galactic Center. We explored the possibility of local extinction along the line-of-sight to the pulsar contributing to its column density and implying a smaller distance. We used W3NH (Dickey & Lockman 1990, http://heasarc.gsfc.nasa.gov/cgi-bin/Tools/w3nh/w3nh.pl) and found that the above values are typical ( cm-2) for lines of sight within a few degrees of the direction to the pulsar. Therefore, we choose a fiducial distance of 8 kpc for this source.
Finally, a robust determination of the distance to 1E 1841045 comes from studies of 21-cm absorption towards the supernova remnant Kes 73 (G27.40.0) associated with the pulsar (Sanbonmatsu & Helfand 1992). This yields a kinematic distance of kpc, where the effects of non-circular orbits have been taken into account in determining this range.
3 PROPERTIES OF THERMAL EMISSION FROM A MAGNETAR
In magnetar models, thermal emission is expected to arise when heat, originating from the neutron-star core or released in the crust, is transported to the surface through the stellar atmosphere. These surface layers, therefore, shape the observable characteristics of the neutron star. In this section we explore the spectral and variability properties of the surface emission predicted by magnetar models (Özel 2001a,b). In particular, we focus on phase-averaged spectra as well as on bolometric and photon-energy-dependent pulsed fractions.
3.1 Description of the Model
We use the radiative equilibrium atmosphere models described in Özel (2001a) to calculate the beaming and energy dependence of the radiation emerging from the surface of a strongly magnetic neutron star. We carry out the radiative transfer calculations for a fully ionized, plane-parallel H atmosphere. We take into account conservative scattering and absorption by free electrons as well as the effects of virtual pairs present in the magnetic vacuum. We also assume that the magnetic field is orthogonal to the surface. Note that our diagnostics employ the maximal pulsed fraction from a thermally emitting neutron star, which is obtained when the magnetic field is taken to be normal to the surface everywhere on the neutron star (this is for calculating the beaming of radiation only; we allow for different magnetic field geometries when calculating the emerging flux). This is because, in a magnetic dipole geometry, the angle of the magnetic vector to the surface normal increases from the magnetic pole to the equator, thus spreading the observable radiation over a larger fraction of the pulse cycle and suppressing the variability.
We assume a temperature anisotropy on the surface of the neutron star with hot emitting regions and cold regions that produce negligible radiation. We specify the flux emitted from the hot regions by an effective temperature , which determines the flux through a radiative equilibrium atmosphere through , where is the Stefan-Boltzmann constant. We consider one as well as two identical antipodal hot caps, motivated by the pulse profiles of AXPs (see §2 and Özel 2001b). The temperature in this case is assumed not to vary across the hot emitting regions, the angular sizes of which are denoted by . In addition, we consider a second temperature distribution on the surface that is suggested for a cooling neutron star with a strong dipole magnetic field (Heyl & Hernquist 1998). In this case, the variation of the effective temperature from the magnetic pole to the equator is given by
| (2) |
where is the temperature of the magnetic pole and is the polar angle with respect to the magnetic axis.
We take into account general relativistic photon transport for the calculation of quantities that are measured by an observer at infinity. We use the photon trajectories given by the Schwarzschild metric, which is a good approximation for slowly rotating neutron stars such as AXPs, and follow the method described by Pechenick, Ftaclas, & Cohen (1983) to compute light curves and spectra.
In our calculations, we explore the effects of varying the neutron star properties as well as the orientation of the observer with respect to the rotation axis of the star. The former parameter space includes the surface temperature , the magnetic field strength on the magnetic pole, and the neutron star compactness, described here by the relativity parameter , where and are the radius and mass of the neutron star, respectively. We consider effective temperatures and magnetic field strengths in the ranges keV keV and G G, respectively, as suggested by the spectral and timing properties of AXPs. We also consider a neutron-star compactness in a range such that , which is allowed by current equations of state for a wide range of neutron star masses and magnetic field strengths (see, e.g., Cardall, Prakash, & Lattimer 2001). In Figures 5-7, we assume a fiducial neutron star radius of 10 km but discuss in §4 the effects of changing this value. In addition, the properties of the observed radiation from the neutron star are affected by two angles, and , that specify, respectively, the position of the hot region on the neutron star surface with respect to the rotation axis, and of the observer with respect to the same axis. We allow both of these angles to vary between and .
3.2 Phase-Averaged Spectra
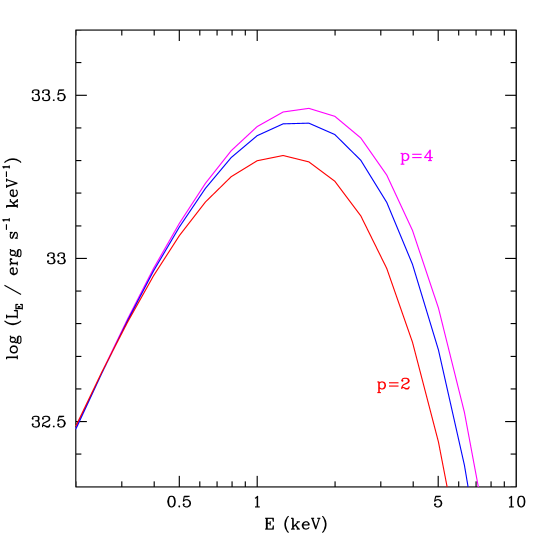
Figure 2 shows the phase-averaged spectrum as measured by an observer at infinity, for a neutron star of G with two antipodal hot emitting regions of keV and , and different values of the relativity parameter . In this calculation, we assumed an orthogonal rotator (i.e., ). However, when calculating the diagnostic curves presented in §4 and §5, we take into account all possible orientation angles. This is important because Özel (2001b) shows that the spectra depend sensitively on the choice of and .
The spectra shown in Figure 2 are broader than pure blackbodies and show hard excesses. The color temperature measured at infinity of the best-fit blackbodies are for and for , with yielding the spectrum with the highest gravitational redshift. In the range of temperatures and magnetic field strengths considered here, , as the significant color correction arising from the atmosphere is partially offset by the gravitational redshift. Therefore, the resulting color temperatures are keV, comparable to those typical of the blackbody components in the blackbody plus power-law decomposition of the observed AXP spectra (see Table 3). We use this entire range of values in the diagnostic plots discussed in §4 (see also Özel 2001b for a detailed discussion and a table of color temperatures including the models for G). Note that the broad-band spectra presented here are consistent with those of Ho & Lai (2001) but differ from the results of Zane et al. (2001) who use a local temperature-correction scheme that has poor convergence properties and does not yield radiative-equilibrium solutions.
3.3 Energy-Dependent Pulsed Fractions
The pulse profiles and the corresponding pulsed fractions for a thermally emitting neutron star measured by an observer at infinity are determined by (i) the beaming of the radiation emerging from the stellar surface, (ii) the temperature anisotropy on the neutron star, and (iii) the general-relativistic photon transport from the star to the observer (see, e.g., Page 1995). For the case of a thermally emitting magnetar, all three effects may introduce a strong dependence of the pulsed fractions on photon energy.
The beaming of radiation at the stellar surface of a strongly magnetic neutron star has two local maxima: a narrow peak in the radial direction, producing a pencil-like beam, and a broader one away from the normal to the surface, producing a fan-like beam (see, e.g., Mészáros 1992; Pavlov et al 1994; Özel 2001a). The relative photon flux of the two peaks depends on both the photon energy and the magnetic field strength, through the ratio , where and are the photon and the electron cyclotron energies, respectively. In particular, for strong magnetic fields ( G), the fan beam dominates the emerging flux. In addition, with increasing photon energy, this non-radial peak appears at larger angles from the normal and becomes narrower. Such a radiation pattern results in a pulsed fraction that typically increases strongly with photon energy.
Even in the absence of energy-dependent beaming, a temperature anisotropy on the neutron star gives rise to an energy dependent pulsed fraction (Page 1995); note that an anisotropy is always required for the surface emission to be pulsed. This energy dependence arises from an overall shift in the color temperature of the observed spectrum during a pulse cycle, caused by the successive appearance of hotter and colder regions along the line of sight. As a result, the flux emitted in a narrow range of photon energies corresponding to the peak of the phase-averaged spectrum shows little variation, while the rest of the spectrum suffers large excursions. Therefore, the pulsed fraction shows a minimum at a photon energy comparable to the peak of the phase-averaged spectrum and increases strongly at higher energies due to the exponential character of the spectrum.
Finally, the pulsed fraction measured by an observer at infinity depends also on the curvature of the photon trajectories outside the compact star. For radially peaked and energy independent beaming patterns and for typical values of the neutron-star compactness, general-relativistic effects spread the pulsar beam, suppressing the observed variability (Pechenick et al. 1983). However, for the fan-shaped beaming pattern relevant for strongly magnetized atmospheres, general relativity may actually enhance the pulsed fractions with increasing neutron-star compactness, by combining the flux from two antipodal hot regions so that it peaks at a phase away from the magnetic axis (Özel 2001b). Moreover, even in the case of radiation from a single emitting region, the two fan beams at low photon energies may combine along the magnetic axis in a similar way, depending on the orientation angles and the size of the emitting region (also see below). Finally, depending on the compactness of the neutron star, general relativistic redshifts alter the peak of the phase-averaged spectrum and thus the pulsed fraction at a given photon energy as measured by an observer at infinity.
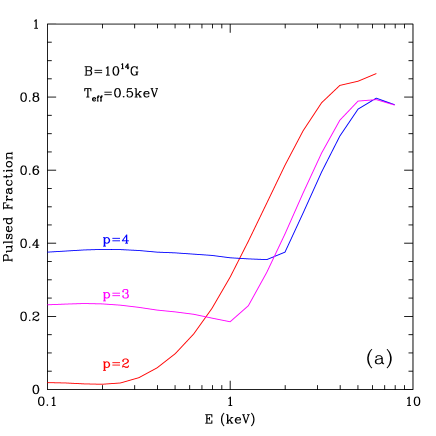
Figure 3 shows the energy dependence of the pulsed fractions for strongly magnetic neutron stars with antipodal emission geometry, for different values of the effective temperature and the relativity parameter . The results correspond to emission regions with angular size and of uniform temperature . Note that considering temperature variations within the hot caps increases the effects of temperature anisotropy. All curves have the same characteristic shape. They are flat at low pulsed fractions for photon energies below the peak of the phase-averaged spectrum, show a sharp increase at higher energies, and flatten again at high pulsed fractions. This prediction of a characteristic rise in the pulsed fractions with photon energy is the first diagnostic that we will compare with the observations discussed in §2. The horizontal displacement of the curves, along the energy axis, depends on the effective temperature and the compactness of the neutron star.
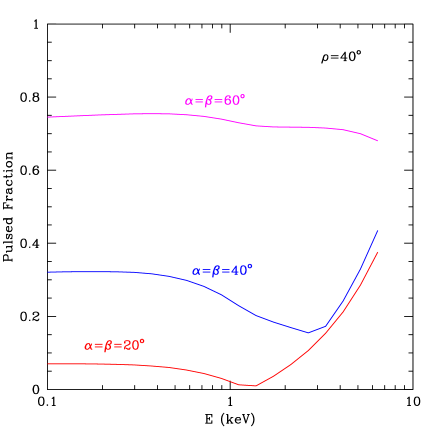
Several other properties of the model affect the energy dependence of the pulsed fractions. First, changing the magnetic field strength to G leaves the pulsed fraction nearly unchanged at energies keV, but gives rise to a slightly larger value at higher photon energies. This is because of the narrower fan beam of the higher magnetic field case in this energy range. Second, changing the orientation angles to values less than suppresses the pulsed fraction at all photon energies but does not affect this characteristic shape. Finally, the temperature distribution given in equation (2) does not change the overall characteristics of the energy dependence of the pulsed fractions but leads to lower pulsed fractions overall because of the larger effective emitting area of this model.
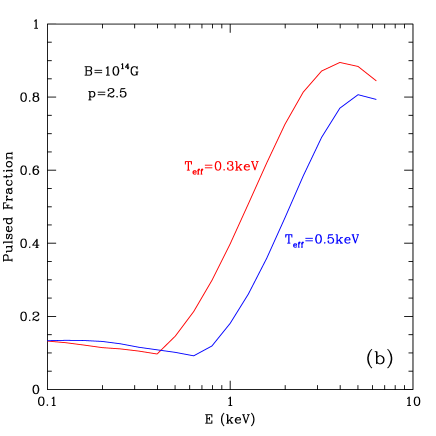
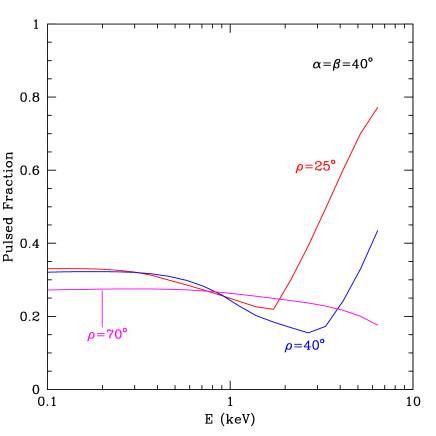
We also explore the possibility of a single hot emitting region on the neutron-star surface, with the rest of the star assumed to produce no radiation. This geometry is consistent with the presence of two peaks in the pulse profiles of AXPs because of the non-radial beaming of the surface emission from a magnetar (Özel 2001b). The results are shown in Figure 4.
While in general yielding a similar characteristically rising shape, the pulsed fractions in this case show a much wider range of behavior depending on the observer angle and the size of the emitting region. In particular, the pulsed fraction can be flat or weakly decreasing with photon energy, as shown in the two cases in Figure 4. This is because for observer angles that graze the emission cone, the significantly wider fan beams at low photon energies may combine along the magnetic axis due to the general relativistic effects and thus boost the flux observed at this pulse phase. At high energies, however, the fan beams, which are narrower and peak at larger angles away from the magnetic axis, remain distinct and observable as two peaks in the pulse cycle (see also Özel 2001b). The resulting pulse profiles can yield pulsed fractions that are constant or weakly decreasing with photon energy (Fig. 4a). Note that, when and , the pulsed fractions at all photon energies are close to unity.
A similar effect can be obtained by increasing the size of the emitting region (Fig. 4b). While decreasing the overall pulsed fraction, a large enough size of the emitting region also gives rise to weaker energy dependences of the pulsed fractions for the reasons discussed above. Note that this very weak energy dependence of the pulsed fraction shown in Figure 4 can be obtained for a significant region of the parameter space.
3.4 Broad-Band Variability
The pulsed fractions of thermally emitting magnetars typically increase with photon energy (§3.3). Therefore, the broad-band variability properties, which are relevant for comparison of theoretical models to data, depend on the chosen range of photon energies as well as on all the effects discussed in §3.3. In addition, interstellar extinction preferentially reduces the flux of low-energy photons that reach the observer. Thus, for the pulsed fraction that increases with photon energy, this preferential attenuation may increase the pulsed fraction measured over a wide energy range (Page 1995).
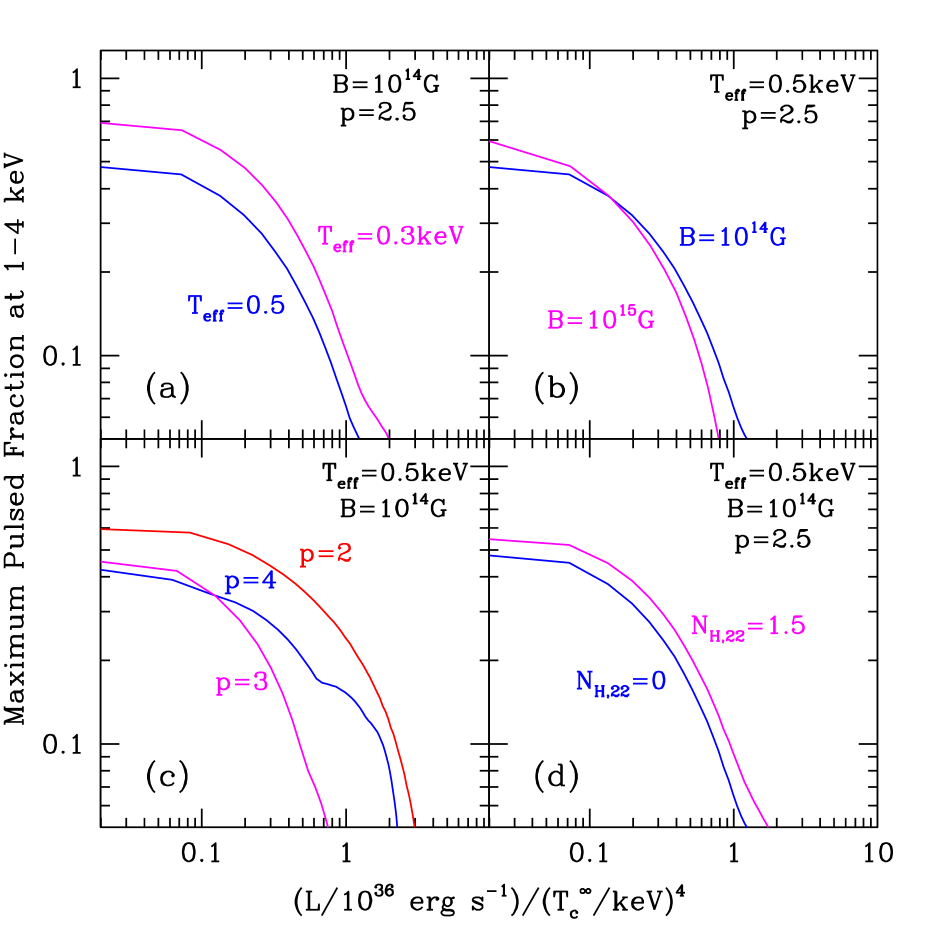
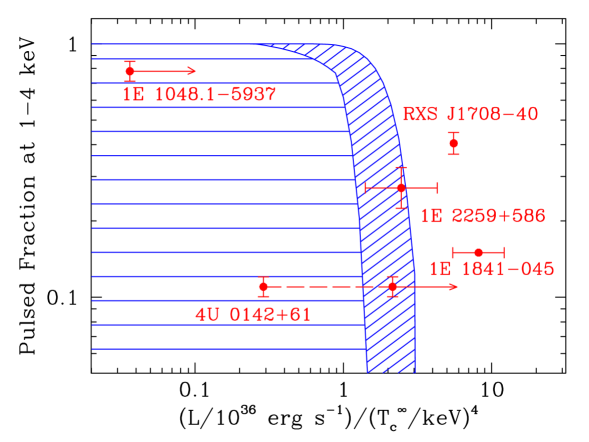
Most importantly, the pulsed fraction depends on the number and size of the hot emitting regions on the neutron star, which at the same time determine the total luminosity. For a given effective temperature, the luminosity decreases, while the pulsed fraction generally increases with decreasing size of the emitting region. Therefore, for any energy range, there exists a maximum pulsed fraction that can be attained for a given luminosity and for any combination of the orientation angles and . Figure 5 shows the maximal curves for different values of the model parameters. Note that in all cases, the orthogonal rotator geometry () gives rise to the maximal curve. No thermally emitting neutron star is allowed to lie above and to the right of these limiting curves, while the region below and to the left is permitted, since these smaller values of luminosity and pulsed fraction can be obtained for smaller values of the orientation angles without changing the other model parameters. The comparison of the allowed regions for the thermally emitting magnetar model to the observations of AXPs is the second diagnostic test that we perform in §4.
All quantities plotted in Figure 5 can be directly determined by observations. Specifically, the abscissa is the ratio of the energy-integrated luminosity of the thermal emission to the fourth power of the blackbody temperature that best reproduces its spectrum. The ordinate is the pulsed fraction of the photon flux measured in the keV energy range. This is the energy range in which the blackbody contribution to the photon flux is maximum and for which good determinations of pulsed fractions exist for all five AXPs considered here (see Fig. 1).
We assume a fiducial neutron star radius of 10 km in calculating the quantity plotted in the abscissa of Figures 5-7. Considering, e.g., a 15 km radius would result in a increase in the total luminosity and thus would shift the curves to the right by this factor. The dependence of the curves on , , and , shown in the first three panels, follows directly from the discussion of the energy-dependent pulsed fraction presented in §3.3. The last panel shows the dependence of the maximum pulsed fraction on the hydrogen column that describes the effect of interstellar extinction for the range of values measured from fitting the X-ray spectra of AXPs (see Table 3). The increase of the keV pulsed fraction with is marginal because of the narrow photon-energy range used as well as the relatively large values of and small values of indicated by observations (see Table 3). The large effect of interstellar extinction on pulsed fractions calculated by Perna et al. (2000) can only be obtained for significantly lower values of the color temperature ( keV) and higher values of the hydrogen column density ( cm-2), which are inconsistent with observations (§2).
4 CONSTRAINTS ON THERMAL EMISSION MODELS FROM DATA
In this section we compare the predictions of the different thermally emitting magnetar models to the observations of AXPs in order to determine those properties that can be accounted for in the models. In particular, we discuss (i) the energy dependence of the pulsed fractions and (ii) the maximum pulsed fractions and thermal luminosities that can be simultaneously produced by a magnetar.
The weak energy dependence of the observed AXP pulsed fractions in the keV range is at odds with the characteristic steeply rising pulsed fractions predicted by the models with two antipodal emitting regions. As Figure 3 shows, this steep increase of the pulsed fraction typically occurs in the keV energy band for the wide range of model parameters considered here, and does not depend on the effects of interstellar extinction. However, the detector response may play a significant role in giving rise to the observed weak dependence (Page 1995). This is primarily caused by the fact that the detector response is non-local in photon energy and a fraction of the counts that are detected at low-energy channels correspond to high energy photons. This may increase the pulsed fraction measured at low energies.
For the case of the single emitting region, a range of orientation angles combined with large emitting areas gives rise to pulsed fractions that depend very weakly on photon energy (§3.3). Therefore, for this range of angles and hot region sizes, the model with a single emission region can reproduce the weak energy dependence observed in the pulsed fractions of AXPs. For other angles, the steeply rising behavior is present for photon energies keV (see Fig. 4). The range of parameters that yields the observed weak dependence may be affected by the detector response and needs to be explored in more detail. X-ray observations with high spatial and energy resolutions and good coverage of the keV energy band made with Chandra and XMM-Newton can provide the conclusive test of this prediction.
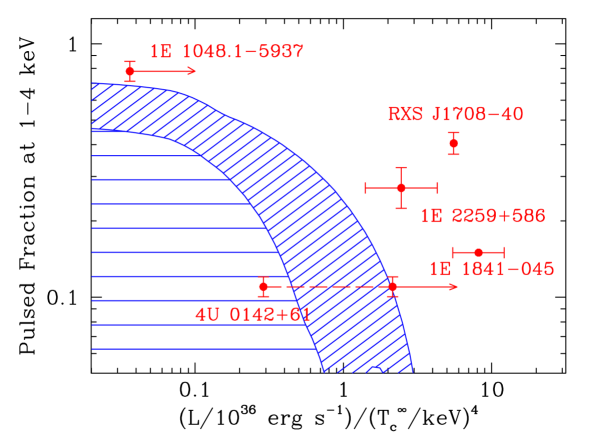
In Figure 6 we compare to observations the maximum pulsed fractions allowed by magnetar models, for neutron stars of different luminosities and color temperatures and with two antipodal emitting regions. The diagonally shaded band spans the range of all the maximal curves plotted in Figure 5 and corresponds to the entire range of neutron-star parameters that are consistent with the spectral data. Note that this band is obtained for which yields the maximum pulsed fraction. Varying the orientation angles results in bands that lie below the maximal one and cover the whole horizontally shaded region. Therefore, to be consistent with a thermally emitting magnetar model, all sources must lie within the shaded regions.
The data points are a synthesis of the various observed quantities summarized in Tables . In the case of 1E 2259586 and 1E 1841045, the horizontal error bars correspond to the uncertainties in the parameters of the spectral fits and the most conservative range of distance estimates to the sources. For 1E 1048.05937 and 4U 014261, the data points represent the conservative lower limits on the distance estimates discussed in §2.3. (Note that the two such limits for the latter source arise from the uncertain effect on the distance estimate of a molecular cloud along the line of sight). Finally, the luminosity of RXS J170840 has been inferred for the adopted fiducial distance.
For the antipodal emission geometry considered in Figure 6, all data points but one lie very far outside the region allowed for thermal emission from a magnetar. In addition, for orientation angles different from those of an orthogonal rotator, the discrepancy becomes rapidly larger, owing to the quick drop in the pulsed fraction with decreasing orientation angles in this antipodal configuration. We also emphasize that the regions outside of the hot caps are assumed not to contribute at all to the emission from the neutron star, and a more realistic temperature distribution would produce even lower pulsed fractions. Finally, for the temperature profile of a cooling magnetar given by Equation 2, the maximum pulsed fraction attained for a given luminosity is significantly below the diagonally shaded region. We therefore conclude that the properties of AXPs cannot be accounted for by a thermally emitting magnetar model with two identical antipodal emitting regions or one with the temperature profile of Equation 2. Note that considering a larger neutron star radius (see §3.4 ) would still not be enough to account for the data points and does not alter the results.
We then consider a single emitting region on the neutron star surface. The result is shown in Figure 7. The band of maximal curves is consistent with all but two data points. For these two sources to be reconciled with the theoretical models, the distance to RXS J170840 needs to be revised downwards by of the current best estimate, and the color temperature and blackbody luminosity measured for 1E 1841045 needs to be corrected for the effects of the hard spectral tail (see §2). We emphasize that in most cases, even though the maximal band is obtained for an orthogonal rotator, the consistency of the data with the models is not limited to a narrow range of orientations close to but is possible for a reasonable fraction of the parameter space. Finally, we note that a single emitting region configuration may be realized in the case of, e.g., largely asymmetric magnetic activity between the magnetic poles, an offset dipole magnetic field, or even for a non-dipolar geometry. However, the detailed properties of a physical mechanism that may lead to such an anisotropy have not yet been explored.
5 CONCLUSIONS
We have compared the detailed models of thermal emission from the surface of a magnetar (Özel 2001a, b) to the observed properties of AXPs. This comparison is relevant if the inferred blackbody component in the X-ray spectra of AXPs arises from surface emission. We have included in our model calculations the effects of a strongly magnetized atmosphere on the angle- and energy-dependence of the surface emission and the general relativistic photon transport to an observer at infinity. We have focused on the combined spectral and variability properties of the sources and specifically on their luminosities and pulsed fractions.
We have found that the large pulsed fractions combined with the high inferred luminosities of AXPs cannot be accounted for by surface emission from a magnetar with two antipodal hot regions or a temperature distribution characteristic of a magnetic dipole. Models with a single hot emitting region can reproduce the observations, if we allow for systematic uncertainties in the luminosity estimates of two of the sources, RXS J170840 and 1E 1841045. Conversely, the maximum allowed distances to all the sources are constrained within this model and the diagnostic can be used as an independent distance measurement if further study shows this model to be relevant for AXPs.
An even more detailed test of the models can be performed by comparing the predicted energy dependence of the pulsed fractions to observations. Current data appear to be inconsistent with the predictions of the model with antipodal emission geometry, but can be reproduced for a range of orientation angles and sizes of the emitting areas if the emission is localized to a single region on the surface. Upcoming observations of these sources with the Chandra and XMM-Newton observatories will yield the high spatial- and energy-resolution data that are required for this diagnostic test.
References
- (1)
- (2) Braun, R. & Strom, R. G. 1986, A&AS, 63, 345
- (3)
- (4) Cardall, C. Y., Prakash, M., & Lattimer, J. M. 2001, ApJ, submitted (astro-ph/0011148)
- (5)
- (6) Corbet, R. H. D. & Mihara, T. 1997, ApJ, 475, L127
- (7)
- (8) Crampton, D., Georgelin, Y. M., & Georgelin, Y. P. 1978, A&A, 66, 1
- (9)
- (10) DeDeo, S., Psaltis, D., & Narayan, R. 2001, ApJ, in press (astro-ph/0004266)
- (11)
- (12) Dickey, J. M. & Lockman, F. J. 1990, ARA&A, 28, 215
- (13)
- (14) Duncan, R. C. 1998, ApJ, 498, L45
- (15)
- (16) Fahlman, G. G. & Gregory, P. C. 1981, Nature, 293, 202
- (17)
- (18) Gaensler, B. M., Slane, P. O., Gotthelf, E. V., & Vasisht, G. 2001, ApJ, submitted (astro-ph/0104228)
- (19)
- (20) Gavriil, F. & Kaspi, V. 2001, ApJ, in press
- (21)
- (22) Gorenstein, P. 1975, ApJ, 198, 95
- (23)
- (24) Gotthelf, E. V. & Vasisht, G. 1997, ApJ, 486, L133
- (25)
- (26) Gotthelf, E. V., Vasisht, G., & Dotani, T. 1999, ApJ, 522, L49
- (27)
- (28) Hanson, C. G., Dennerl, K., Coe, M. J., & Davis, S. R. 1988, A&A, 195, 114
- (29)
- (30) Hellier, C. 1994, MNRAS, 271, L21
- (31)
- (32) Heyl, J. & Hernquist, L. E. 1998, MNRAS, 300, 599
- (33)
- (34) Ho, W. C. G. & Lai, D. 2001, MNRAS, in press (astro-ph/0104199)
- (35)
- (36) Hughes, V. A., Harten, R. H., Costain, C. H., Nelson, L. A., & Viner, M. R. 1984, ApJ, 283, 147
- (37)
- (38) Hulleman, F., van Kerkwijk, M. H., & Kulkarni, S. R. 2000a, Nature, 408, 689
- (39)
- (40) Hulleman, F., van Kerkwijk, M. H., Verbunt, F. W. M., & Kulkarni, S. R. 2000b, A&A, 358, 605
- (41)
- (42) Israel, G. L., Mereghetti, S., & Stella, L. 1994, ApJ, 433, L25
- (43)
- (44) Israel, G. L. et al. 1999, A&A, 346, 929
- (45)
- (46) Iwasawa, K., Koyama, K., & Halpern, J. P. 1992, PASJ, 44, 9
- (47)
- (48) Kaspi, V. M., Chakrabarty, D., & Steinberger, J. 1999, ApJ, 525, L33
- (49)
- (50) Kaspi, V. M., Gavriil, F. P., Chakrabarty, D., Lackey, J. R., & Muno, M. 2001, ApJ, in press (astro-ph/0011368)
- (51)
- (52) Koyama, K., Hoshi, R., & Nagase, F. 1987, PASJ, 39, 801
- (53)
- (54) Koyama, K. et al. 1989, PASJ, 41, 461
- (55)
- (56) Mereghetti, S. in proceedings of The Neutron Star - Black Hole Connection, in press (astro-ph/9911252)
- (57)
- (58) Mereghetti, S., Israel, G. L., & Stella, L. 1998, MNRAS, 296, 689
- (59)
- (60) Mereghetti, S. & Stella, L. 1995, ApJ, 442, L17
- (61)
- (62) Mészáros, P. 1992, Theoretical Astrophysics, Chicago: University of Chicago Press, 1992
- (63)
- (64) Morini, M., Robba, N. R., Smith, A., & van der Klis, M. 1988, ApJ, 333, 777
- (65)
- (66) Oosterbroek, T., Parmar, A. N., Mereghetti, S., & Israel, G. L. 1998, A&A, 334, 925
- (67)
- (68) Özel, F. 2001a, ApJ, in press (astro-ph/0103227)
- (69)
- (70) ———. 2001b, ApJ, submitted
- (71)
- (72) Page, D. 1995, ApJ, 442, 273
- (73)
- (74) Parmar, A. N., Oosterbroek, T., Favata, F., Pightling, S., Coe, M. J., Mereghetti, S., & Israel, G. L. 1998, A&A, 330, 175
- (75)
- (76) Paul, B., Kawasaki, M., Dotani, T., & Nagase, F. 2000, ApJ, 537, 319
- (77)
- (78) Pavlov, G. G., Shibanov, Y. A., Ventura, J., & Zavlin, V. E. 1994, A&A, 289, 837
- (79)
- (80) Pechenick, K. R., Ftaclas, C., & Cohen, J. M. 1983, ApJ, 274, 846
- (81)
- (82) Perna, R., Heyl, J., Hernquist, L., Juett, A., & Chakrabarty, D. 2001, ApJ, submitted (astro-ph/0103273)
- (83)
- (84) Perna, R., Heyl, J., & Hernquist, L. 2000, ApJ, 538, L159
- (85)
- (86) Pivovaroff, M. J., Kaspi, V. M., & Camilo, F. 2000, ApJ, 535, 379
- (87)
- (88) Predehl, P. & Schmitt, J. H. M. M. 1995, A&A, 293, 889
- (89)
- (90) Psaltis, D., Özel, F., & DeDeo, S. 2000, ApJ, 544, 390
- (91)
- (92) Rho, J. & Petre, R. 1997, ApJ, 484, 828
- (93)
- (94) Sanbonmatsu, K. Y. & Helfand, D. J. 1992, AJ, 104, 2189
- (95)
- (96) Seward, F. D., Charles, P. A., & Smale, A. P. 1986, ApJ, 305, 814
- (97)
- (98) Shibanov, I. A., Zavlin, V. E., Pavlov, G. G., & Ventura, J. 1992, A&A, 266, 313
- (99)
- (100) Sugizaki, M., et al. 1997, PASJ, 49, L25
- (101)
- (102) Tatematsu, K., Fukui, Y., Nakano, M., Kogure, T., Ogawa, H., & Kawabata, K. 1987, A&A, 184, 279
- (103)
- (104) Thompson, C. & Duncan, R. C. 1996, ApJ, 473, 322
- (105)
- (106) Turner, D. G. & Moffat, A. F. J. 1980, MNRAS, 192, 283
- (107)
- (108) Vasisht, G. & Gotthelf, E. V. 1997, ApJ, 486, L129
- (109)
- (110) Wang, Z., Qu, Q., Luo, D., McCray, R., & Mac Low, M. 1992, ApJ, 388, 127
- (111)
- (112) White, N. E., Angelini, L., Ebisawa, K., Tanaka, Y., & Ghosh, P. 1996, ApJ, 463, L83
- (113)
- (114) Zane, S., Turolla, R., Stella, L., & Treves, A. 2001, ApJ, in press (astro-ph/0103316)
- (115)
| Source Name | (s) | ( s s-1) | ( G)aaInferred dipole magnetic field at the stellar pole for an orthogonal rotator. | ReferencesbbReferences: 1. Kaspi et al. 2001; 2. Kaspi, Chakrabarty, & Steinberger 1999; 3. Israel et al. 1999; 4. Vasisht & Gotthelf 1997 |
|---|---|---|---|---|
| 1E 1048.1–5937 | 6.45 | 8.5–38.1 | 2.4–5 | 1 |
| 1E 2259586 | 6.98 | 0.49 | 0.6 | 2 |
| 4U 014261 | 8.69 | 1.3 | 3 | |
| RXS J170840 | 11.0 | 4.6 | 2 | |
| 1E 1841045 | 11.8 | 7.5 | 4 |
| Source Name | Energy Range (keV) | Pulsed Fraction |
|---|---|---|
| 1E 1048.1–5937 | 1.0–1.5 | 0.76 0.08 |
| 1.5–2.0 | 0.74 0.05 | |
| 2.0–2.5 | 0.77 0.04 | |
| 2.5–4.0 | 0.84 0.03 | |
| 4.0–6.0 | 0.79 0.05 | |
| 6.0–10.0 | 0.54 0.12 | |
| 1E 2259586 | 0.2–2.2(?) | 0.27 0.02 |
| 0.5–2.0 | 0.35 0.14 | |
| 2.5–3.5 | 0.27 0.05 | |
| 4U 014261 | 0.5–1.5 | 0.12 0.01 |
| 1.5–4.0 | 0.11 0.01 | |
| 4.0–10.0 | 0.17 0.02 | |
| RXS J170840 | 0.8–2.0 | 0.39 0.04 |
| 2.0–4.0 | 0.42 0.04 | |
| 4.0–10.0 | 0.45 0.15 | |
| 1E 1841045 | 1.0–10.0 (?) |
| Source Name | (keV)aaFitted blackbody temperature | (km)bbApparent blackbody radius assuming isotropic emission from a sphere and a specific distance. | cm-2) | NotesccLine-style for Figure 1 and references: (1) Oosterbroek et al. 1998; (2) Corbet & Mihara 1997; (3) Paul et al. 2000; (4) Parmar et al. 1998; (5) White et al. 1996; (6) Israel et al. 1999; (7) Sugizaki et al. 1997; (8) Gotthelf & Vasisht 1997; Gotthelf, Vasisht, & Dotani 1999. |
|---|---|---|---|---|
| 1E 1048.1–5937 | 0.64 0.01 | (0.59 0.02) | 0.45 0.10 | 1 (solid) |
| 0.52 0.02 | (0.81 0.07) | 0.55 0.17 | 2 (short-dashed) | |
| 0.56 0.06 | (0.65 0.16) | 1.21 0.24 | 3 (dotted) | |
| 1E 2259586 | 0.44 0.01 | (3.3 0.3) | 0.87 0.05 | 4 |
| 4U 014261 | 0.39 0.01 | 2.4 | 0.95 0.04 | 5 (solid) |
| 0.38 0.01 | (2.2 0.2) | 1.17 0.04 | 3 (Aug 98–dotted) | |
| 0.42 0.02 | (1.5 0.2) | 1.11 0.07 | 6 (obs A–short-dashed) | |
| 0.36 0.01 | (1.5 0.5) | 0.98 0.06 | 6 (obs D–long-dashed) | |
| RXS J170840 | 0.41 0.03 | (8.2 1.6) | 1.42 0.02 | 7 |
| 1E 1841045 | 0.65 0.05 | 1.2 0.2 | 8 (only blackbody fit) |
| Source Name | Distance (kpc) | (erg s-1)aaBolometric blackbody luminosity inferred from phase-averaged spectra (see Table 3). |
|---|---|---|
| 1E 1048.1–5937 | ||
| 1E 2259586 | ||
| 4U 014261 | or | or |
| RXS J170840 | ||
| 1E 1841045 |